Cited by 29

The DOI matches its Crossref record; 4 of the 4 references it cites were found in a registry or an index.

An Amish founder mutation disrupts a PI(3)P-WHAMM-Arp2/3 complex–driven autophagosomal remodeling pathway

Mathiowetz, Alyssa J., Baple, Emma, Russo, Ashley J., Coulter, Alyssa M., Carrano, Eric, Brown, Judith D., Jinks, Robert N., Crosby, Andrew H., Campellone, Kenneth G.·2017·Molecular Biology of the Cell

Abstract

Actin nucleation factors function to organize, shape, and move membrane-bound organelles, yet they remain poorly defined in relation to disease. Galloway-Mowat syndrome (GMS) is an inherited disorder characterized by microcephaly and nephrosis resulting from mutations in the WDR73 gene. This core clinical phenotype appears frequently in the Amish, where virtually all affected individuals harbor homozygous founder mutations in WDR73 as well as the closely linked WHAMM gene, which encodes a nucleation factor. Here we show that patient cells with both mutations exhibit cytoskeletal irregularities and severe defects in autophagy. Reintroduction of wild-type WHAMM restored autophagosomal biogenesis to patient cells, while inactivation of WHAMM in healthy cell lines inhibited lipidation of the autophagosomal protein LC3 and clearance of ubiquitinated protein aggregates. Normal WHAMM function involved binding to the phospholipid PI(3)P and promoting actin nucleation at nascent autophagosomes. These results reveal a cytoskeletal pathway controlling autophagosomal remodeling and illustrate several molecular processes that are perturbed in Amish GMS patients.

Overview

The claims and statistics of this paper haven’t been checked yet.

Run the check — free, no account needed. It reads the open-access text and checks the sources it cites.

A few free checks a day · papers already verified open instantly · results are public

Integrity signals

Registry

Crossref · 10.1091/mbc.e17-01-0022

Cites

4 of 4 references verified0 citation errors · 0 not checkable

Statistics

Figures

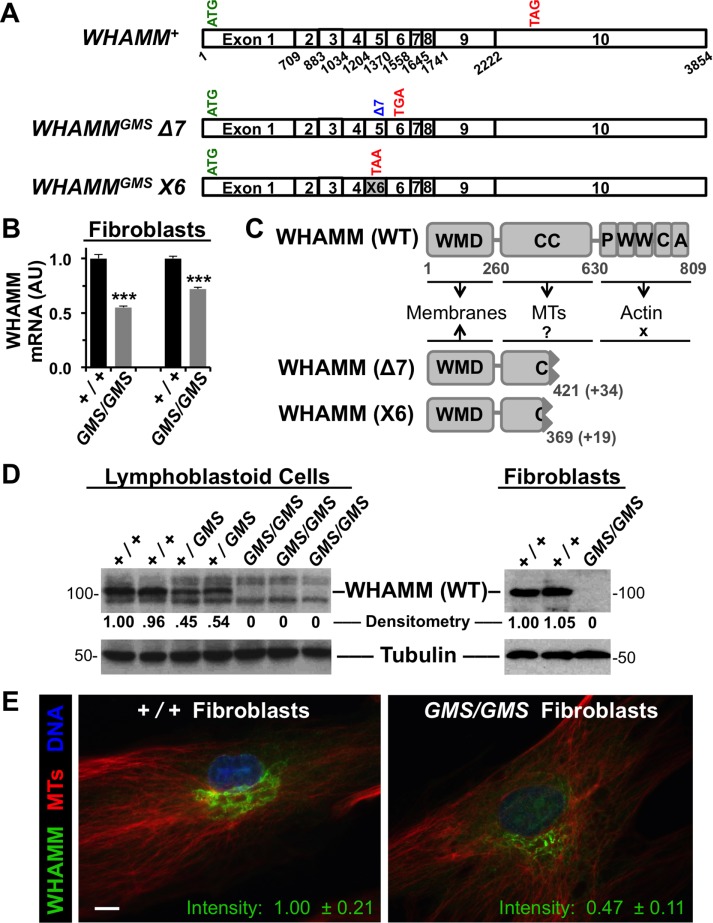
FIGURE 1: Cells from Amish GMS patients encode truncated WHAMM variants. (A) Diagrams of the exon organization in wild-type WHAMM cDNA and in the Δ7 and X6 variants are shown. Start and stop codons are indicated in green and red, respectively. (B) RNA was isolated from normal (+/+) or Amish GMS patient (GMS/GMS) fibroblasts and subjected to RT-PCR with primers to exons 9–10 of WHAMM or to β-actin. Relative levels of WHAMM-specific products (mean + SEM from three to four experiments) are shown. ***, p < 0.001 (t tests). (C) The 809-residue WHAMM(WT) protein includes a WMD that interacts with membranes, a CC region that binds microtubules (MTs), and a C-terminal PWWCA segment that promotes actin nucleation. The GMS Δ7 and X6 variants include the N-terminal 421 or 369 amino acids of WHAMM followed by 34 or 19 additional residues after the respective frameshifts. (D) Lymphoblastoid cell lines and skin fibroblasts from homozygous unaffected (+/+), heterozygous (+/GMS), or homozygous affected (GMS/GMS) individuals were subjected to immunoblotting with anti-WHAMM (left), anti-WWCA (right), and anti-tubulin antibodies. Relative levels of WHAMM(WT) were determined by densitometry of a representative blot. (E) Wild-type (+/+) or GMS patient (GMS/GMS) fibroblasts were stained with antibodies to visualize WHAMM (green) and microtubules (red), and with DAPI to label DNA (blue). The fluorescence intensity of WHAMM staining (mean ± SEM from 10–12 cells per genotype) was lower in patient cells, p < 0.001 (t test). Scale bar: 10 μm.
FIGURE 1: Cells from Amish GMS patients encode truncated WHAMM variants. (A) Diagrams of the exon organization in wild-type WHAMM cDNA and in the Δ7 and X6 variants are shown. Start and stop codons are indicated in green and red, respectively. (B) RNA was isolated from normal (+/+) or Amish GMS patient (GMS/GMS) fibroblasts and subjected to RT-PCR with primers to exons 9–10 of WHAMM or to β-actin. Relative levels of WHAMM-specific products (mean + SEM from three to four experiments) are shown. ***, p < 0.001 (t tests). (C) The 809-residue WHAMM(WT) protein includes a WMD that interacts with membranes, a CC region that binds microtubules (MTs), and a C-terminal PWWCA segment that promotes actin nucleation. The GMS Δ7 and X6 variants include the N-terminal 421 or 369 amino acids of WHAMM followed by 34 or 19 additional residues after the respective frameshifts. (D) Lymphoblastoid cell lines and skin fibroblasts from homozygous unaffected (+/+), heterozygous (+/GMS), or homozygous affected (GMS/GMS) individuals were subjected to immunoblotting with anti-WHAMM (left), anti-WWCA (right), and anti-tubulin antibodies. Relative levels of WHAMM(WT) were determined by densitometry of a representative blot. (E) Wild-type (+/+) or GMS patient (GMS/GMS) fibroblasts were stained with antibodies to visualize WHAMM (green) and microtubules (red), and with DAPI to label DNA (blue). The fluorescence intensity of WHAMM staining (mean ± SEM from 10–12 cells per genotype) was lower in patient cells, p < 0.001 (t test). Scale bar: 10 μm.CC BY-NC-SA · PubMed Central
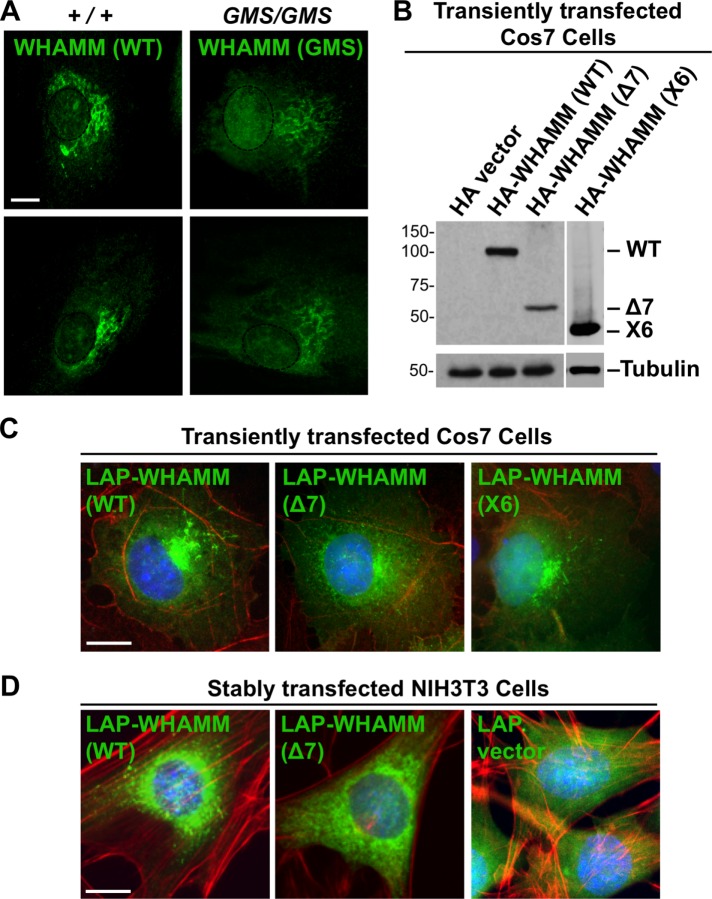
FIGURE 2: Truncated WHAMM proteins exhibit altered properties in cells. (A) Fibroblasts from two healthy (+/+) Amish individuals or Amish GMS (GMS/GMS) patients were fixed and stained with anti-CC antibodies to visualize WHAMM (green). Nuclei, based on DAPI staining, were denoted with dashed ovals. (B) Cos7 cells were transfected with plasmids encoding a vector control, HA-WHAMM(WT), (Δ7), or (X6) and blotted with anti-HA or anti-tubulin antibodies. (C) Cos7 cells transiently expressing LAP-WHAMM(WT), (Δ7), or (X6) (green due to the GFP tag) were fixed and stained with phalloidin to visualize F-actin (red) and with DAPI to label DNA (blue). (D) NIH3T3 cells stably transfected with LAP-WHAMM(WT) or (Δ7) or a LAP vector control were fixed and stained as in C. All scale bars: 10 μm.
FIGURE 2: Truncated WHAMM proteins exhibit altered properties in cells. (A) Fibroblasts from two healthy (+/+) Amish individuals or Amish GMS (GMS/GMS) patients were fixed and stained with anti-CC antibodies to visualize WHAMM (green). Nuclei, based on DAPI staining, were denoted with dashed ovals. (B) Cos7 cells were transfected with plasmids encoding a vector control, HA-WHAMM(WT), (Δ7), or (X6) and blotted with anti-HA or anti-tubulin antibodies. (C) Cos7 cells transiently expressing LAP-WHAMM(WT), (Δ7), or (X6) (green due to the GFP tag) were fixed and stained with phalloidin to visualize F-actin (red) and with DAPI to label DNA (blue). (D) NIH3T3 cells stably transfected with LAP-WHAMM(WT) or (Δ7) or a LAP vector control were fixed and stained as in C. All scale bars: 10 μm.CC BY-NC-SA · PubMed Central
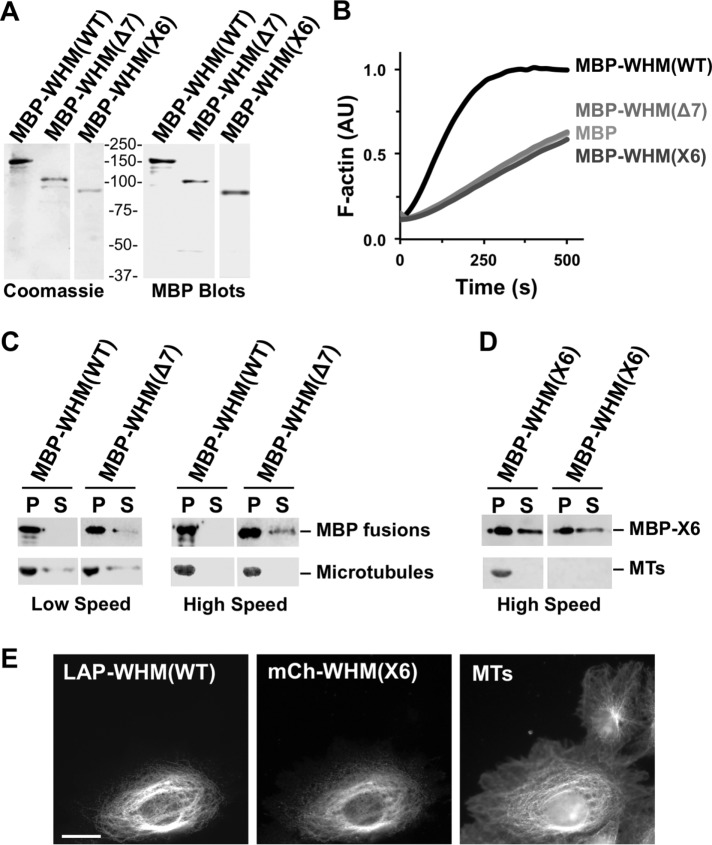
FIGURE 3: Amish GMS WHAMM truncations do not promote actin nucleation but can associate with microtubules. (A) Purified MBP-WHAMM(WT), (Δ7), and (X6) were analyzed by SDS–PAGE and Coomassie blue staining or anti-MBP immunoblotting. WHAMM is abbreviated WHM. (B) Actin was polymerized in the presence of the Arp2/3 complex and either MBP, MBP-WHAMM(WT), (Δ7), or (X6). The amount of F-actin, in arbitrary fluorescent units (AU), formed over time is shown. (C) Microtubules were incubated in the presence of MBP-WHAMM(WT) or (Δ7), and collected by centrifugation. Proteins found in pellet (P) and supernatant (S) samples were separated by SDS–PAGE. Tubulin was visualized by Ponceau S staining, while WHAMM fusions were detected by anti-MBP blotting. (D) MBP-WHAMM(X6) was incubated in the presence or absence of microtubules and processed as in C. (E) Cos7 cells transiently coexpressing LAP-WHAMM(WT) and mCherry-WHAMM(X6) were fixed and stained with antibodies to visualize microtubules.
FIGURE 3: Amish GMS WHAMM truncations do not promote actin nucleation but can associate with microtubules. (A) Purified MBP-WHAMM(WT), (Δ7), and (X6) were analyzed by SDS–PAGE and Coomassie blue staining or anti-MBP immunoblotting. WHAMM is abbreviated WHM. (B) Actin was polymerized in the presence of the Arp2/3 complex and either MBP, MBP-WHAMM(WT), (Δ7), or (X6). The amount of F-actin, in arbitrary fluorescent units (AU), formed over time is shown. (C) Microtubules were incubated in the presence of MBP-WHAMM(WT) or (Δ7), and collected by centrifugation. Proteins found in pellet (P) and supernatant (S) samples were separated by SDS–PAGE. Tubulin was visualized by Ponceau S staining, while WHAMM fusions were detected by anti-MBP blotting. (D) MBP-WHAMM(X6) was incubated in the presence or absence of microtubules and processed as in C. (E) Cos7 cells transiently coexpressing LAP-WHAMM(WT) and mCherry-WHAMM(X6) were fixed and stained with antibodies to visualize microtubules.CC BY-NC-SA · PubMed Central
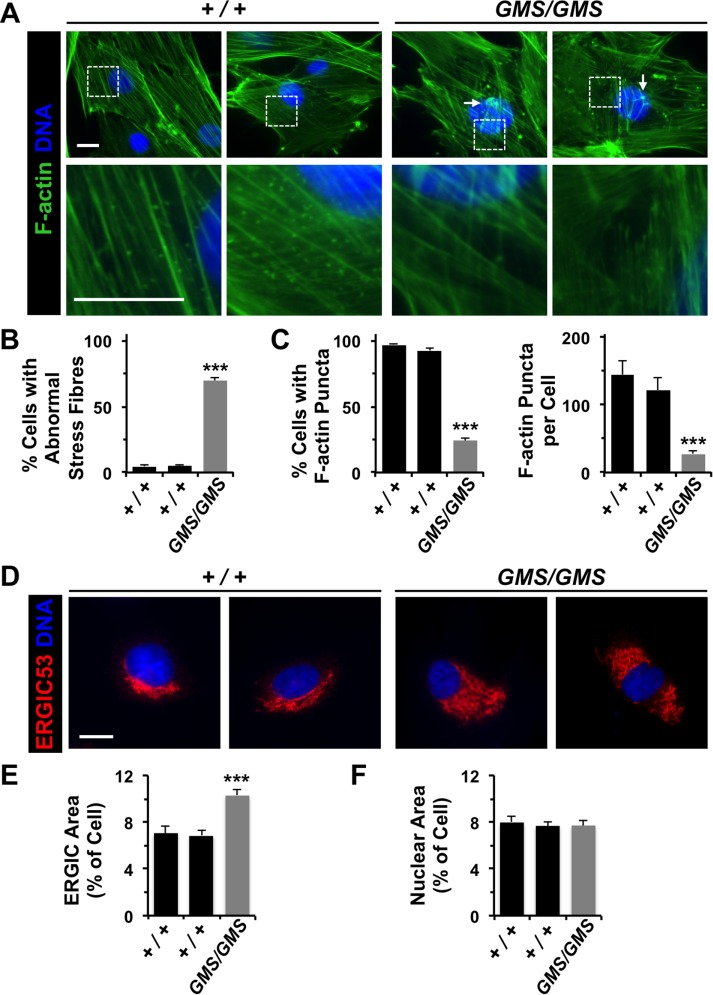
FIGURE 4: Amish GMS fibroblasts have altered F-actin organization and ERGIC morphology. (A) Fibroblasts from two healthy (+/+) Amish individuals or Amish GMS (GMS/GMS) patients were stained with phalloidin to visualize F-actin (green) and with DAPI to label DNA (blue). Unusual orthogonal bundles of F-actin fibers and aggregates are highlighted with arrows. A lack of cytoplasmic F-actin puncta in GMS cells is exemplified in the row of magnified images. (B) The percentage of cells with aberrant (orthogonal, aggregated, or stellate) F-actin stress fibers was quantified. Each bar represents the mean (+ SEM) from analyses of 350 cells. ***, p < 0.001 (Fisher’s exact test). (C) The percentage of cells with prominent cytoplasmic F-actin puncta in the juxtanuclear region was quantified. Each bar represents the mean (+ SEM) from analyses of 350 cells. For cells with puncta, the number per cell was also quantified. Each bar represents the mean (+ SEM) from analyses of 12 cells. ***, p < 0.001 (Fisher’s exact test, ANOVA). (D) Wild-type or GMS fibroblasts were stained with antibodies to detect ERGIC-53 (red) and with DAPI to label DNA (blue). (E, F) The areas occupied by the ERGIC, nucleus, and entire cell were calculated in ImageJ and converted to a ratio of organelle area/cell area. Each bar represents the mean (+ SEM) from analyses of 25 cells. ***, p < 0.001 (ANOVA). All scale bars: 10 μm.
FIGURE 4: Amish GMS fibroblasts have altered F-actin organization and ERGIC morphology. (A) Fibroblasts from two healthy (+/+) Amish individuals or Amish GMS (GMS/GMS) patients were stained with phalloidin to visualize F-actin (green) and with DAPI to label DNA (blue). Unusual orthogonal bundles of F-actin fibers and aggregates are highlighted with arrows. A lack of cytoplasmic F-actin puncta in GMS cells is exemplified in the row of magnified images. (B) The percentage of cells with aberrant (orthogonal, aggregated, or stellate) F-actin stress fibers was quantified. Each bar represents the mean (+ SEM) from analyses of 350 cells. ***, p < 0.001 (Fisher’s exact test). (C) The percentage of cells with prominent cytoplasmic F-actin puncta in the juxtanuclear region was quantified. Each bar represents the mean (+ SEM) from analyses of 350 cells. For cells with puncta, the number per cell was also quantified. Each bar represents the mean (+ SEM) from analyses of 12 cells. ***, p < 0.001 (Fisher’s exact test, ANOVA). (D) Wild-type or GMS fibroblasts were stained with antibodies to detect ERGIC-53 (red) and with DAPI to label DNA (blue). (E, F) The areas occupied by the ERGIC, nucleus, and entire cell were calculated in ImageJ and converted to a ratio of organelle area/cell area. Each bar represents the mean (+ SEM) from analyses of 25 cells. ***, p < 0.001 (ANOVA). All scale bars: 10 μm.CC BY-NC-SA · PubMed Central
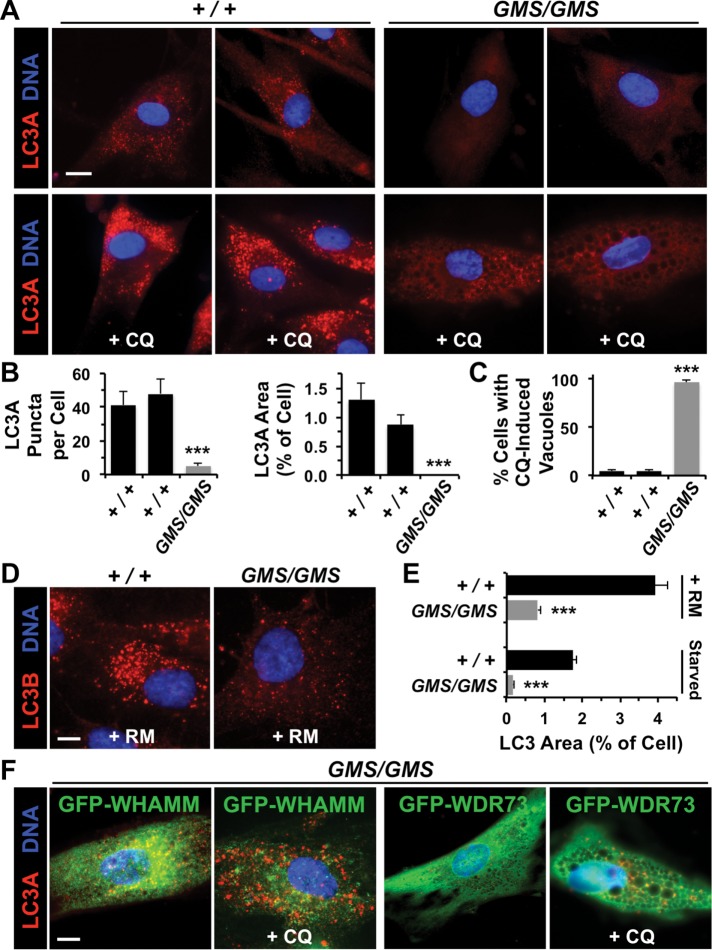
FIGURE 5: Amish GMS fibroblasts exhibit defects in autophagosomal biogenesis due to a loss in WHAMM function. (A) Fibroblasts from two healthy (+/+) Amish individuals or Amish GMS (GMS/GMS) patients were grown in the absence or presence of chloroquine (CQ) for 5 h and stained with antibodies to detect LC3A (red) and with DAPI to label DNA (blue). (B) The number of LC3A puncta per cell, and the relative area within each cell occupied by LC3+ structures was quantified using ImageJ. Each bar represents the mean (+ SEM) from analyses of 12 cells. ***, p < 0.001 (ANOVAs). (C) The percentage of cells with large cytoplasmic vacuoles was quantified. Each bar represents the mean (+ SEM) from analyses of 250 cells. ***, p < 0.001 (Fisher’s exact test). (D) Fibroblasts from a healthy individual or GMS patient were grown in the presence of rapamycin (RM) for 16 h and stained with antibodies to detect LC3B (red) and with DAPI to label DNA (blue). (E) Fibroblasts were treated with rapamycin for 16 h or starved for 90 min and stained as in D. The relative area within each cell occupied by LC3+ structures was quantified as in B. ***, p < 0.001 (t test). (F) Fibroblasts from a GMS patient were transfected with plasmids encoding GFP-WHAMM or GFP-WDR73, grown in the absence or presence of CQ, and stained as in A. Normal LC3 staining was observed in 29/35 GFP-WHAMM-expressing cells and 5/37 GFP-WDR73-expressing cells. All scale bars: 10 μm.
FIGURE 5: Amish GMS fibroblasts exhibit defects in autophagosomal biogenesis due to a loss in WHAMM function. (A) Fibroblasts from two healthy (+/+) Amish individuals or Amish GMS (GMS/GMS) patients were grown in the absence or presence of chloroquine (CQ) for 5 h and stained with antibodies to detect LC3A (red) and with DAPI to label DNA (blue). (B) The number of LC3A puncta per cell, and the relative area within each cell occupied by LC3+ structures was quantified using ImageJ. Each bar represents the mean (+ SEM) from analyses of 12 cells. ***, p < 0.001 (ANOVAs). (C) The percentage of cells with large cytoplasmic vacuoles was quantified. Each bar represents the mean (+ SEM) from analyses of 250 cells. ***, p < 0.001 (Fisher’s exact test). (D) Fibroblasts from a healthy individual or GMS patient were grown in the presence of rapamycin (RM) for 16 h and stained with antibodies to detect LC3B (red) and with DAPI to label DNA (blue). (E) Fibroblasts were treated with rapamycin for 16 h or starved for 90 min and stained as in D. The relative area within each cell occupied by LC3+ structures was quantified as in B. ***, p < 0.001 (t test). (F) Fibroblasts from a GMS patient were transfected with plasmids encoding GFP-WHAMM or GFP-WDR73, grown in the absence or presence of CQ, and stained as in A. Normal LC3 staining was observed in 29/35 GFP-WHAMM-expressing cells and 5/37 GFP-WDR73-expressing cells. All scale bars: 10 μm.CC BY-NC-SA · PubMed Central
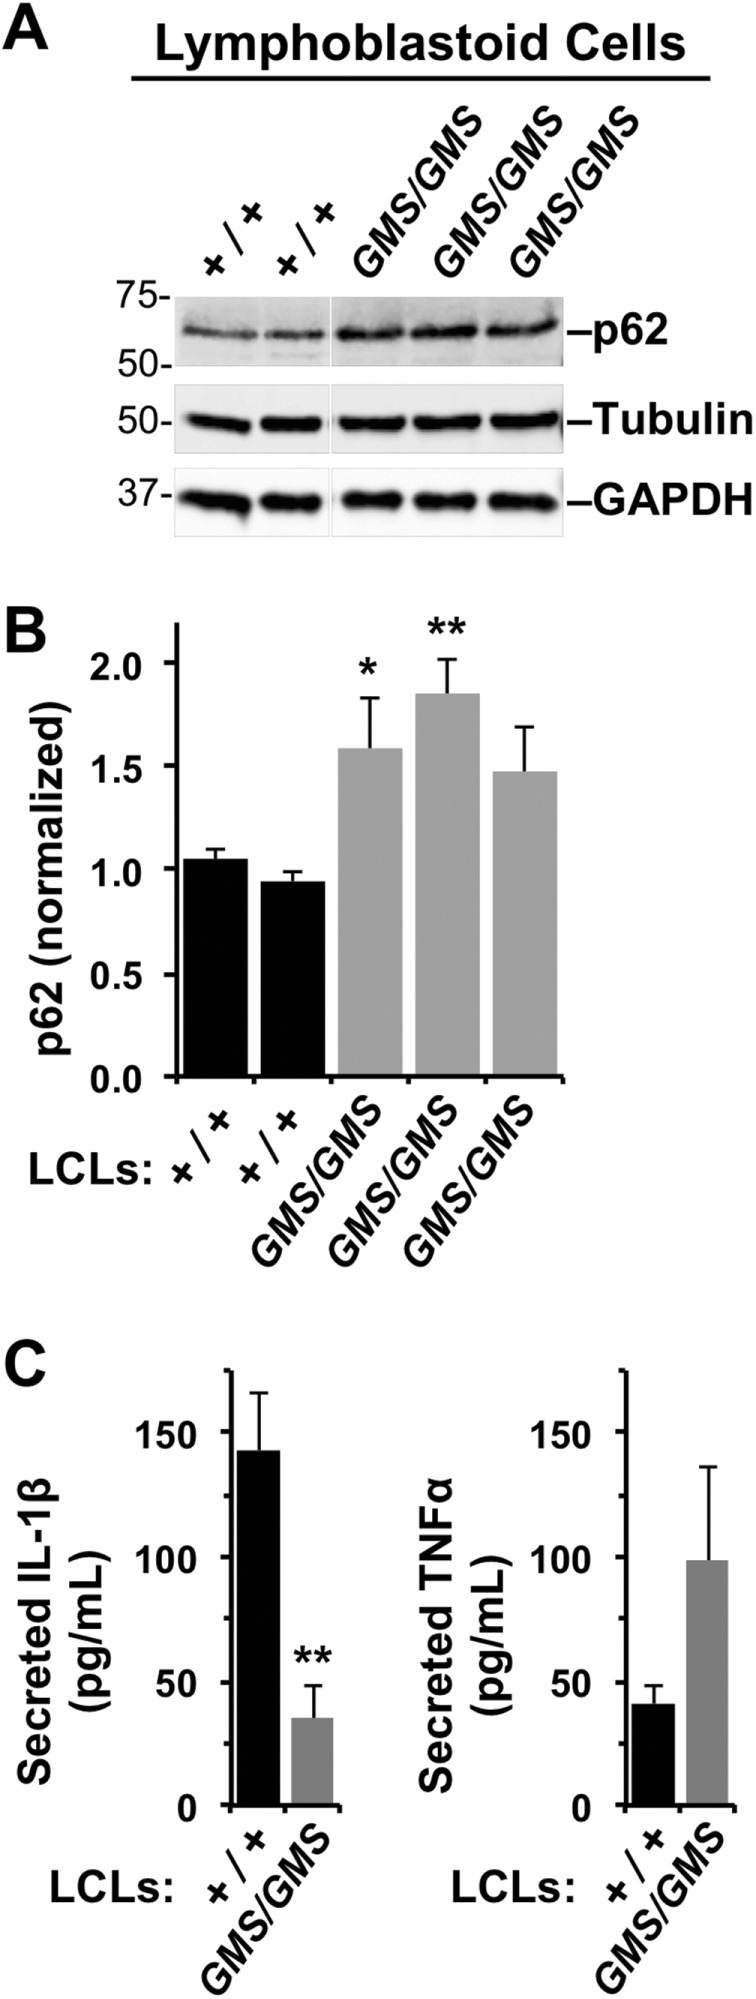
FIGURE 6: Lymphoblastoid cell lines from Amish GMS patients exhibit defects in autophagy-related processes. (A) LCLs from two healthy (+/+) Amish individuals or three Amish GMS (GMS/GMS) patients were cultured under normal growth conditions, collected, and subjected to immunoblotting with anti-p62/SQSTM1, anti-tubulin, and anti-GAPDH antibodies. (B) p62 band intensities were quantified relative to tubulin. Each bar represents the mean (+ SD) from analyses of three experiments. *, p < 0.05; **, p < 0.01 (ANOVA). (C) LCLs from several healthy (+/+) or Amish GMS (GMS/GMS) patients were stimulated with E. coli, and the levels of IL-1β and TNFα in culture supernatants were measured by ELISA. Each bar represents the mean (+ SEM) from four to six samples across two to three experiments. Data represent two to three patients per genotype. **, p < 0.01 (ANOVA).
FIGURE 6: Lymphoblastoid cell lines from Amish GMS patients exhibit defects in autophagy-related processes. (A) LCLs from two healthy (+/+) Amish individuals or three Amish GMS (GMS/GMS) patients were cultured under normal growth conditions, collected, and subjected to immunoblotting with anti-p62/SQSTM1, anti-tubulin, and anti-GAPDH antibodies. (B) p62 band intensities were quantified relative to tubulin. Each bar represents the mean (+ SD) from analyses of three experiments. *, p < 0.05; **, p < 0.01 (ANOVA). (C) LCLs from several healthy (+/+) or Amish GMS (GMS/GMS) patients were stimulated with E. coli, and the levels of IL-1β and TNFα in culture supernatants were measured by ELISA. Each bar represents the mean (+ SEM) from four to six samples across two to three experiments. Data represent two to three patients per genotype. **, p < 0.01 (ANOVA).CC BY-NC-SA · PubMed Central
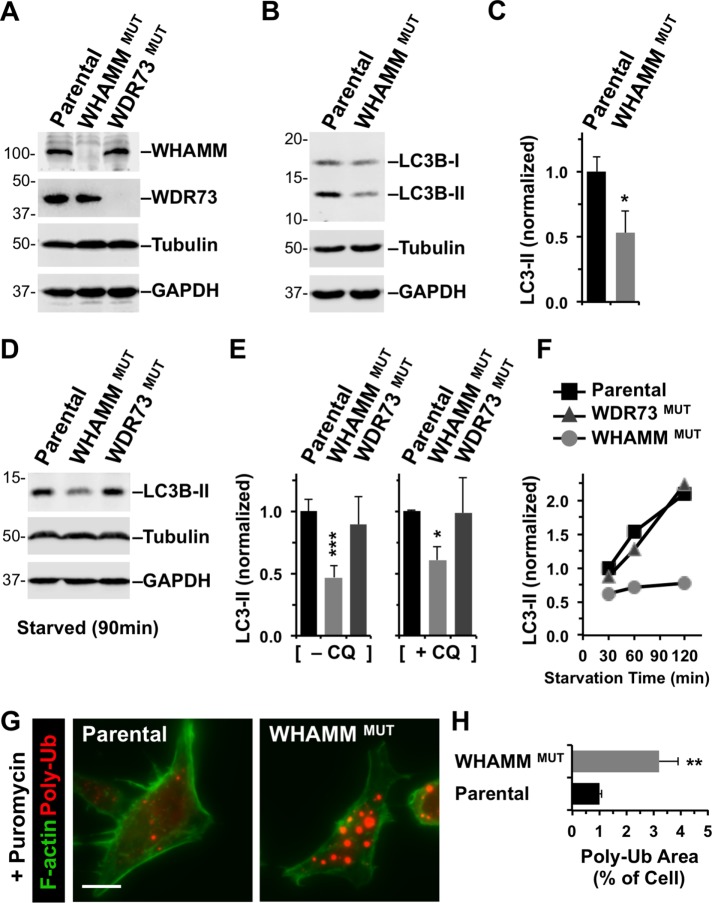
FIGURE 7: Targeted inactivation of WHAMM inhibits lipidation of LC3 and clearance of protein aggregates. (A) Parental eHAP cells or cells with mutations engineered in WHAMM or WDR73 were analyzed by immunoblotting for WHAMM, WDR73, tubulin, and GAPDH. (B) eHAP and WHAMMMUT cells were analyzed by immunoblotting for LC3B, tubulin, and GAPDH. LC3B was detected in its immature (LC3-I) and mature lipidated (LC3-II) forms. (C) LC3B-II band intensities were quantified relative to tubulin. Each bar represents the mean (+ SD) from analyses of three experiments. *, p < 0.05 (t test). (D, E) eHAP cell derivatives were starved for 90 min in the absence or presence of chloroquine (CQ), and LC3-II levels were measured as in B and C. Each bar represents the mean (+ SD) from analyses of three to five experiments. *, p < 0.05; ***, p < 0.001 (ANOVA). (F) eHAP cell derivatives were starved for the indicated times, and LC3-II levels were measured as in C. (G) Parental or WHAMM-deficient cells were treated with puromycin for 3.5 h and stained with antibodies to visualize ubiquitinated protein aggregates (red) and with phalloidin to visualize F-actin (green). Scale bar: 10 μm. (H) The areas occupied by ubiquitinated protein aggregates and the entire cell were calculated using ImageJ and converted to a ratio. Each bar represents the mean (+ SEM) from analyses of 30–35 cells. **, p < 0.01 (t test).
FIGURE 7: Targeted inactivation of WHAMM inhibits lipidation of LC3 and clearance of protein aggregates. (A) Parental eHAP cells or cells with mutations engineered in WHAMM or WDR73 were analyzed by immunoblotting for WHAMM, WDR73, tubulin, and GAPDH. (B) eHAP and WHAMMMUT cells were analyzed by immunoblotting for LC3B, tubulin, and GAPDH. LC3B was detected in its immature (LC3-I) and mature lipidated (LC3-II) forms. (C) LC3B-II band intensities were quantified relative to tubulin. Each bar represents the mean (+ SD) from analyses of three experiments. *, p < 0.05 (t test). (D, E) eHAP cell derivatives were starved for 90 min in the absence or presence of chloroquine (CQ), and LC3-II levels were measured as in B and C. Each bar represents the mean (+ SD) from analyses of three to five experiments. *, p < 0.05; ***, p < 0.001 (ANOVA). (F) eHAP cell derivatives were starved for the indicated times, and LC3-II levels were measured as in C. (G) Parental or WHAMM-deficient cells were treated with puromycin for 3.5 h and stained with antibodies to visualize ubiquitinated protein aggregates (red) and with phalloidin to visualize F-actin (green). Scale bar: 10 μm. (H) The areas occupied by ubiquitinated protein aggregates and the entire cell were calculated using ImageJ and converted to a ratio. Each bar represents the mean (+ SEM) from analyses of 30–35 cells. **, p < 0.01 (t test).CC BY-NC-SA · PubMed Central
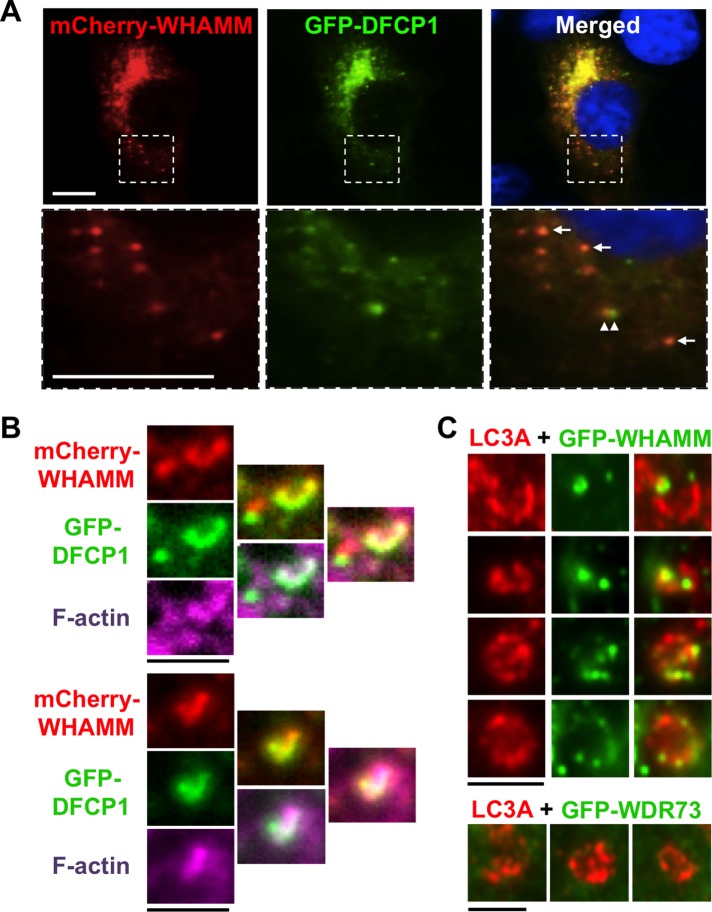
FIGURE 8: WHAMM localizes to omegasomes and subdomains of nascent autophagosomes. (A) Cos7 cells transiently expressing mCherry-WHAMM (red) and GFP-DFCP1 (green) were starved and stained with DAPI to label DNA (blue). Arrows indicate areas of WHAMM and DFCP1 colocalization; arrowheads highlight a region of WHAMM and DFCP1 juxtaposition. Scale bars: 10 μm. (B) Cos7 cells transiently expressing mCherry-WHAMM (red) and GFP-DFCP1 (green) were starved and stained with phalloidin to label F-actin (pink). Scale bars: 1.5 μm. (C) Cos7 cells transiently expressing GFP-WHAMM or GFP-WDR73 (green) were starved and stained with antibodies to label LC3 (red). Individual autophagosomal structures with punctate GFP-WHAMM localization to regions of membrane growth or curvature are highlighted in this composite. Scale bars: 1.5 μm.
FIGURE 8: WHAMM localizes to omegasomes and subdomains of nascent autophagosomes. (A) Cos7 cells transiently expressing mCherry-WHAMM (red) and GFP-DFCP1 (green) were starved and stained with DAPI to label DNA (blue). Arrows indicate areas of WHAMM and DFCP1 colocalization; arrowheads highlight a region of WHAMM and DFCP1 juxtaposition. Scale bars: 10 μm. (B) Cos7 cells transiently expressing mCherry-WHAMM (red) and GFP-DFCP1 (green) were starved and stained with phalloidin to label F-actin (pink). Scale bars: 1.5 μm. (C) Cos7 cells transiently expressing GFP-WHAMM or GFP-WDR73 (green) were starved and stained with antibodies to label LC3 (red). Individual autophagosomal structures with punctate GFP-WHAMM localization to regions of membrane growth or curvature are highlighted in this composite. Scale bars: 1.5 μm.CC BY-NC-SA · PubMed Central
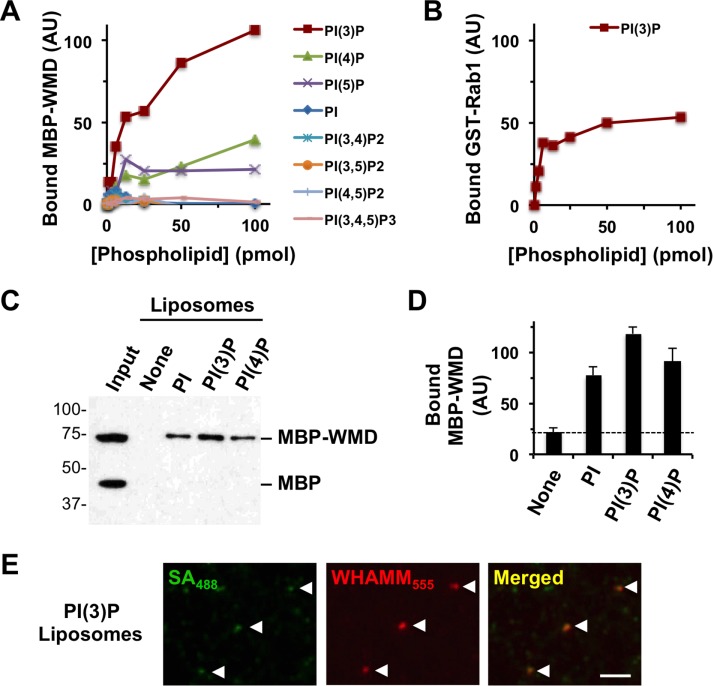
FIGURE 9: WHAMM binds to PI(3)P in vitro. (A) Different quantities of phospholipids immobilized on a nitrocellulose membrane were probed with purified MBP-WMD. Bound protein was detected using antibodies to MBP and visualized by chemiluminescence. MBP-WMD binding was quantified by measuring the mean pixel intensity of protein-specific spots after normalizing to background staining. (B) Different concentrations of PI(3)P immobilized on a nitrocellulose membrane were probed with purified GST-Rab1A. Bound protein was detected using antibodies to GST and quantified as in A. (C) Synthetic liposomes containing 5% of the indicated phosphoinositides were incubated with MBP and MBP-WMD and collected by centrifugation. Liposome-associated proteins were subjected to SDS–PAGE and detected by immunoblotting for MBP. (D) The amount of MBP-WMD pulled down was determined by densitometry. Each bar represents the mean (+ SD) from three to four experiments. (E) PI(3)P-containing biotinylated liposomes were mixed with Alexa Fluor 555–labeled MBP-WHAMM and Alexa Fluor 488–labeled streptavidin and examined microscopically.
FIGURE 9: WHAMM binds to PI(3)P in vitro. (A) Different quantities of phospholipids immobilized on a nitrocellulose membrane were probed with purified MBP-WMD. Bound protein was detected using antibodies to MBP and visualized by chemiluminescence. MBP-WMD binding was quantified by measuring the mean pixel intensity of protein-specific spots after normalizing to background staining. (B) Different concentrations of PI(3)P immobilized on a nitrocellulose membrane were probed with purified GST-Rab1A. Bound protein was detected using antibodies to GST and quantified as in A. (C) Synthetic liposomes containing 5% of the indicated phosphoinositides were incubated with MBP and MBP-WMD and collected by centrifugation. Liposome-associated proteins were subjected to SDS–PAGE and detected by immunoblotting for MBP. (D) The amount of MBP-WMD pulled down was determined by densitometry. Each bar represents the mean (+ SD) from three to four experiments. (E) PI(3)P-containing biotinylated liposomes were mixed with Alexa Fluor 555–labeled MBP-WHAMM and Alexa Fluor 488–labeled streptavidin and examined microscopically.CC BY-NC-SA · PubMed Central
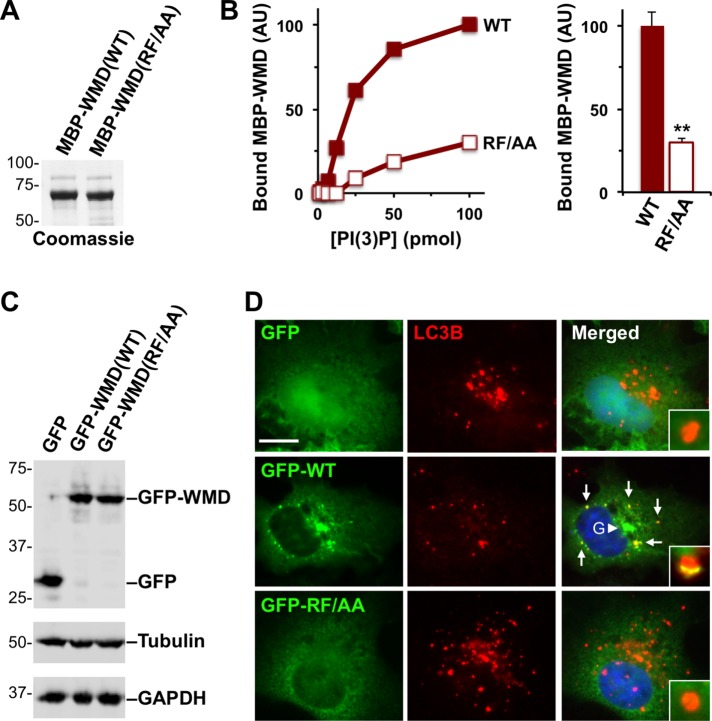
FIGURE 10: Point mutations in the WMD that disrupt binding to PI(3)P in vitro prevent localization to autophagosomes in cells. (A) Purified MBP-WMD(WT) and (RF/AA) were analyzed by SDS–PAGE and Coomassie blue staining. (B) Different quantities of phospholipids immobilized on a nitrocellulose membrane were probed with purified MBP-WMD(WT) or (RF/AA). Bound protein was detected using antibodies to MBP and quantified by measuring the intensity of protein-specific spots after normalizing to background staining. The bar graph represents the mean amounts (+ SEM) of MBP-WMD variants bound to 100 pmol of PI(3)P in three experiments. **, p < 0.01 (t test). (C) Cos7 cells were transiently transfected with plasmids encoding a GFP vector control, GFP-WMD(WT), or GFP-WMD(RF/AA) and blotted with anti-GFP, anti-tubulin, and anti-GAPDH antibodies. (D) Cos7 cells transiently expressing GFP, GFP-WMD(WT), or GFP-WMD(RF/AA) were starved and stained with antibodies to LC3B (red) and DAPI to label DNA (blue). Arrows indicate areas of WHAMM localization to LC3+ puncta; the arrowhead highlights the Golgi (G) region. Insets depict individual autophagosomes. Scale bar: 10 μm.
FIGURE 10: Point mutations in the WMD that disrupt binding to PI(3)P in vitro prevent localization to autophagosomes in cells. (A) Purified MBP-WMD(WT) and (RF/AA) were analyzed by SDS–PAGE and Coomassie blue staining. (B) Different quantities of phospholipids immobilized on a nitrocellulose membrane were probed with purified MBP-WMD(WT) or (RF/AA). Bound protein was detected using antibodies to MBP and quantified by measuring the intensity of protein-specific spots after normalizing to background staining. The bar graph represents the mean amounts (+ SEM) of MBP-WMD variants bound to 100 pmol of PI(3)P in three experiments. **, p < 0.01 (t test). (C) Cos7 cells were transiently transfected with plasmids encoding a GFP vector control, GFP-WMD(WT), or GFP-WMD(RF/AA) and blotted with anti-GFP, anti-tubulin, and anti-GAPDH antibodies. (D) Cos7 cells transiently expressing GFP, GFP-WMD(WT), or GFP-WMD(RF/AA) were starved and stained with antibodies to LC3B (red) and DAPI to label DNA (blue). Arrows indicate areas of WHAMM localization to LC3+ puncta; the arrowhead highlights the Golgi (G) region. Insets depict individual autophagosomes. Scale bar: 10 μm.CC BY-NC-SA · PubMed Central

Verification

Claims the paper makes

The claims and statistics of this paper haven’t been checked yet.

Run the check — free, no account needed. It reads the open-access text and checks the sources it cites.

A few free checks a day · papers already verified open instantly · results are public

Claims other papers make about this one

Each is checked against this paper’s own text: does it say what the citing paper says it does?

Self-check

Percentages, sums and reported differences re-computed from the paper’s own numbers.

The self-check needs the paper’s full text.

Citations

Cites

Show all 4 references

Research works printed but not linked: 47

  1. Aguilera MO, 2012, Autophagy, 8, 1590, 10.4161/auto.21459 · DOI
  2. Allantaz F, 2007, J Exp Med, 204, 2131, 10.1084/jem.20070070 · DOI
  3. Axe EL, 2008, J Cell Biol, 182, 685, 10.1083/jcb.200803137 · DOI · Paper page
  4. Ben-Omran T, 2015, J Med Genet, 52, 381, 10.1136/jmedgenet-2014-102707 · DOI
  5. Blom M, 2015, Exp Cell Res, 333, 208, 10.1016/j.yexcr.2015.02.023 · DOI
  6. Burgess T, 2014, Am J Med Genet A, 164, 77, 10.1002/ajmg.a.36203 · DOI
  7. Byrne S, 2016, Brain, 139, 765, 10.1093/brain/awv393 · DOI
  8. Campellone KG, 2012, J Biol Chem, 287, 20613, 10.1074/jbc.M112.363473 · DOI
  9. Campellone KG, 2008, Cell, 134, 148, 10.1016/j.cell.2008.05.032 · DOI
  10. Campellone KG, 2010, Nat Rev Mol Cell Biol, 11, 237, 10.1038/nrm2867 · DOI
  11. Carette JE, 2011, Nature, 477, 340, 10.1038/nature10348 · DOI
  12. Carlsson SR, 2015, J Cell Sci, 128, 193, 10.1242/jcs.141036 · DOI
  13. Choi AM, 2013, N Engl J Med, 368, 651, 10.1056/NEJMra1205406 · DOI · Paper page
  14. Colin E, 2014, Am J Hum Genet, 95, 637, 10.1016/j.ajhg.2014.10.011 · DOI
  15. Coutts AS, 2015, Nat Commun, 6, 7888, 10.1038/ncomms8888 · DOI
  16. Derry JM, 1994, Cell, 78, 635, 10.1016/0092-8674(94)90528-2 · DOI
  17. Doelken SC, 2013, Am J Med Genet A, 161, 218, 10.1002/ajmg.a.35695 · DOI
  18. Essletzbichler P, 2014, Genome Res, 24, 2059, 10.1101/gr.177220.114 · DOI
  19. 10.1091/mbc.e12-07-0555 · DOI
  20. Ge L, 2013, Elife, 2, e00947, 10.7554/eLife.00947 · DOI
  21. Ge L, 2014, Elife, 3, e04135, 10.7554/eLife.04135 · DOI
  22. 10.1091/mbc.e12-02-0101 · DOI · Paper page
  23. Huang J, 2011, Autophagy, 7, 17, 10.4161/auto.7.1.13840 · DOI
  24. Jinks RN, 2015, Brain, 138, 2173, 10.1093/brain/awv153 · DOI
  25. Kabeya Y, 2000, EMBO J, 19, 5720, 10.1093/emboj/19.21.5720 · DOI · Paper page
  26. Kast DJ, 2015, Curr Biol, 25, 1791, 10.1016/j.cub.2015.05.042 · DOI
  27. Kim M, 2016, Elife, 5, e12245, 10.7554/eLife.12245 · DOI · Paper page
  28. Mi N, 2015, Nat Cell Biol, 17, 1112, 10.1038/ncb3215 · DOI
  29. Moulding DA, 2013, Immunol Rev, 256, 282, 10.1111/imr.12114 · DOI
  30. Pollard TD, 2009, Science, 326, 1208, 10.1126/science.1175862 · DOI
  31. Roberts R, 2013, Essays Biochem, 55, 17, 10.1042/bse0550017 · DOI
  32. Rosti RO, 2016, Am J Med Genet A, 170, 992, 10.1002/ajmg.a.37533 · DOI
  33. Rosti RO, 2017, J Med Genet, 54, 399, 10.1136/jmedgenet-2016-104237 · DOI
  34. Rottner K, 2010, Trends Cell Biol, 20, 650, 10.1016/j.tcb.2010.08.014 · DOI
  35. Rotty JD, 2013, Nat Rev Mol Cell Biol, 14, 7, 10.1038/nrm3492 · DOI · Paper page
  36. 10.1091/mbc.E15-07-0508 · DOI
  37. Schluter K, 2014, Eur J Cell Biol, 93, 194, 10.1016/j.ejcb.2014.06.001 · DOI
  38. Shen QT, 2012, J Cell Biol, 199, 111, 10.1083/jcb.201204010 · DOI
  39. Teasdale RD, 2012, Biochem J, 441, 39, 10.1042/BJ20111226 · DOI · Paper page
  40. Vodopiutz J, 2015, Hum Mutat, 36, 1021, 10.1002/humu.22828 · DOI
  41. Wilbe M, 2015, PLoS Genet, 11, e1005248, 10.1371/journal.pgen.1005248 · DOI
  42. Xia P, 2013, EMBO J, 32, 2685, 10.1038/emboj.2013.189 · DOI
  43. Yang Z, 2010, Nat Cell Biol, 12, 814, 10.1038/ncb0910-814 · DOI
  44. Zavodszky E, 2014, Nat Commun, 5, 3828, 10.1038/ncomms4828 · DOI · Paper page
  45. Zhang M, 2015, Elife, 4, e11205, 10.7554/eLife.11205 · DOI
  46. Zoppino FC, 2010, Traffic, 11, 1246, 10.1111/j.1600-0854.2010.01086.x · DOI
  47. Zuchero JB, 2009, Nat Cell Biol, 11, 451, 10.1038/ncb1852 · DOI

Cited by

Sorted by citations

Metadata

Authors
Mathiowetz, A. J., Baple, E., Russo, A. J., Coulter, A. M., Carrano, E., Brown, J. D., Jinks, R. N., Crosby, A. H., & Campellone, K. G.
Venue
Molecular Biology of the Cell
Published
2017-09-15
Volume
28
Issue
19
Pages
2492-2507
ISSN
  • 1059-1524
  • 1939-4586
Cited by
29
References
4
Language
en

About these checks

Registry, retraction, Cites and statistics results are computed, not judged, with one exception: a printed reference that no index lists is read once by a model before it counts as a citation error. Claims are extracted by a model and kept only when their quote appears verbatim in the text; each cited source is then checked, with a model’s help, for whether it says what the claim relies on. Those verdicts can be wrong — read the claim’s quote and the cited source before relying on one.

Statistics and arithmetic are recomputed, not judged.

Confidence bands are shown only for fields calibrated on our annotated test set. None is calibrated yet, so no band is shown.

What counts as a claim ›How we measure confidence ›How we check this ›

Are you an author, or do you see a problem with this page? Request a review