Student or educator? Sign up with your school email and get 6 months of Pro free.
Cited by 96

The DOI matches its Crossref record.

Colloid osmotic parameterization and measurement of subcellular crowding

Mitchison, T. J.·2019·Molecular Biology of the Cell

Abstract

Crowding of the subcellular environment by macromolecules is thought to promote protein aggregation and phase separation. A challenge is how to parameterize the degree of crowding of the cell interior or artificial solutions that is relevant to these reactions. Here I review colloid osmotic pressure as a crowding metric. This pressure is generated by solutions of macromolecules in contact with pores that are permeable to water and ions but not macromolecules. It generates depletion forces that push macromolecules together in crowded solutions and thus promotes aggregation and phase separation. I discuss measurements of colloid osmotic pressure inside cells using the nucleus, the cytoplasmic gel, and fluorescence resonant energy transfer (FRET) biosensors as osmometers, which return a range of values from 1 to 20 kPa. I argue for a low value, 1–2 kPa, in frog eggs and perhaps more generally. This value is close to the linear range on concentration–pressure curves and is thus not crowded from an osmotic perspective. I discuss the implications of a low crowding pressure inside cells for phase separation biology, buffer design, and proteome evolution. I also discuss a pressure–tension model for nuclear shape, where colloid osmotic pressure generated by nuclear protein import inflates the nucleus.

Overview

The claims and statistics of this paper haven’t been checked yet.

Run the check — free, no account needed. It reads the open-access text and checks the sources it cites.

A few free checks a day · papers already verified open instantly · results are public

Integrity signals

Registry

Crossref · 10.1091/mbc.e18-09-0549

Cites

Statistics

Figures

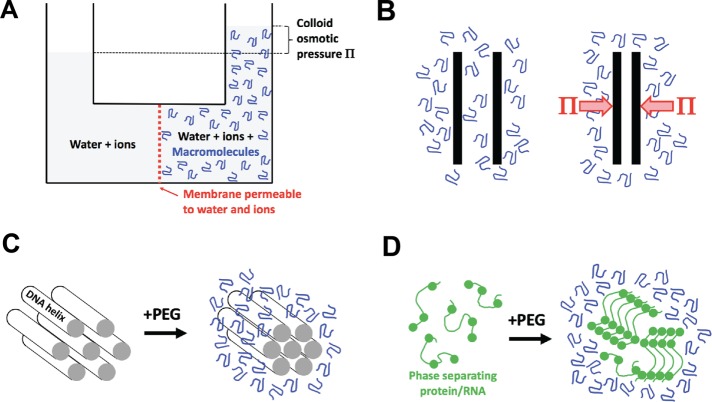
FIGURE 1: Colloid osmotic pressure (Π) and depletion forces. (A) Discovery of colloid osmotic pressure. The diagram conceptually illustrates Starling’s colloid osmometer, where the membrane was a stretched piece of peritoneal membrane and the macromolecule solution was blood plasma (Starling, 1896). The effective pore size depends on the diameter of the holes in the membrane, which permit free exchange of water and ions but not proteins. (B) Illustration of Asakura and Oosawa’s depletion force theory (Asakura and Oosawa, 1954). Two plates are immersed in a solution of macromolecule. When the plates approach closer than the hydrodynamic radius of the macromolecule, it is depleted (or excluded). Because there is now pure solvent (plus ions) between the plates, the solution outside the depleted region exerts a force per unit area which is given by the colloid osmotic pressure Π. The effective pore size is the distance between the plates when the depletion force starts to act. Depletion forces are related to “excluded volume effects,” although conceptually different formalisms are used to describe them (Rivas and Minton, 2018). (C) Compression of aligned DNA helices by PEG, as measured by x-ray diffraction (Podgornik et al., 1995). This is a practical implementation of Asakura and Oosawa’s theory. The effective pore size depends on the spaces in the lattice. (D) Phase separation of a disordered protein or RNA promoted by a crowding agent. The circles represent sites of weak, cohesive bonding. The effective pore size depends on the gaps between the macromolecules in the condensed phase. Note that phase separation involves demixing as well as compression, and the physics of the two processes are distinct (see the text).
FIGURE 1: Colloid osmotic pressure (Π) and depletion forces. (A) Discovery of colloid osmotic pressure. The diagram conceptually illustrates Starling’s colloid osmometer, where the membrane was a stretched piece of peritoneal membrane and the macromolecule solution was blood plasma (Starling, 1896). The effective pore size depends on the diameter of the holes in the membrane, which permit free exchange of water and ions but not proteins. (B) Illustration of Asakura and Oosawa’s depletion force theory (Asakura and Oosawa, 1954). Two plates are immersed in a solution of macromolecule. When the plates approach closer than the hydrodynamic radius of the macromolecule, it is depleted (or excluded). Because there is now pure solvent (plus ions) between the plates, the solution outside the depleted region exerts a force per unit area which is given by the colloid osmotic pressure Π. The effective pore size is the distance between the plates when the depletion force starts to act. Depletion forces are related to “excluded volume effects,” although conceptually different formalisms are used to describe them (Rivas and Minton, 2018). (C) Compression of aligned DNA helices by PEG, as measured by x-ray diffraction (Podgornik et al., 1995). This is a practical implementation of Asakura and Oosawa’s theory. The effective pore size depends on the spaces in the lattice. (D) Phase separation of a disordered protein or RNA promoted by a crowding agent. The circles represent sites of weak, cohesive bonding. The effective pore size depends on the gaps between the macromolecules in the condensed phase. Note that phase separation involves demixing as well as compression, and the physics of the two processes are distinct (see the text).CC BY-NC-SA · PubMed Central
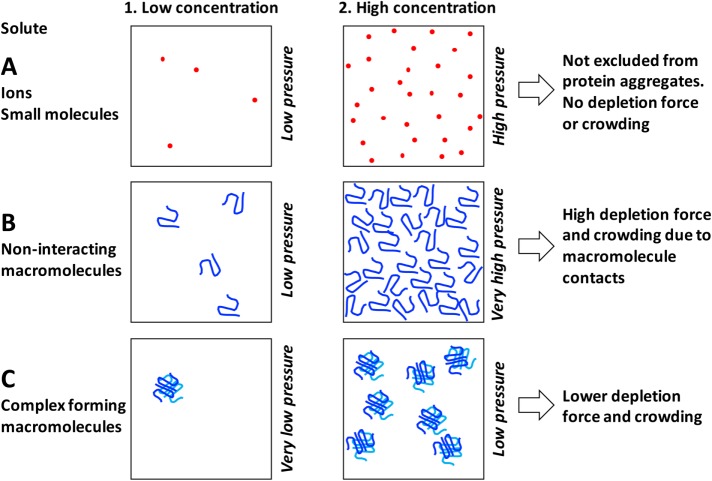
FIGURE 2: Effect of solute size and complex formation on osmotic and crowding activities. (A) Ions and small molecules exert osmotic pressure proportional to their concentration according to the van’t Hoff equation in both dilute and concentrated regimes. They no not exert depletion forces or crowding activity because they are smaller than the effective pore size of protein and nucleic acid aggregates. (B) Macromolecules exert colloid osmotic pressure according to the linear van’t Hoff equation in the dilute regime (B1). However, they become crowded at fairly low concentration due to their large size (B2). Once crowded, osmotic pressure begins to increase as a second or third power of concentration due to contact between molecules. Unstructured polymers like PEG or intrinsically disordered proteins become crowded at lower concentrations than globular proteins because of their less compact architecture. (C) Complex formation decreases osmotic and crowding activities of macromolecules and may account for a relatively low colloid osmotic pressures inside cells. The boxes contain as many monomers as in B but packaged into tetramers.
FIGURE 2: Effect of solute size and complex formation on osmotic and crowding activities. (A) Ions and small molecules exert osmotic pressure proportional to their concentration according to the van’t Hoff equation in both dilute and concentrated regimes. They no not exert depletion forces or crowding activity because they are smaller than the effective pore size of protein and nucleic acid aggregates. (B) Macromolecules exert colloid osmotic pressure according to the linear van’t Hoff equation in the dilute regime (B1). However, they become crowded at fairly low concentration due to their large size (B2). Once crowded, osmotic pressure begins to increase as a second or third power of concentration due to contact between molecules. Unstructured polymers like PEG or intrinsically disordered proteins become crowded at lower concentrations than globular proteins because of their less compact architecture. (C) Complex formation decreases osmotic and crowding activities of macromolecules and may account for a relatively low colloid osmotic pressures inside cells. The boxes contain as many monomers as in B but packaged into tetramers.CC BY-NC-SA · PubMed Central
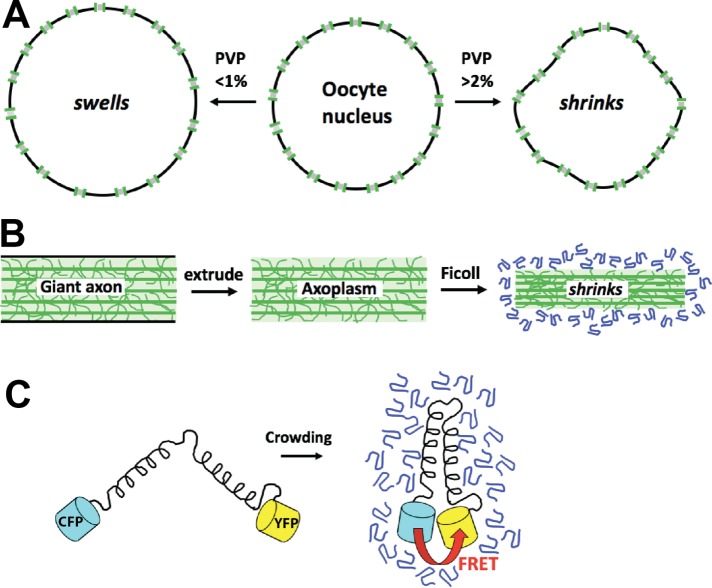
FIGURE 3: Osmometers for measurement of colloid osmotic pressure inside cells. (A) The cell nucleus as an osmometer (Harding and Feldherr, 1959). The cytoplasm of frog (Xenopus) oocytes was injected with a test solution containing isotonic salt and a variable concentration of PVP or BSA. If the test solution had a colloid osmotic pressure lower than that of cytoplasm, then the nucleus swelled; if higher, then it shrank. The pore size is governed by the molecular weight cut-off of nuclear pores. (B) Axoplasm extruded from the squid giant axon as a gel osmomoter (Spyropoulos, 1979). The axoplasmic gel shrinks if the ficoll test solution has a colloid osmotic pressure greater than the gel. The pore size depends on the physical properties of the gel. (C) FRET-based molecular osmometer (Liu et al., 2017). Increased colloid osmotic pressure causes the two fluorescent proteins to move closer together on average, leading to increased FRET. The pore size and dynamic range depend on the dimensions and molecular dynamics of the sensor and can be tuned by the structure of the arms. Versions of this sensor published so far had midpoints at considerably higher pressures than the inside of cells.
FIGURE 3: Osmometers for measurement of colloid osmotic pressure inside cells. (A) The cell nucleus as an osmometer (Harding and Feldherr, 1959). The cytoplasm of frog (Xenopus) oocytes was injected with a test solution containing isotonic salt and a variable concentration of PVP or BSA. If the test solution had a colloid osmotic pressure lower than that of cytoplasm, then the nucleus swelled; if higher, then it shrank. The pore size is governed by the molecular weight cut-off of nuclear pores. (B) Axoplasm extruded from the squid giant axon as a gel osmomoter (Spyropoulos, 1979). The axoplasmic gel shrinks if the ficoll test solution has a colloid osmotic pressure greater than the gel. The pore size depends on the physical properties of the gel. (C) FRET-based molecular osmometer (Liu et al., 2017). Increased colloid osmotic pressure causes the two fluorescent proteins to move closer together on average, leading to increased FRET. The pore size and dynamic range depend on the dimensions and molecular dynamics of the sensor and can be tuned by the structure of the arms. Versions of this sensor published so far had midpoints at considerably higher pressures than the inside of cells.CC BY-NC-SA · PubMed Central
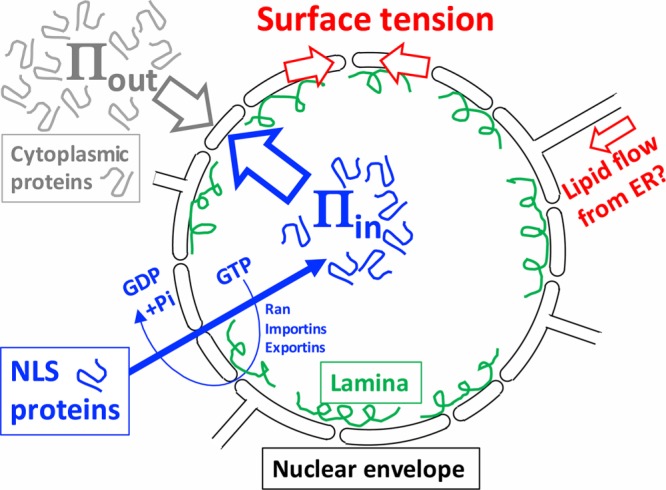
FIGURE 4: Osmotic model for nuclear morphology. The nuclear envelope (black lines) is a double lipid bilayer perforated by nuclear pores whose outer membrane is contiguous with the endoplasmic reticulum (ER). NLS protein are imported though nuclear pores (gaps) by an energy-coupled, facilitated diffusion process based on Ran, importins, and exportins (also called karyopherins) (blue arrows and text) (Schmidt and Görlich, 2016). We hypothesize the spherical shape is generated by a higher colloid osmotic pressure inside vs. outside (Πin > Πout) opposed by a surface tension (red arrows). Cytoplasmic crowding contributes to Πout and nuclear crowding to Πin. Surface tension is distributed between the lipid bilayers of the nuclear envelope and the nuclear lamina (green), which is a dynamic network of intermediate filaments. Membrane connections between the nuclear envelope and the ER allow lipid flow, which may regulate tension and allow nuclear growth (red arrow). Inflation of the nucleus by Πin is an example of colloid osmotic pressure performing mechanical work inside the cell. This model was inspired by observations in Xenopus egg extract. Similar models have been proposed to account for the response of tissue culture cell nuclei to osmotic and mechanical perturbations (Finan and Guilak, 2010; Kim et al., 2016).
FIGURE 4: Osmotic model for nuclear morphology. The nuclear envelope (black lines) is a double lipid bilayer perforated by nuclear pores whose outer membrane is contiguous with the endoplasmic reticulum (ER). NLS protein are imported though nuclear pores (gaps) by an energy-coupled, facilitated diffusion process based on Ran, importins, and exportins (also called karyopherins) (blue arrows and text) (Schmidt and Görlich, 2016). We hypothesize the spherical shape is generated by a higher colloid osmotic pressure inside vs. outside (Πin > Πout) opposed by a surface tension (red arrows). Cytoplasmic crowding contributes to Πout and nuclear crowding to Πin. Surface tension is distributed between the lipid bilayers of the nuclear envelope and the nuclear lamina (green), which is a dynamic network of intermediate filaments. Membrane connections between the nuclear envelope and the ER allow lipid flow, which may regulate tension and allow nuclear growth (red arrow). Inflation of the nucleus by Πin is an example of colloid osmotic pressure performing mechanical work inside the cell. This model was inspired by observations in Xenopus egg extract. Similar models have been proposed to account for the response of tissue culture cell nuclei to osmotic and mechanical perturbations (Finan and Guilak, 2010; Kim et al., 2016).CC BY-NC-SA · PubMed Central

Verification

Claims the paper makes

The claims and statistics of this paper haven’t been checked yet.

Run the check — free, no account needed. It reads the open-access text and checks the sources it cites.

A few free checks a day · papers already verified open instantly · results are public

Claims other papers make about this one

Each is checked against this paper’s own text: does it say what the citing paper says it does?

Self-check

Percentages, sums and reported differences re-computed from the paper’s own numbers.

The self-check needs the paper’s full text.

Citations

Cites

No references could be resolved yet.

Research works printed but not linked: 41

  1. Adair GS, 1928, Proc R Soc Lond A, 120, 573, 10.1098/rspa.1928.0167 · DOI
  2. Alberti S, 2018, J Mol Biol, 430, 4806, 10.1016/j.jmb.2018.06.038 · DOI
  3. Asakura S, 1954, J Chem Phys, 22, 1255, 10.1063/1.1740347 · DOI
  4. Boersma AJ, 2015, Nat Methods, 12, 227, 10.1038/nmeth.3257 · DOI
  5. Brangwynne CP, 2009, Science, 324, 1729, 10.1126/science.1172046 · DOI
  6. Delarue M, 2018, Cell, 174, 338, 10.1016/j.cell.2018.05.042 · DOI
  7. Dick DA, 1959, Int Rev Cytol, 8, 387, 10.1016/S0074-7696(08)62736-9 · DOI
  8. Dill KA, 2011, Proc Natl Acad Sci USA, 108, 17876, 10.1073/pnas.1114477108 · DOI · Paper page
  9. Eisenberg H, 1976, Biological Macromolecules and Polyelectrolytes in Solution
  10. Enyedi B, 2016, Cell, 165, 1160, 10.1016/j.cell.2016.04.016 · DOI
  11. Finan JD, 2010, J Cell Biochem, 109, 460, 10.1002/jcb.22437 · DOI
  12. Hall D, 2002, Biophys Chem, 98, 93, 10.1016/S0301-4622(02)00087-X · DOI
  13. Harding CV, 1959, J Gen Physiol, 42, 1155, 10.1085/jgp.42.6.1155 · DOI
  14. Hyman AA, 2014, Annu Rev Cell Dev Biol, 30, 39, 10.1146/annurev-cellbio-100913-013325 · DOI · Paper page
  15. Jin L, 2006, J Colloid Interface Sci, 304, 77, 10.1016/j.jcis.2006.08.046 · DOI
  16. Kim D-H, 2016, J Cell Sci, 129, 457, 10.1242/jcs.185173 · DOI
  17. Lee H, 2008, Biophys J, 95, 1590, 10.1529/biophysj.108.133025 · DOI
  18. Levy DL, 2010, Cell, 143, 288, 10.1016/j.cell.2010.09.012 · DOI
  19. Liu B, 2017, Biophys J, 112, 1929, 10.1016/j.bpj.2017.04.004 · DOI
  20. Luby-Phelps K, 1986, J Cell Biol, 102, 2015, 10.1083/jcb.102.6.2015 · DOI
  21. Magid AD, 1992, Exp Eye Res, 55, 615, 10.1016/S0014-4835(05)80174-5 · DOI
  22. Marenduzzo D, 2006, J Cell Biol, 175, 681, 10.1083/jcb.200609066 · DOI
  23. Minton AP, 2013, Biopolymers, 99, 239, 10.1002/bip.22163 · DOI
  24. Money NP, 1989, Plant Physiol, 91, 766, 10.1104/pp.91.2.766 · DOI
  25. Newport JW, 1990, J Cell Biol, 111, 2247, 10.1083/jcb.111.6.2247 · DOI
  26. Ogston AG, 1970, Biochem J, 119, 67, 10.1042/bj1190067 · DOI
  27. Parsegian VA, 2000, Proc Natl Acad Sci USA, 97, 3987, 10.1073/pnas.97.8.3987 · DOI
  28. Podgornik R, 1995, Biophys Chem, 57, 111, 10.1016/0301-4622(95)00058-6 · DOI
  29. Rand RP, 2000, Cell Mol Life Sci, 57, 1018, 10.1007/PL00000742 · DOI
  30. Rivas G, 2018, Biophys Rev, 10, 241, 10.1007/s12551-017-0347-6 · DOI
  31. Sama RRK, 2013, J Cell Physiol, 228, 2222, 10.1002/jcp.24395 · DOI
  32. Scatchard G, 1946, J Am Chem Soc, 68, 2315, 10.1021/ja01215a054 · DOI
  33. Schmidt HB, 2016, Trends Biochem Sci, 41, 46, 10.1016/j.tibs.2015.11.001 · DOI
  34. Schummel PH, 2017, Chemphyschem Eur J Chem Phys Phys Chem, 18, 189, 10.1002/cphc.201601032 · DOI
  35. Soranno A, 2014, Proc Natl Acad Sci USA, 111, 4874, 10.1073/pnas.1322611111 · DOI
  36. Spyropoulos CS, 1979, J Membr Biol, 47, 195, 10.1007/BF01869079 · DOI
  37. Starling EH, 1896, J Physiol, 19, 312, 10.1113/jphysiol.1896.sp000596 · DOI
  38. Vink H, 1971, Eur Polym J, 7, 1411, 10.1016/0014-3057(71)90035-8 · DOI
  39. Wang J, 2018, Cell, 174, 688, 10.1016/j.cell.2018.06.006 · DOI
  40. Wühr M, 2014, Curr Biol, 24, 1467, 10.1016/j.cub.2014.05.044 · DOI
  41. Wühr M, 2015, Curr Biol, 25, 2663, 10.1016/j.cub.2015.08.047 · DOI

Cited by

See all 96

Metadata

Authors
Mitchison, T. J.
Venue
Molecular Biology of the Cell
Published
2019-01-15
Volume
30
Issue
2
Pages
173-180
ISSN
  • 1059-1524
  • 1939-4586
Cited by
96
References
0
Language
en

About these checks

Registry, retraction, Cites and statistics results are computed, not judged, with one exception: a printed reference that no index lists is read once by a model before it counts as a citation error. Claims are extracted by a model and kept only when their quote appears verbatim in the text; each cited source is then checked, with a model’s help, for whether it says what the claim relies on. Those verdicts can be wrong — read the claim’s quote and the cited source before relying on one.

Statistics and arithmetic are recomputed, not judged.

Confidence bands are shown only for fields calibrated on our annotated test set. None is calibrated yet, so no band is shown.

What counts as a claim ›How we measure confidence ›How we check this ›

Are you an author, or do you see a problem with this page? Request a review

How to cite

Cite CoChat for the checks on this page, and the paper for its own findings.

This page
CoChat. (2026). Citation check: Colloid osmotic parameterization and measurement of subcellular crowding. https://app.cochat.ai/papers/10.1091/mbc.e18-09-0549
The paper
Mitchison, T. J. (2019). Colloid osmotic parameterization and measurement of subcellular crowding. Molecular Biology of the Cell. https://doi.org/10.1091/mbc.e18-09-0549

Data sources

Bibliographic data: Semantic Scholar, OpenAlex, Crossref.

Contains information from the Semantic Scholar Academic Graph Datasets, made available under the ODC Attribution License (ODC-BY 1.0).

Semantic Scholar’s data is described in: Kinney, R., et al. (2023). The Semantic Scholar Open Data Platform. arXiv:2301.10140.