

The DOI matches its Crossref record; 4 of the 4 references it cites were found in a registry or an index.
OMAmer: tree-driven and alignment-free protein assignment to subfamilies outperforms closest sequence approaches
Published version of a preprint
Abstract
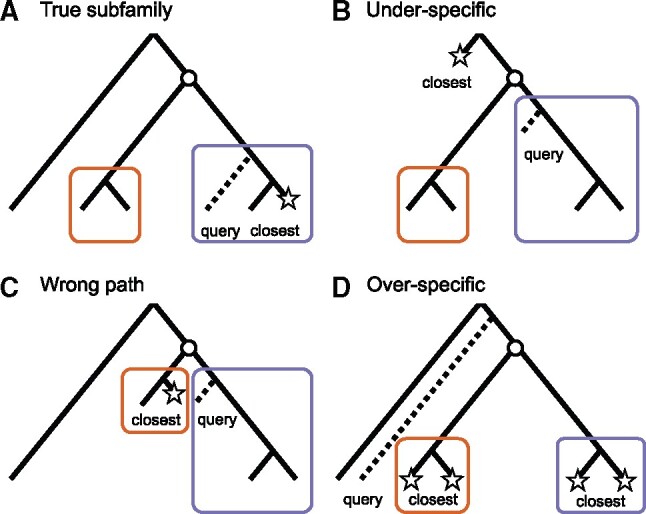
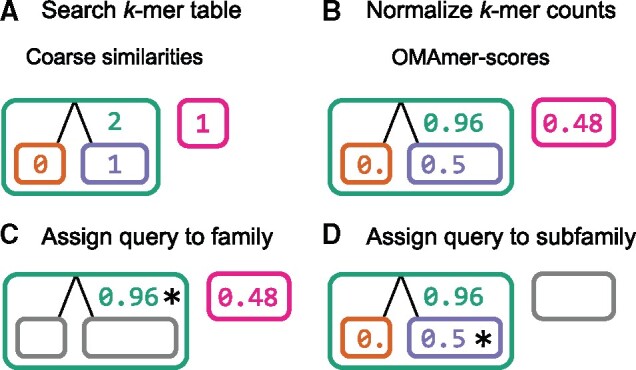
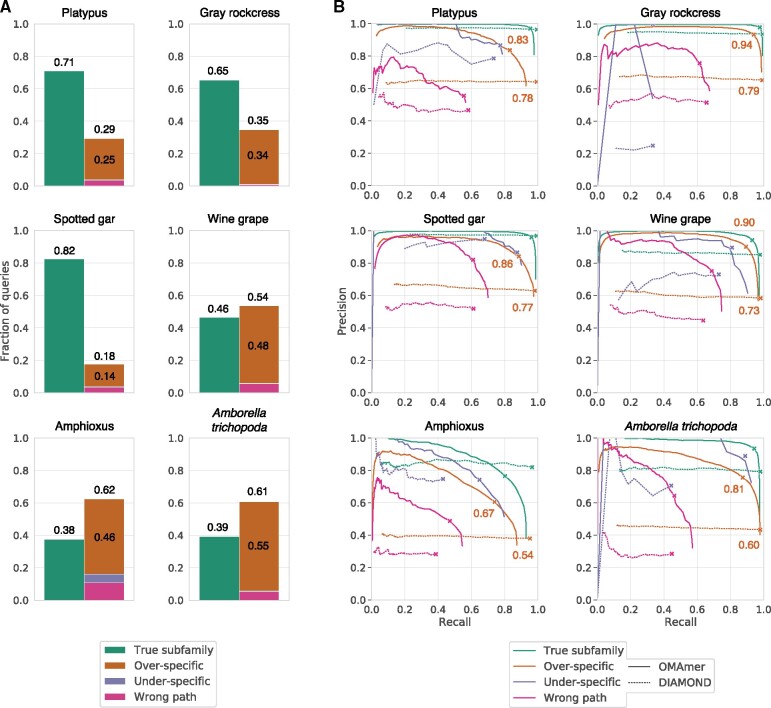
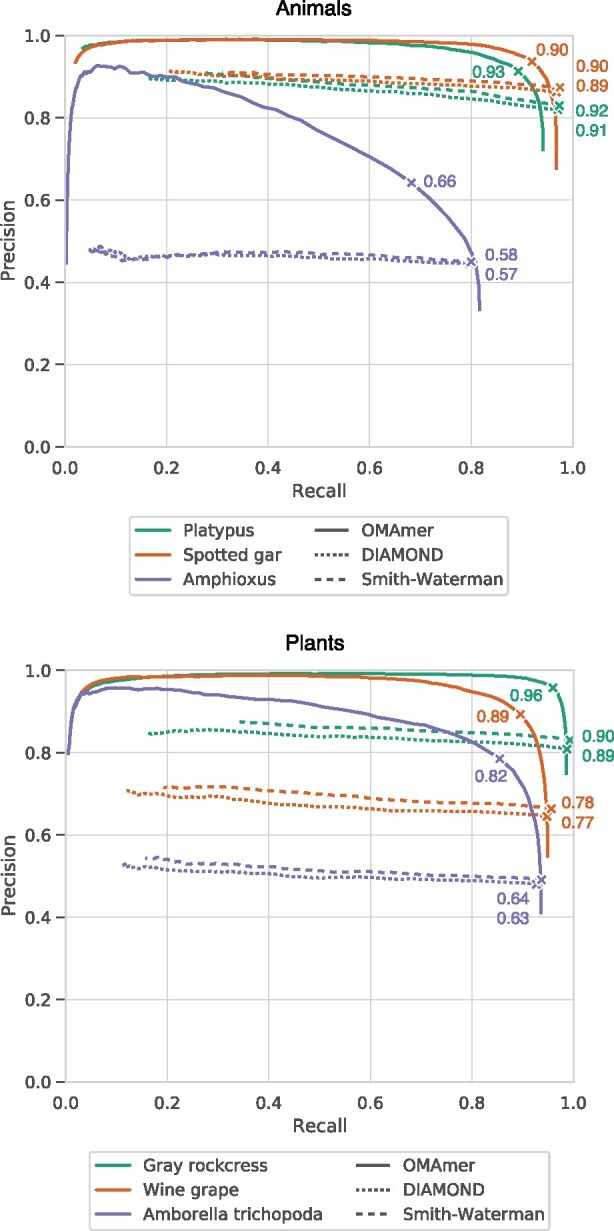
Motivation: Assigning new sequences to known protein families and subfamilies is a prerequisite for many functional, comparative and evolutionary genomics analyses. Such assignment is commonly achieved by looking for the closest sequence in a reference database, using a method such as BLAST. However, ignoring the gene phylogeny can be misleading because a query sequence does not necessarily belong to the same subfamily as its closest sequence. For example, a hemoglobin which branched out prior to the hemoglobin alpha/beta duplication could be closest to a hemoglobin alpha or beta sequence, whereas it is neither. To overcome this problem, phylogeny-driven tools have emerged but rely on gene trees, whose inference is computationally expensive. Results: Here, we first show that in multiple animal and plant datasets, 18–62% of assignments by closest sequence are misassigned, typically to an over-specific subfamily. Then, we introduce OMAmer, a novel alignment-free protein subfamily assignment method, which limits over-specific subfamily assignments and is suited to phylogenomic databases with thousands of genomes. OMAmer is based on an innovative method using evolutionarily informed k-mers for alignment-free mapping to ancestral protein subfamilies. Whilst able to reject non-homologous family-level assignments, we show that OMAmer provides better and quicker subfamily-level assignments than approaches relying on the closest sequence, whether inferred exactly by Smith-Waterman or by the fast heuristic DIAMOND. Availabilityand implementation: OMAmer is available from the Python Package Index (as omamer), with the source code and a precomputed database available at https://github.com/DessimozLab/omamer. Supplementary information: Supplementary data are available at Bioinformatics online.
Overview
The claims and statistics of this paper haven’t been checked yet.
Run the check — free, no account needed. It reads the open-access text and checks the sources it cites.
Integrity signals
Registry
Cites
Statistics
Figures
![Fig. 2. OMAmer algorithm for compact k-mer table precomputation. (A) To efficiently preprocess the k-mer table, a suffix array is first built from concatenated protein sequences of reference HOGs, encoding families (root-HOGs) and subfamilies (sub-HOGs). Numbers indicate suffix offsets in the concatenated protein array and bold characters highlight k-mers at the beginning of suffixes. (B) The k-mer ancestral HOG (where the k-mer has arisen) is approximated within each root-HOG as the LCA among HOGs with the given k-mer. For example, since both the orange and purple sub-HOGs contain the ‘AC’ k-mer, the ancestral HOG for that k-mer is the green root-HOG. (C) The compact k-mer table includes an k-mer index mapping to a buffer that stores each k-mer ancestral HOGs. Note that each offset of the index corresponds to a k-mer integer encoding. As illustrated with the gray boxes, the ‘AC’ k-mer (encoded as ‘1’) maps to the green and pink HOGs since these two lie within the [0,2[ offset interval in the buffer](/paper-figures/0905733355664320a8415ce24f6c517c/omamer-tree-driven-and-alignment-free-protein-assignment-to-subfamilies-figure-2.jpg)
Verification
Claims the paper makes
The claims and statistics of this paper haven’t been checked yet.
Run the check — free, no account needed. It reads the open-access text and checks the sources it cites.
Claims other papers make about this one
Each is checked against this paper’s own text: does it say what the citing paper says it does?
The cited source says what the claim attributes to it.
In the citing paper
“OMAmer provides accurate placement of protein sequences in their correct subfamily.”
From Quality assessment of gene repertoire annotations with OMArk (2025) · cites this paper as [11]
Self-check
Percentages, sums and reported differences re-computed from the paper’s own numbers.
The self-check needs the paper’s full text.
Citations
Cites
Turning a hobby into a job: How duplicated genes find new functions
Conant, G. C., & Wolfe, K. H. (2008) · Nature Reviews Genetics · doi:10.1038/nrg2482 · Cited by 1,281
Functional and evolutionary implications of gene orthology
Gabaldón, T., & Koonin, E. V. (2013) · Nature Reviews Genetics · doi:10.1038/nrg3456 · Cited by 643
Protein-level assembly increases protein sequence recovery from metagenomic samples manyfold
Steinegger, M., Mirdita, M., & Söding, J. (2019) · Nature Methods · doi:10.1038/s41592-019-0437-4 · Cited by 445
HaMStR: Profile hidden markov model based search for orthologs in ESTs
Ebersberger, I., Strauss, S., & von Haeseler, A. (2009) · BMC Evolutionary Biology · doi:10.1186/1471-2148-9-157 · Cited by 288
Research works printed but not linked: 37
- Altschul, 1990, Basic local alignment search tool, J. Mol. Biol, 215, 403, 10.1016/S0022-2836(05)80360-2 · DOI · Paper page
- Barbera, 2018, EPA-ng: massively parallel evolutionary placement of genetic sequences, Syst. Biol, 53, 1917
- Břinda, 2015, Spaced seeds improve k-mer-based metagenomic classification, Bioinformatics, 31, 3584, 10.1093/bioinformatics/btv419 · DOI
- Buchfink, 2015, Fast and sensitive protein alignment using DIAMOND, Nat. Methods, 12, 59, 10.1038/nmeth.3176 · DOI · Paper page
- Dalquen, 2013, The impact of gene duplication, insertion, deletion, lateral gene transfer and sequencing error on orthology inference: a simulation study, PLoS ONE, 8, e56925, 10.1371/journal.pone.0056925 · DOI
- Edgar, 2004, Local homology recognition and distance measures in linear time using compressed amino acid alphabets, Nucleic Acids Res, 32, 380, 10.1093/nar/gkh180 · DOI
- El-Gebali, 2019, The Pfam protein families database in 2019, Nucleic Acids Res, 47, D427, 10.1093/nar/gky995 · DOI · Paper page
- Fox, 2014, SCOPe: structural Classification of Proteins–extended, integrating SCOP and ASTRAL data and classification of new structures, Nucleic Acids Res, 42, D304, 10.1093/nar/gkt1240 · DOI · Paper page
- Gladyshev, 2008, Massive horizontal gene transfer in Bdelloid Rotifers, Science, 320, 1210, 10.1126/science.1156407 · DOI
- Glover, 2019, Advances and applications in the quest for orthologs, Mol. Biol. Evol, 36, 2157, 10.1093/molbev/msz150 · DOI · Paper page
- Huang, 2017, HaploMerger2: rebuilding both haploid sub-assemblies from high-heterozygosity diploid genome assembly, Bioinformatics, 33, 2577, 10.1093/bioinformatics/btx220 · DOI
- Huerta-Cepas, 2019, eggNOG 5.0: a hierarchical, functionally and phylogenetically annotated orthology resource based on 5090 organisms and 2502 viruses, Nucleic Acids Res, 47, D309, 10.1093/nar/gky1085 · DOI
- Huerta-Cepas, 2017, Fast Genome-Wide Functional Annotation through Orthology Assignment by eggNOG-Mapper, Mol. Biol. Evol, 34, 2115, 10.1093/molbev/msx148 · DOI · Paper page
- Huson, 2007, MEGAN analysis of metagenomic data, Genome Res, 17, 377, 10.1101/gr.5969107 · DOI
- 2013, The i5K Initiative: advancing arthropod genomics for knowledge, human health, agriculture, and the environment, J. Hered, 104, 595, 10.1093/jhered/est050 · DOI
- Kajitani, 2019, Platanus-allee is a de novo haplotype assembler enabling a comprehensive access to divergent heterozygous regions, Nat. Commun, 10, 1702, 10.1038/s41467-019-09575-2 · DOI
- Koepfli, 2015, The Genome 10K Project: a way forward, Annu. Rev. Anim. Biosci, 3, 57, 10.1146/annurev-animal-090414-014900 · DOI · Paper page
- Koski, 2001, The closest BLAST hit is often not the nearest neighbor, J. Mol. Evol, 52, 540, 10.1007/s002390010184 · DOI
- Kriventseva, 2019, OrthoDB v10: sampling the diversity of animal, plant, fungal, protist, bacterial and viral genomes for evolutionary and functional annotations of orthologs, Nucleic Acids Res, 47, D807, 10.1093/nar/gky1053 · DOI · Paper page
- Li, 2003, OrthoMCL: identification of ortholog groups for eukaryotic genomes, Genome Res, 13, 2178, 10.1101/gr.1224503 · DOI · Paper page
- Linard, 2019, Rapid alignment-free phylogenetic identification of metagenomic sequences, Bioinformatics, 35, 3303, 10.1093/bioinformatics/btz068 · DOI
- Manber, 1993, Suffix arrays: a new method for on-line string searches, SIAM J. Comput, 22, 935, 10.1137/0222058 · DOI
- Mi, 2019, PANTHER version 14: more genomes, a new PANTHER GO-slim and improvements in enrichment analysis tools, Nucleic Acids Res, 47, D419, 10.1093/nar/gky1038 · DOI
- Naseeb, 2017, Rapid functional and evolutionary changes follow gene duplication in yeast, Proc. Biol. Sci, 284, 20171393
- Nguyen, 2016, HIPPI: highly accurate protein family classification with ensembles of HMMs, BMC Genomics, 17, 765, 10.1186/s12864-016-3097-0 · DOI
- Opazo, 2008, Differential loss of embryonic globin genes during the radiation of placental mammals, Proc. Natl. Acad. Sci. USA, 105, 12950, 10.1073/pnas.0804392105 · DOI
- Peterson, 2016, The phylogeny, evolutionary developmental biology, and paleobiology of the Deuterostomia: 25 years of new techniques, new discoveries, and new ideas, Org. Divers. Evol, 16, 401, 10.1007/s13127-016-0270-x · DOI
- Putnam, 2008, The amphioxus genome and the evolution of the chordate karyotype, Nature, 453, 1064, 10.1038/nature06967 · DOI
- Schreiber, 2014, TreeFam v9: a new website, more species and orthology-on-the-fly, Nucleic Acids Res, 42, D922, 10.1093/nar/gkt1055 · DOI
- Sémon, 2007, Consequences of genome duplication, Curr. Opin. Genet. Dev, 17, 505, 10.1016/j.gde.2007.09.007 · DOI
- Smith, 1981, Identification of common molecular subsequences, J. Mol. Biol, 147, 195, 10.1016/0022-2836(81)90087-5 · DOI
- Sonnhammer, 2015, InParanoid 8: orthology analysis between 273 proteomes, mostly eukaryotic, Nucleic Acids Res., 43, D234, 10.1093/nar/gku1203 · DOI
- Tang, 2019, TreeGrafter: phylogenetic tree-based annotation of proteins with Gene Ontology terms and other annotations, Bioinformatics, 35, 518, 10.1093/bioinformatics/bty625 · DOI
- 2019, UniProt: a worldwide hub of protein knowledge, Nucleic Acids Res, 47, D506, 10.1093/nar/gky1049 · DOI · Paper page
- Wood, 2014, Kraken: ultrafast metagenomic sequence classification using exact alignments, Genome Biol, 15, R46, 10.1186/gb-2014-15-3-r46 · DOI · Paper page
- Zielezinski, 2017, Alignment-free sequence comparison: benefits, applications, and tools, Genome Biol, 18, 186, 10.1186/s13059-017-1319-7 · DOI
- Zielezinski, 2019, Benchmarking of alignment-free sequence comparison methods, Genome Biol, 20, 144, 10.1186/s13059-019-1755-7 · DOI
Cited by
Sorted by citations
Quality assessment of gene repertoire annotations with OMArk
Nevers, Y., Warwick Vesztrocy, A., Rossier, V., Train, C.-M., Altenhoff, A., Dessimoz, C., & Glover, N. M. (2025) · Nature Biotechnology · doi:10.1038/s41587-024-02147-w · Cited by 186
Self-citation
Metadata
- Authors
- Rossier, V., Warwick Vesztrocy, A., Robinson-Rechavi, M., & Dessimoz, C.
- Affiliations
- Department of Computational Biology, University of Lausanne , 1015 Lausanne, Switzerland
- SIB Swiss Institute of Bioinformatics , 1015 Lausanne, Switzerland
- Venue
- Bioinformatics
- Publisher
- Oxford University Press (OUP)
- Published
- 2021-03-31
- Volume
- 37
- Issue
- 18
- Pages
- 2866-2873
- ISSN
- 1367-4803
- 1367-4811
- PMC
- PMC8479680
- Cited by
- 25
- References
- 4
- Language
- en
- Funders
- Swiss National Foundation (167276, 183723)
About these checks
Registry, retraction, Cites and statistics results are computed, not judged, with one exception: a printed reference that no index lists is read once by a model before it counts as a citation error. Claims are extracted by a model and kept only when their quote appears verbatim in the text; each cited source is then checked, with a model’s help, for whether it says what the claim relies on. Those verdicts can be wrong — read the claim’s quote and the cited source before relying on one.
Statistics and arithmetic are recomputed, not judged.
Confidence bands are shown only for fields calibrated on our annotated test set. None is calibrated yet, so no band is shown.
What counts as a claim ›How we measure confidence ›How we check this ›
Are you an author, or do you see a problem with this page? Request a review
