

The DOI matches its Crossref record; 3 of the 3 references it cites were found in a registry or an index.
Unbiased pangenome graphs
Published version of a preprint
Abstract
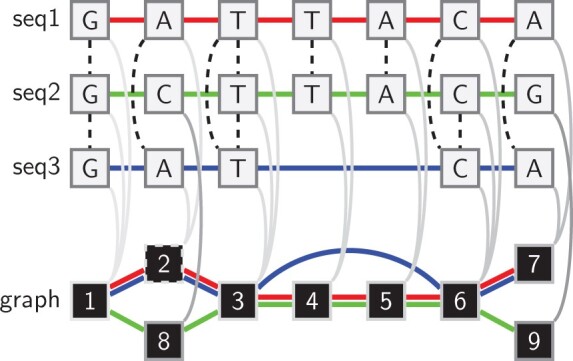
Motivation: Pangenome variation graphs model the mutual alignment of collections of DNA sequences. A set of pairwise alignments implies a variation graph, but there are no scalable methods to generate such a graph from these alignments. Existing related approaches depend on a single reference, a specific ordering of genomes or a de Bruijn model based on a fixed k-mer length. A scalable, self-contained method to build pangenome graphs without such limitations would be a key step in pangenome construction and manipulation pipelines. Results: We design the seqwish algorithm, which builds a variation graph from a set of sequences and alignments between them. We first transform the alignment set into an implicit interval tree. To build up the variation graph, we query this tree-based representation of the alignments to reduce transitive matches into single DNA segments in a sequence graph. By recording the mapping from input sequence to output graph, we can trace the original paths through this graph, yielding a pangenome variation graph. We present an implementation that operates in external memory, using disk-backed data structures and lock-free parallel methods to drive the core graph induction step. We demonstrate that our method scales to very large graph induction problems by applying it to build pangenome graphs for several species. Availability and implementation: seqwish is published as free software under the MIT open source license. Source code and documentation are available at https://github.com/ekg/seqwish. seqwish can be installed via Bioconda https://bioconda.github.io/recipes/seqwish/README.html or GNU Guix https://github.com/ekg/guix-genomics/blob/master/seqwish.scm.
Overview
The claims and statistics of this paper haven’t been checked yet.
Run the check — free, no account needed. It reads the open-access text and checks the sources it cites.
Integrity signals
Registry
Cites
Statistics
Figures
Verification
Claims the paper makes
The claims and statistics of this paper haven’t been checked yet.
Run the check — free, no account needed. It reads the open-access text and checks the sources it cites.
Claims other papers make about this one
Each is checked against this paper’s own text: does it say what the citing paper says it does?
In the citing paper
“Seqwish 46 is a recent tool that also induces sequence graphs from sets of pairwise alignments but, because it does not transitively process SNPs in this way, will not work on tree-based sets of pairwise alignments as represented by HAL.”
From Pangenome graph construction from genome alignments with Minigraph-Cactus (2024) · cites this paper as [46]
Self-check
Percentages, sums and reported differences re-computed from the paper’s own numbers.
The self-check needs the paper’s full text.
Citations
Cites
Progressive Cactus is a multiple-genome aligner for the thousand-genome era
Armstrong, J., Hickey, G., Diekhans, M., Fiddes, I. T., Novak, A. M., Deran, A., Fang, Q., Xie, D., Feng, S., Stiller, J., et al. (2020) · Nature · doi:10.1038/s41586-020-2871-y · Cited by 586 · cited 2×
“In contrast to existing methods, which depend on particular structuring of their input (Li et al., 2020; Armstrong et al., 2020), seqwish is unbiased in that as it directly and uniformly represents sequence relationships given on input in the resulting graph.”
MethodThe design and construction of reference pangenome graphs with minigraph
Li, H., Feng, X., & Chu, C. (2020) · Genome Biology · doi:10.1186/s13059-020-02168-z · Cited by 455
Eizenga, J. M., Novak, A. M., Sibbesen, J. A., Heumos, S., Ghaffaari, A., Hickey, G., Chang, X., Seaman, J. D., Rounthwaite, R., Ebler, J., et al. (2020) · Annual Review of Genomics and Human Genetics · doi:10.1146/annurev-genom-120219-080406 · Cited by 320
Self-citation
Research works printed but not linked: 23
- Axtmann, 2017, 9:1
- Eizenga, 2021, Connecting with Computability, 169, 10.1007/978-3-030-80049-9_15 · DOI
- Garrison, 2018, Variation graph toolkit improves read mapping by representing genetic variation in the reference, Nat. Biotechnol, 36, 875, 10.1038/nbt.4227 · DOI · Paper page
- Gog, 2014, From theory to practice: plug and play with succinct data structures, Experimental Algorithms, 326, 10.1007/978-3-319-07959-2_28 · DOI
- Guarracino, 2022, ODGI: understanding pangenome graphs, Bioinformatics, 38, 3319, 10.1093/bioinformatics/btac308 · DOI
- Hein, 1989, A new method that simultaneously aligns and reconstructs ancestral sequences for any number of homologous sequences, when the phylogeny is given, Mol. Biol. Evol, 6, 649
- Hickey, 2020, Genotyping structural variants in pangenome graphs using the vg toolkit, Genome Biol, 21, 35, 10.1186/s13059-020-1941-7 · DOI · Paper page
- Jain, 2018, A fast adaptive algorithm for computing whole-genome homology maps, Bioinformatics, 34, i748, 10.1093/bioinformatics/bty597 · DOI
- Janson, 1993, The birth of the giant component, Random Struct. Algor, 4, 233, 10.1002/rsa.3240040303 · DOI
- Lee, 2002, Multiple sequence alignment using partial order graphs, Bioinformatics, 18, 452, 10.1093/bioinformatics/18.3.452 · DOI
- Li, 2018, Minimap2: pairwise alignment for nucleotide sequences, Bioinformatics, 34, 3094, 10.1093/bioinformatics/bty191 · DOI · Paper page
- Li, 2021, Bedtk: finding interval overlap with implicit interval tree, Bioinformatics, 37, 1315, 10.1093/bioinformatics/btaa827 · DOI
- Marco-Sola, 2021, Fast gap-affine pairwise alignment using the wavefront algorithm, Bioinformatics, 37, 456, 10.1093/bioinformatics/btaa777 · DOI
- Medini, 2005, The microbial pan-genome, Curr. Opin. Genet. Dev, 15, 589, 10.1016/j.gde.2005.09.006 · DOI
- Minkin, 2016, Twopaco: an efficient algorithm to build the compacted de Bruijn graph from many complete genomes, Bioinformatics, btw609, 10.1093/bioinformatics/btw609 · DOI
- Mose, 2019, Improved indel detection in DNA and RNA via realignment with abra2, Bioinformatics, 35, 2966, 10.1093/bioinformatics/btz033 · DOI
- Rhie, 2021, Towards complete and error-free genome assemblies of all vertebrate species, Nature, 592, 737, 10.1038/s41586-021-03451-0 · DOI · Paper page
- Sheikhizadeh, 2016, PanTools: representation, storage and exploration of pan-genomic data, Bioinformatics, 32, i487, 10.1093/bioinformatics/btw455 · DOI
- Sherman, 2020, Pan-genomics in the human genome era, Nat. Rev. Genet, 21, 243, 10.1038/s41576-020-0210-7 · DOI
- The Computational Pan-Genomics Consortium, 2018, Computational pan-genomics: status, promises and challenges, Brief Bioinformatics, 19, 118
- Yokoyama, 2019, MoMI-G: modular multi-scale integrated genome graph browser, BMC Bioinformatics, 20, 548, 10.1186/s12859-019-3145-2 · DOI
- Yu, 2021, Stliter: a novel algorithm to iteratively build the compacted de Bruijn graph from many complete genomes, IEEE/ACM Trans. Comput. Biol. Bioinform, 19, 2471, 10.1109/TCBB.2021.3062068 · DOI
- Yue, 2017, Contrasting evolutionary genome dynamics between domesticated and wild yeasts, Nat. Genet, 49, 913, 10.1038/ng.3847 · DOI
Cited by
Sorted by citations
A draft human pangenome reference.
Liao, W.-W., Asri, M., Ebler, J., Doerr, D., Haukness, M., Hickey, G., Lu, S., Lucas, J. K., Monlong, J., Abel, H. J., et al. (2023) · Nature · doi:10.1038/s41586-023-05896-x · Cited by 1,129
Self-citationPangenome graph construction from genome alignments with Minigraph-Cactus
Hickey, G., Monlong, J., Ebler, J., Novak, A. M., Eizenga, J. M., Gao, Y., Human Pangenome Reference Consortium, Abel, H. J., Antonacci-Fulton, L. L., Asri, M., et al. (2024) · Nature Biotechnology · doi:10.1038/s41587-023-01793-w · Cited by 343
Self-citationSemi-automated assembly of high-quality diploid human reference genomes
Jarvis, E. D., Formenti, G., Rhie, A., Guarracino, A., Yang, C., Wood, J., Tracey, A., Thibaud-Nissen, F., Vollger, M. R., Porubsky, D., et al. (2022) · Nature · doi:10.1038/s41586-022-05325-5 · Cited by 209
Self-citationRecombination between heterologous human acrocentric chromosomes
Guarracino, A., Buonaiuto, S., de Lima, L. G., Potapova, T., Rhie, A., Koren, S., Rubinstein, B., Fischer, C., Human Pangenome Reference Consortium, Abel, H. J., et al. (2023) · Nature · doi:10.1038/s41586-023-05976-y · Cited by 134
Self-citationPangenome Graph Construction from Genome Alignment with Minigraph-Cactus
Hickey, G., Monlong, J., Ebler, J., Novak, A., Eizenga, J. M., Gao, Y., Human Pangenome Reference Consortium, Marschall, T., Li, H., & Paten, B. (2022) · doi:10.1101/2022.10.06.511217 · Cited by 345
Metadata
- Authors
- Garrison, E., & Guarracino, A.
- Affiliations
- Department of Genetics, Genomics and Informatics, University of Tennessee Health Science Center , Memphis, TN 38163, USA
- Genomics Research Centre, Human Technopole , Viale Rita Levi-Montalcini 1 , Milan 20157, Italy
- Venue
- Bioinformatics
- Publisher
- Oxford University Press (OUP)
- Published
- 2022-11-30
- Volume
- 39
- Issue
- 1
- ISSN
- 1367-4811
- PMC
- PMC9805579
- Cited by
- 95
- References
- 3
- Language
- en
- Funders
- NIH
- NIDA (U01DA047638)
- NSF PPoSS (#2118709)
- Human Technopole in Milan
About these checks
Registry, retraction, Cites and statistics results are computed, not judged, with one exception: a printed reference that no index lists is read once by a model before it counts as a citation error. Claims are extracted by a model and kept only when their quote appears verbatim in the text; each cited source is then checked, with a model’s help, for whether it says what the claim relies on. Those verdicts can be wrong — read the claim’s quote and the cited source before relying on one.
Statistics and arithmetic are recomputed, not judged.
Confidence bands are shown only for fields calibrated on our annotated test set. None is calibrated yet, so no band is shown.
What counts as a claim ›How we measure confidence ›How we check this ›
Are you an author, or do you see a problem with this page? Request a review
