

The DOI matches its Crossref record; 3 of the 3 references it cites were found in a registry or an index.
An interpretable alphabet for local protein structure search based on amino acid neighborhoods
Open accessPublished version of a preprint
Abstract
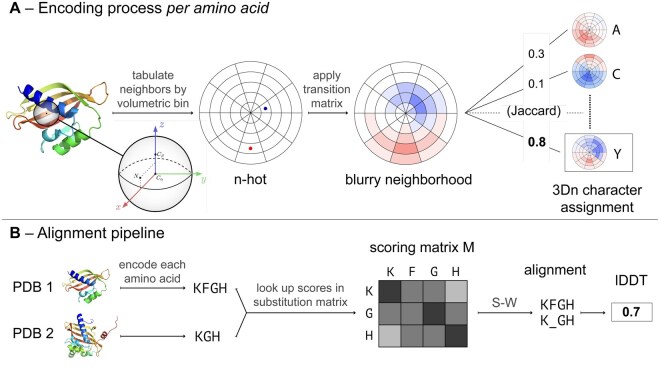
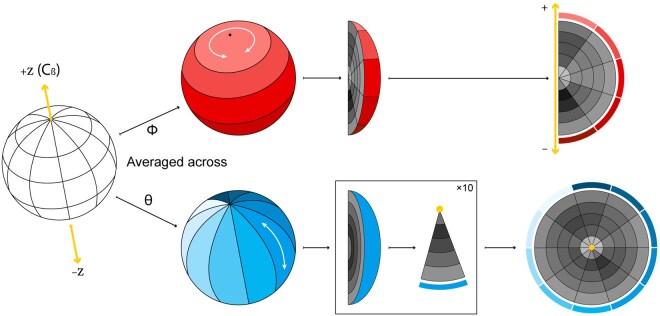
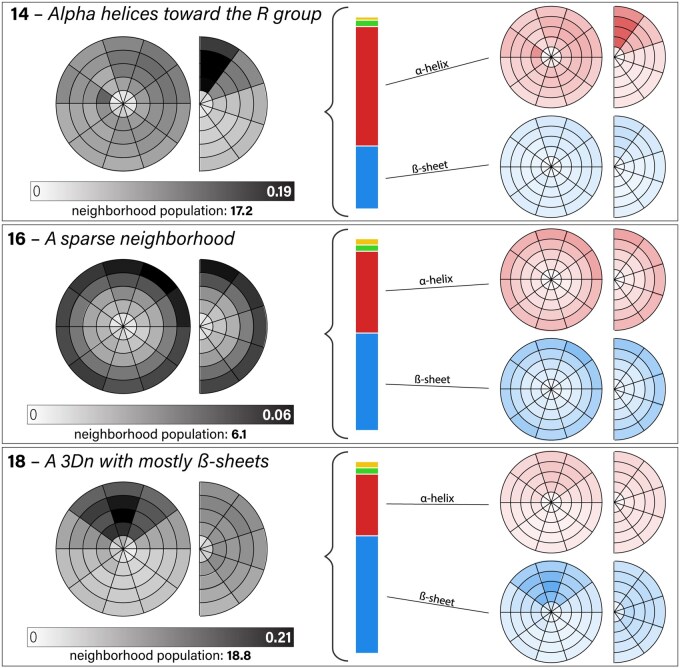
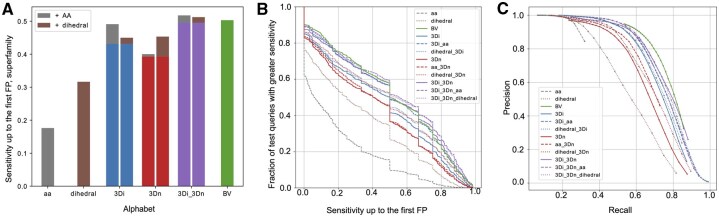
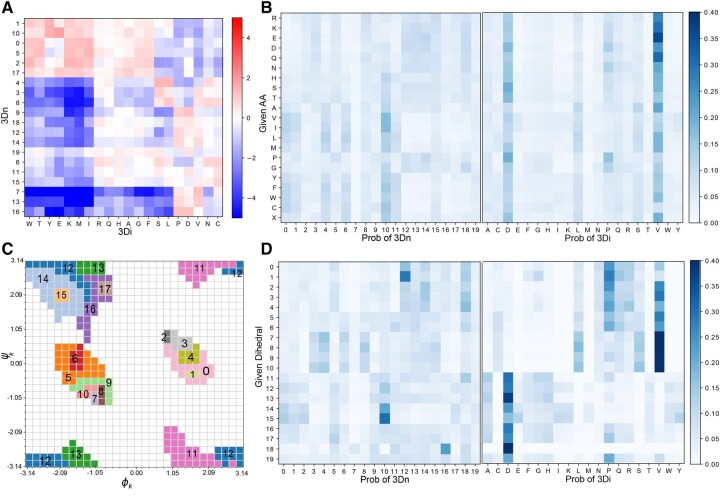
Motivation: Recent advancements in protein structure prediction methods have vastly increased the size of databases of protein structures, necessitating fast methods for protein structure comparison. Search methods that find structurally similar proteins can be applied to find remote homologs, study the functional relationships among proteins, and aid in protein engineering tasks. Results: We design a “3Dn” structural alphabet that encodes the local neighborhoods around each amino acid in an interpretable way. In a search benchmark task, a combination of our alphabet and Foldseek’s 3Di alphabet, outperforms each alphabet individually and ranks best among local search methods that do not require amino acid identity information. We provide software tools that enable the exploration of novel alphabets and combinations of alphabets for protein structure search. Availability and implementation: The code is freely available at https://github.com/spetti/structure_comparison and at Zenodo https://doi.org/10.5281/zenodo.15734371.
Overview
The claims and statistics of this paper haven’t been checked yet.
Run the check — free, no account needed. It reads the open-access text and checks the sources it cites.
Integrity signals
Registry
Cites
Statistics
Figures
Verification
Claims the paper makes
The claims and statistics of this paper haven’t been checked yet.
Run the check — free, no account needed. It reads the open-access text and checks the sources it cites.
Self-check
Percentages, sums and reported differences re-computed from the paper’s own numbers.
The self-check needs the paper’s full text.
Citations
Cites
Highly accurate protein structure prediction with AlphaFold
Jumper, J., Evans, R., Pritzel, A., Green, T., Figurnov, M., Ronneberger, O., Tunyasuvunakool, K., Bates, R., Žídek, A., Potapenko, A., et al. (2021) · Nature · doi:10.1038/s41586-021-03819-2 · Cited by 43,764
Robust deep learning–based protein sequence design using ProteinMPNN
Dauparas, J., Anishchenko, I., Bennett, N., Bai, H., Ragotte, R. J., Milles, L. F., Wicky, B. I. M., Courbet, A., de Haas, R. J., Bethel, N., et al. (2022) · Science · doi:10.1126/science.add2187 · Cited by 2,210
Mariani, V., Biasini, M., Barbato, A., & Schwede, T. (2013) · Bioinformatics · doi:10.1093/bioinformatics/btt473 · Cited by 1,138
Research works printed but not linked: 28
- Altschul, 1990, Basic local alignment search tool, J Mol Biol, 215, 403, 10.1016/S0022-2836(05)80360-2 · DOI · Paper page
- Blondel, 2008, Fast unfolding of communities in large networks, J Stat Mech, 2008, P10008, 10.1088/1742-5468/2008/10/P10008 · DOI · Paper page
- Bystroff, 1998, Prediction of local structure in proteins using a library of sequence-structure motifs, J Mol Biol, 281, 565, 10.1006/jmbi.1998.1943 · DOI
- Camproux, 2004, A hidden Markov model derived structural alphabet for proteins, J Mol Biol, 339, 591, 10.1016/j.jmb.2004.04.005 · DOI
- Chandonia, 2019, SCOPe: classification of large macromolecular structures in the structural classification of proteins—extended database, Nucleic Acids Res, 47, D475, 10.1093/nar/gky1134 · DOI
- de Brevern, 2000, Bayesian probabilistic approach for predicting backbone structures in terms of protein blocks, Proteins, 41, 271, 10.1002/1097-0134(20001115)41:3<271::AID-PROT10>3.0.CO;2-Z · DOI
- Finn, 2011, HMMER web server: interactive sequence similarity searching, Nucleic Acids Res, 39, W29, 10.1093/nar/gkr367 · DOI · Paper page
- Hauser, 2016, MMseqs software suite for fast and deep clustering and searching of large protein sequence sets, Bioinformatics, 32, 1323, 10.1093/bioinformatics/btw006 · DOI
- Heinzinger, 2024, Bilingual language model for protein sequence and structure, NAR Genom Bioinform, 6, lqae150, 10.1093/nargab/lqae150 · DOI · Paper page
- Henikoff, 1992, Amino acid substitution matrices from protein blocks, Proc Natl Acad Sci USA, 89, 10915, 10.1073/pnas.89.22.10915 · DOI · Paper page
- Holm, 2020, DALI and the persistence of protein shape, Protein Sci, 29, 128, 10.1002/pro.3749 · DOI
- Hong, 2025, Fast, sensitive detection of protein homologs using deep dense retrieval, Nat Biotechnol, 43, 983, 10.1038/s41587-024-02353-6 · DOI
- Johnson, 2024, Sensitive remote homology search by local alignment of small positional embeddings from protein language models, Elife, 12, RP91415, 10.7554/eLife.91415 · DOI · Paper page
- Le, 2009, Structural alphabets for protein structure classification: a comparison study, J Mol Biol, 387, 431, 10.1016/j.jmb.2008.12.044 · DOI
- Liu, 2024, PLMSearch: protein language model powers accurate and fast sequence search for remote homology, Nat Commun, 15, 2775, 10.1038/s41467-024-46808-5 · DOI · Paper page
- Lu, 2025, Patterns, 6, 101286, 10.1016/j.patter.2025.101289 · DOI
- Ma, 2014, Algorithms, applications, and challenges of protein structure alignment, Adv Protein Chem Struct Biol, 94, 121, 10.1016/B978-0-12-800168-4.00005-6 · DOI
- Miao, 2008, Tali: local alignment of protein structures using backbone torsion angles, J Bioinform Comput Biol, 6, 163, 10.1142/S0219720008003370 · DOI
- Petti, 2023, End-to-end learning of multiple sequence alignments with differentiable Smith–Waterman, Bioinformatics, 39, btac724, 10.1093/bioinformatics/btac724 · DOI · Paper page
- Procházka, 2024, Nucleic Acids Res
- Reichardt, 2006, Statistical mechanics of community detection, Phys Rev E Stat Nonlin Soft Matter Phys, 74, 016110, 10.1103/PhysRevE.74.016110 · DOI · Paper page
- Rooman, 1990, Automatic definition of recurrent local structure motifs in proteins, J Mol Biol, 213, 327, 10.1016/S0022-2836(05)80194-9 · DOI
- Smith, 1981, Identification of common molecular subsequences, J Mol Biol, 147, 195, 10.1016/0022-2836(81)90087-5 · DOI
- Tung, 2007, Kappa-alpha plot derived structural alphabet and blosum-like substitution matrix for rapid search of protein structure database, Genome Biol, 8, R31, 10.1186/gb-2007-8-3-r31 · DOI
- UniProt Consortium, 2015, UniProt: a hub for protein information, Nucleic Acids Res, 43, D204, 10.1093/nar/gku989 · DOI · Paper page
- Van Kempen, 2024, Fast and accurate protein structure search with Foldseek, Nat Biotechnol, 42, 243, 10.1038/s41587-023-01773-0 · DOI · Paper page
- Zhang, 2004, Scoring function for automated assessment of protein structure template quality, Proteins Struct Funct Bioinf, 57, 702, 10.1002/prot.20264 · DOI · Paper page
- Zhang, 2005, TM-align: a protein structure alignment algorithm based on the TM-score, Nucleic Acids Res, 33, 2302, 10.1093/nar/gki524 · DOI · Paper page
Metadata
- Authors
- Zerefa, S., Cool, J., Singh, P., & Petti, S.
- Affiliations
- Harvard University (US)
- Tufts University (US)
- Corresponding author
- Petti, Samantha
- Venue
- Bioinformatics
- Publisher
- Oxford University Press (OUP)
- Published
- 2025-08-23
- Volume
- 41
- Issue
- 10
- ISSN
- 1367-4803 (ISSN-L)
- 1367-4811
- PMC
- PMC12516309
- OpenAlex
- W4413491758
- Cited by
- 2
- References
- 3
- Citations by year
- 2026: 2
- FWCI
- 0.60
- Type
- journal article
- Language
- en
- Open access
- gold
- doi.org
- Licence
- Locations
- Bioinformatics (publishedVersion, cc-by)
- bioRxiv (Cold Spring Harbor Laboratory) (acceptedVersion, cc-by-nc-nd)
- Europe PMC (PubMed Central) (publishedVersion, cc-by)
- PubMed (publishedVersion)
- Funders
- NSF-Simons Center for Mathematical and Statistical Analysis of Biology at Harvard (#1764269)
- Burroughs-Wellcome Careers at the Scientific Interface
- Topics
- Life Sciences › Biochemistry, Genetics and Molecular Biology › Molecular Biology › Protein Structure and Dynamics
- Life Sciences › Biochemistry, Genetics and Molecular Biology › Structural Biology › Enzyme Structure and Function
- Life Sciences › Biochemistry, Genetics and Molecular Biology › Molecular Biology › Machine Learning in Bioinformatics
- Keywords
- protein structure search, structural alphabet, remote homology detection, interpretable representations, protein structure database
- MeSH terms
- Algorithms, Amino Acids, Protein Conformation, Proteins, Software, Computational Biology, Sequence Analysis, Protein, Databases, Protein
About these checks
Registry, retraction, Cites and statistics results are computed, not judged, with one exception: a printed reference that no index lists is read once by a model before it counts as a citation error. Claims are extracted by a model and kept only when their quote appears verbatim in the text; each cited source is then checked, with a model’s help, for whether it says what the claim relies on. Those verdicts can be wrong — read the claim’s quote and the cited source before relying on one.
Statistics and arithmetic are recomputed, not judged.
Confidence bands are shown only for fields calibrated on our annotated test set. None is calibrated yet, so no band is shown.
What counts as a claim ›How we measure confidence ›How we check this ›
Are you an author, or do you see a problem with this page? Request a review
How to cite
Cite CoChat for the checks on this page, and the paper for its own findings.
- This page
- CoChat. (2026). Citation check: An interpretable alphabet for local protein structure search based on amino acid neighborhoods. https://app.cochat.ai/papers/10.1093/bioinformatics/btaf458
- The paper
- Zerefa, S., Cool, J., Singh, P., & Petti, S. (2025). An interpretable alphabet for local protein structure search based on amino acid neighborhoods. Bioinformatics. https://doi.org/10.1093/bioinformatics/btaf458
