

A Bayesian approach to targeted experiment design
Open accessThe DOI matches its Crossref record; 27 of the 27 references it cites were found in a registry or an index; 1 of the 13 sources its claims cite were checked for support.
Abstract
Motivation: Systems biology employs mathematical modelling to further our understanding of biochemical pathways. Since the amount of experimental data on which the models are parameterized is often limited, these models exhibit large uncertainty in both parameters and predictions. Statistical methods can be used to select experiments that will reduce such uncertainty in an optimal manner. However, existing methods for optimal experiment design (OED) rely on assumptions that are inappropriate when data are scarce considering model complexity. Results: We have developed a novel method to perform OED for models that cope with large parameter uncertainty. We employ a Bayesian approach involving importance sampling of the posterior predictive distribution to predict the efficacy of a new measurement at reducing the uncertainty of a selected prediction. We demonstrate the method by applying it to a case where we show that specific combinations of experiments result in more precise predictions. Availability and implementation: Source code is available at: http://bmi.bmt.tue.nl/sysbio/software/pua.html Contact: j.vanlier@tue.nl; N.A.W.v.Riel@tue.nl Supplementary information: Supplementary data are available at Bioinformatics online.
Overview
CoChat Summary
TL;DR
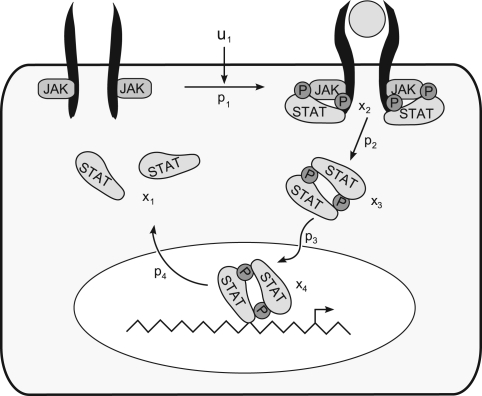
The paper proposes a Bayesian, sampling-based method for optimal experiment design that targets reduction of uncertainty in a prediction of interest under large parameter uncertainty. It uses posterior predictive distributions and importance sampling to estimate expected variance reduction, demonstrated on a JAK-STAT signalling model.
Key findings
- The method predicts the efficacy of new measurements by computing expected variance reduction (EVR) from the posterior predictive distribution, without requiring linearization around a best-fit parameter set.
- In the JAK-STAT case study, the largest reduction in variance for the time-to-peak of dimerized nuclear STAT (state 4) was obtained by measuring state 1 at an early and a late time point; measuring state 3 and state 1 gave smaller reductions but required less stringent timing accuracy.
- Additional measurements on the two observables already used to parameterize the original posterior (outputs 5 and 6) provided very little additional variance reduction.
- The linear variance reduction (LVR) approximation agreed qualitatively with the importance-sampling SVR and was about 100-fold faster for T=1000 samples.
Methods
- Bayesian workflow: compute posterior parameter distribution via Metropolis–Hastings MCMC, simulate posterior predictive distributions for candidate experiments, and estimate expected variance reduction by self-normalized importance sampling; a Gaussian LVR approximation is also derived.
- Applied to a JAK-STAT pathway model using data from Swameye et al. (dataset 1), with measured total STAT and cytoplasmic phosphorylated STAT, uniform log-space priors for kinetic parameters, a Gaussian initial condition (μ=200 nM, σ=20 nM), and a bounded non-identifiable parameter two.
- Two MCMC chains were run up to one million parameter sets and thinned to 10,000 samples; experiment space was sampled by Monte Carlo, and SVR computation was parallelized on a GPU using OpenCL.
Limitations
- The paper states that measurement timing is assumed instantaneous/infinitely accurate, and incorporating temporal inaccuracies remains an open challenge; it also notes that design is based on the expected value of a distribution of variance reductions, leaving the trade-off between EVR and its inaccuracy open.
- The paper states that parameters must be identifiable or restricted by finite priors, MCMC convergence is hard to assess, prior dependence should be verified a posteriori, strongly tailed distributions can make variance estimates unreliable, and low effective sample size can make importance-sampling estimates poor.
- The paper states that obtaining PPDs and performing experiment design is computationally expensive, and densely sampling experiment space can become prohibitively time consuming for many experiments; the text does not report prospective wet-lab validation of the proposed designs (evident from the text).
Model-written summary. Check it against the paper before relying on it.
Integrity signals
Registry
Cites
Statistics
Figures



Verification
Claims the paper makes
1 Valid · 0 Not valid · 5 Not checked · 40 Own results and interpretations
Every source the paper cites for this claim was checked and supports it.
In the paper
“Given the data, not all parameters are identifiable (Raue et al., 2009).”
§ A Bayesian approach to targeted experiment design > 4 RESULTS
What the sources say
- Supportedcites Raue et al., 2009 source
The Introduction (p. 1, sec. 1) states that 'Given a certain amount and quality of experimental data ... it is not assured that model parameters can be estimated unambiguously. Frequently, experimental data are insufficient considering the size of the model which results in parameters that are non-identifiable.' The Discussion (sec. 6) confirms this for the applied case: 'Non-identifiable parameters were detected, revealing limitations in the experimental setup,' and Sections 2.3.1-2.3.2 define the structural and practical kinds of non-identifiability the claim alludes to. The paraphrase 'given the data, not all parameters are identifiable' matches the source's own statement at the same level of generality. (LLM, conf=0.90)
plain- Asserted: passes — The authors put it forward as true.
- Checkable: passes — It can be checked against evidence.
- Load-bearing: passes — The paper’s conclusions depend on it.
- Based: passes — The paper gives a reason why it holds.
- Supported
A result the paper states — it cites no source for it, so there is none to check. The quote shows it is in the paper.
In the paper
“Therefore, an additional measurement at t=0 would not yield appreciable variance reduction which is also reflected by the fact that the SVR starts at a value of zero.”
§ A Bayesian approach to targeted experiment design > 4 RESULTS
plain- Asserted: passes — The authors put it forward as true.
- Checkable: passes — It can be checked against evidence.
- Load-bearing: passes — The paper’s conclusions depend on it.
- Based: passes — The paper gives a reason why it holds.
A result the paper reports from its own data — it cites no other source for it, so there is none to check. The quote shows it is in the paper.
In the paper
“Additionally, we investigated how the bounds of the priors on the non-identifiable kinetic rates affected our experimental design by widening them. This revealed that the EVRs obtained when measuring state 2 or 3 in combination with state 1 were more robust (for more information see the Supplementary Materials).”
§ A Bayesian approach to targeted experiment design > 4 RESULTS
plainstates a cause- Asserted: passes — The authors put it forward as true.
- Checkable: passes — It can be checked against evidence.
- Load-bearing: unclear — It is unclear whether the paper’s conclusions depend on it.
- Based: passes — The paper gives a reason why it holds.
A result the paper reports from its own data — it cites no other source for it, so there is none to check. The quote shows it is in the paper.
In the paper
“Interestingly, performing the experimental design for two measurements revealed that the largest reduction in variance could be obtained by measuring state one at an early and late time point.”
§ A Bayesian approach to targeted experiment design > 4 RESULTS
plainstates a cause- Asserted: passes — The authors put it forward as true.
- Checkable: passes — It can be checked against evidence.
- Load-bearing: unclear — It is unclear whether the paper’s conclusions depend on it.
- Based: passes — The paper gives a reason why it holds.
A result the paper reports from its own data — it cites no other source for it, so there is none to check. The quote shows it is in the paper.
In the paper
“As shown in the figure, these different states are often non-linearly related at specific points in time.”
§ A Bayesian approach to targeted experiment design > 4 RESULTS
plainstates an association- Asserted: passes — The authors put it forward as true.
- Checkable: passes — It can be checked against evidence.
- Load-bearing: passes — The paper’s conclusions depend on it.
- Based: passes — The paper gives a reason why it holds.
25 more claims
Create a free account to see all 46 claims and to verify the 12 references still open.
- It may state two separate claims as one. 8
- Probably not a substantial claim. 10
Claims other papers make about this one
Each is checked against this paper’s own text: does it say what the citing paper says it does?
The cited source says what the claim attributes to it.
In the citing paper
“Since the posterior predictive distribution forms a link between the various predictions of interest, while being constrained by the available data and prior knowledge, the relations within this distribution can be highly informative and useful for both system analysis and optimal experiment design [87].”
From Parameter uncertainty in biochemical models described by ordinary differential equations (2013) · cites this paper as [87]
The cited source says what the claim attributes to it.
In the citing paper
“Techniques for this exist in both a frequentist [13,36,91] as well as a Bayesian setting [87,90].”
From Parameter uncertainty in biochemical models described by ordinary differential equations (2013) · cites this paper as [87]
In the citing paper
“Previous approaches had taken a more local approach [25], [29], [30], [47] that relied on initial parameter guesses and often data”
From Maximizing the information content of experiments in systems biology (2013) · cites this paper as [25]
Self-check
Percentages, sums and reported differences re-computed from the paper’s own numbers.
Each contradiction between two passages listed here was confirmed by an independent check.
Rated minor: it would not touch a result — a value no result rests on, a p-value that stays on the same side of the significance level, or a conflict that is clerical, resolved elsewhere in the paper, or outside its own findings.
In the paper
§ A Bayesian approach to targeted experiment design > 4 RESULTS
“These two observables correspond to outputs 5 and 6 in Figure 4”
§ A Bayesian approach to targeted experiment design > 4 RESULTS
“Numbers 1 to 3 correspond to the first three states whereas 4 and 5 correspond to the sums of states on which the original PPD was parametrized.”
Citations
Cites
COPASI—a COmplex PAthway SImulator
Hoops, S., Sahle, S., Gauges, R., Lee, C., Pahle, J., Simus, N., Singhal, M., Xu, L., Mendes, P., & Kummer, U. (2006) · Bioinformatics · doi:10.1093/bioinformatics/btl485 · Cited by 2,618
Markov Chain Monte Carlo Convergence Diagnostics: A Comparative Review
Cowles, M. K., & Carlin, B. P. (1996) · Journal of the American Statistical Association · doi:10.1080/01621459.1996.10476956 · Cited by 2,056
Practical markov chain monte carlo
Geyer, C. J. (1992) · Statistical Science · doi:10.1214/ss/1177011137 · Cited by 2,045
Toni, T., Welch, D., Strelkowa, N., Ipsen, A., & Stumpf, M. P. H. (2009) · Journal of The Royal Society Interface · doi:10.1098/rsif.2008.0172 · Cited by 1,498
Riemann manifold langevin and hamiltonian monte carlo methods
Girolami, M., & Calderhead, B. (2011) · Journal of the Royal Statistical Society Series B: Statistical Methodology · doi:10.1111/j.1467-9868.2010.00765.x · Cited by 1,473
Raue, A., Kreutz, C., Maiwald, T., Bachmann, J., Schilling, M., Klingmüller, U., & Timmer, J. (2009) · Bioinformatics · doi:10.1093/bioinformatics/btp358 · Cited by 1,442
Universally Sloppy Parameter Sensitivities in Systems Biology Models
Gutenkunst, R. N., Waterfall, J. J., Casey, F. P., Brown, K. S., Myers, C. R., & Sethna, J. P. (2007) · PLoS Computational Biology · doi:10.1371/journal.pcbi.0030189 · Cited by 1,261 · cited 1×
“We employ a Bayesian approach involving importance sampling of the posterior predictive distribution to predict the efficacy of a new measurement at reducing the uncertainty of a selected prediction.”
MethodSequential Monte Carlo Samplers
Del Moral, P., Doucet, A., & Jasra, A. (2006) · Journal of the Royal Statistical Society Series B: Statistical Methodology · doi:10.1111/j.1467-9868.2006.00553.x · Cited by 1,239
Statistical mechanical approaches to models with many poorly known parameters.
Brown, K. S., & Sethna, J. P. (2003) · Physical Review E · doi:10.1103/physreve.68.021904 · Cited by 398
Sampling from multimodal distributions using tempered transitions
Neal, R. M. (1996) · Statistics and Computing · doi:10.1007/bf00143556 · Cited by 343
Cited by
Liepe, J., Kirk, P., Filippi, S., Toni, T., Barnes, C. P., & Stumpf, M. P. H. (2014) · Nature Protocols · doi:10.1038/nprot.2014.025 · Cited by 217
“This analysis serves as a basis for the design of experiments that could help improve such predictions 65,66 .”
MethodMaximizing the information content of experiments in systems biology
Liepe, J., Filippi, S., Komorowski, M., & Stumpf, M. P. H. (2013) · PLoS Computational Biology · doi:10.1371/journal.pcbi.1002888 · Cited by 170
“Previous approaches had taken a more local approach [25,29,30,47] that relied on initial parameter guesses and often data; our approach also readily incorporates different stimulus patterns [48].”
MethodParameter uncertainty in biochemical models described by ordinary differential equations
Vanlier, J., Tiemann, C. A., Hilbers, P. A. J., & van Riel, N. A. W. (2013) · Mathematical Biosciences · doi:10.1016/j.mbs.2013.03.006 · Cited by 116
Self-citationWearable sweat sensing for prolonged, semicontinuous, and nonobtrusive health monitoring
Moonen, E. J. M., Haakma, J. R., Peri, E., Pelssers, E., Mischi, M., & den Toonder, J. M. J. (2020) · VIEW · doi:10.1002/viw.20200077 · Cited by 86
Optimal experiment selection for parameter estimation in biological differential equation models
Transtrum, M. K., & Qiu, P. (2012) · BMC Bioinformatics · doi:10.1186/1471-2105-13-181 · Cited by 34
Metadata
- Authors
- Vanlier, J., Tiemann, C. A., Hilbers, P. A. J., & van Riel, N. A. W.
- Affiliations
- Eindhoven University of Technology (NL)
- Corresponding author
- Vanlier, J.
- ORCID
- Hilbers, P. A. J.
- Venue
- Bioinformatics
- Publisher
- Oxford University Press (OUP)
- Published
- 2012-02-24
- Volume
- 28
- Issue
- 8
- Pages
- 1136-1142
- ISSN
- 1367-4803 (ISSN-L)
- 1367-4811
- PMC
- PMC3324513
- OpenAlex
- W2110690917
- Semantic Scholar
- ec3f0b7ef15e821667df8681da38162184cf5d04
- Cited by
- 98
- References
- 27
- Citations by year
- 2026: 4 · 2025: 6 · 2024: 5 · 2023: 3 · 2022: 4 · 2021: 6 · 2020: 10 · 2019: 7 · 2018: 9 · 2017: 10 · 2016: 9 · 2015: 5 · 2014: 12 · 2013: 5 · 2012: 3
- FWCI
- 10.58
- Type
- journal article
- Language
- en
- Open access
- hybrid
- doi.org
- Licence
- Locations
- Bioinformatics (publishedVersion, cc-by-nc)
- Europe PMC (PubMed Central) (publishedVersion, cc-by-nc)
- PubMed Central (publishedVersion, cc-by-nc)
- PubMed (publishedVersion)
- TU/e Research Portal (publishedVersion)
- TU/e Research Portal (submittedVersion)
- Topics
- Social Sciences › Decision Sciences › Management Science and Operations Research › Optimal Experimental Design Methods
- Life Sciences › Biochemistry, Genetics and Molecular Biology › Molecular Biology › Gene Regulatory Network Analysis
- Physical Sciences › Engineering › Control and Systems Engineering › Control Systems and Identification
- Keywords
- optimal experiment design, Bayesian optimization, parameter uncertainty, posterior predictive distribution, importance sampling, systems biology modeling, data scarcity, prediction precision
- MeSH terms
- Algorithms, Bayes Theorem, Monte Carlo Method, Programming Languages, Research Design, Signal Transduction, Uncertainty, Systems Biology, STAT Transcription Factors, Janus Kinases
About these checks
Registry, retraction, Cites and statistics results are computed, not judged, with one exception: a printed reference that no index lists is read once by a model before it counts as a citation error. Claims are extracted by a model and kept only when their quote appears verbatim in the text; each cited source is then checked, with a model’s help, for whether it says what the claim relies on. Those verdicts can be wrong — read the claim’s quote and the cited source before relying on one.
A language model drew the claims from the paper on 2026-10-05, under version 3 of the claim definition (model deepseek-v4.1-flash, prompt extract-v3).
A second model labelled each claim on 2026-10-05 (model jev-1.13-20260917, definition revision gold-guideline-v0.2).
Cited sources are checked with a language model’s help (qwen3.8-omni-flash).
Statistics and arithmetic are recomputed, not judged.
Confidence bands are shown only for fields calibrated on our annotated test set. None is calibrated yet, so no band is shown.
What counts as a claim ›How we measure confidence ›How we check this ›
Are you an author, or do you see a problem with this page? Request a review
How to cite
Cite CoChat for the checks on this page, and the paper for its own findings.
- This page
- CoChat. (2026). Citation check: A Bayesian approach to targeted experiment design. https://app.cochat.ai/papers/10.1093/bioinformatics/bts092
- The paper
- Vanlier, J., Tiemann, C. A., Hilbers, P. A. J., & van Riel, N. A. W. (2012). A Bayesian approach to targeted experiment design. Bioinformatics. https://doi.org/10.1093/bioinformatics/bts092
Data sources
Bibliographic data: Semantic Scholar, OpenAlex, Crossref.
Contains information from the Semantic Scholar Academic Graph Datasets, made available under the ODC Attribution License (ODC-BY 1.0).
Semantic Scholar’s data is described in: Kinney, R., et al. (2023). The Semantic Scholar Open Data Platform. arXiv:2301.10140.
