

High precision protein functional site detection using 3D convolutional neural networks
Open accessThe DOI matches its Crossref record; 53 of the 53 references it cites were found in a registry or an index.
Abstract
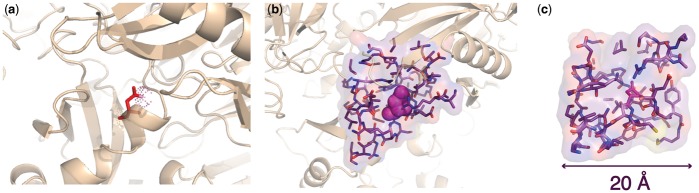
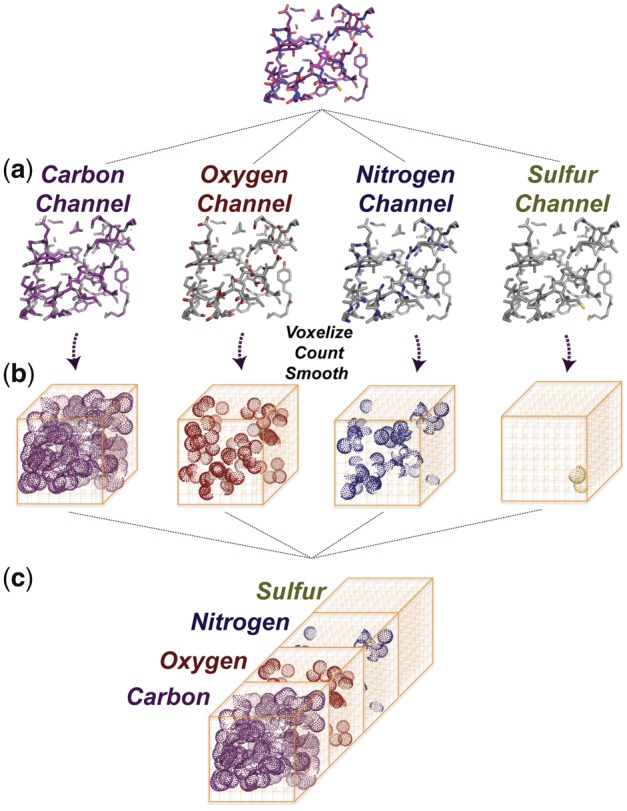
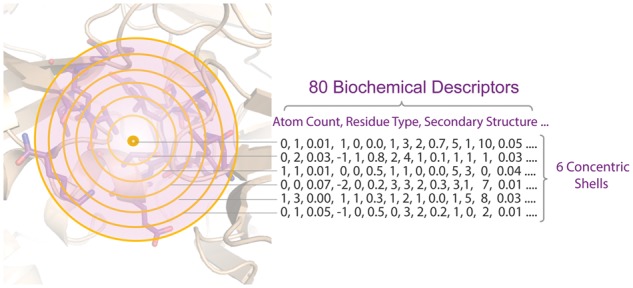
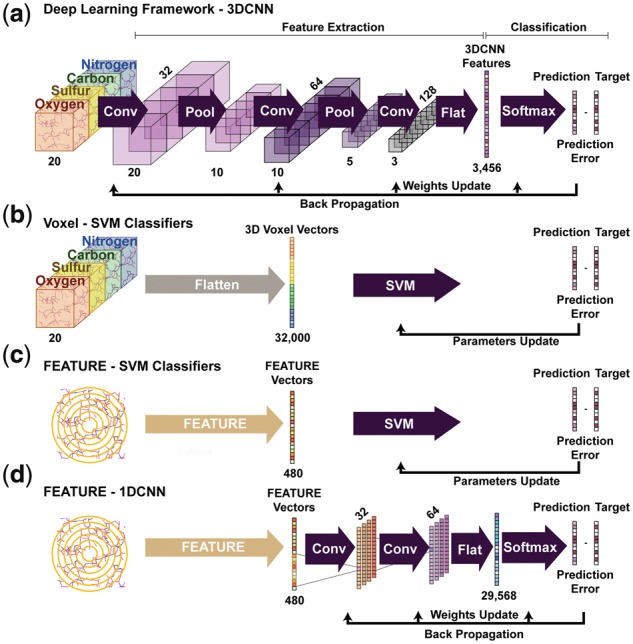
Motivation: Accurate annotation of protein functions is fundamental for understanding molecular and cellular physiology. Data-driven methods hold promise for systematically deriving rules underlying the relationship between protein structure and function. However, the choice of protein structural representation is critical. Pre-defined biochemical features emphasize certain aspects of protein properties while ignoring others, and therefore may fail to capture critical information in complex protein sites. Results: In this paper, we present a general framework that applies 3D convolutional neural networks (3DCNNs) to structure-based protein functional site detection. The framework can extract task-dependent features automatically from the raw atom distributions. We benchmarked our method against other methods and demonstrate better or comparable performance for site detection. Our deep 3DCNNs achieved an average recall of 0.955 at a precision threshold of 0.99 on PROSITE families, detected 98.89 and 92.88% of nitric oxide synthase and TRYPSIN-like enzyme sites in Catalytic Site Atlas, and showed good performance on challenging cases where sequence motifs are absent but a function is known to exist. Finally, we inspected the individual contributions of each atom to the classification decisions and show that our models successfully recapitulate known 3D features within protein functional sites. Availability and implementation: The 3DCNN models described in this paper are available at https://simtk.org/projects/fscnn. Supplementary information: Supplementary data are available at Bioinformatics online.
Overview
The claims and statistics of this paper haven’t been checked yet.
Free: it reads the open-access text and checks the first 5 claims that cite a source we can check. Create a free account to check every claim.
Integrity signals
Registry
Cites
Statistics
Figures
Verification
Claims the paper makes
The claims and statistics of this paper haven’t been checked yet.
Free: it reads the open-access text and checks the first 5 claims that cite a source we can check. Create a free account to check every claim.
Claims other papers make about this one
Each is checked against this paper’s own text: does it say what the citing paper says it does?
The cited source says what the claim attributes to it.
In the citing paper
“Such modeling paradigms have been used successfully in the biomolecular realm, for example, to predict three-dimensional (3D) molecular structures from sequences32–34 and interactions between different molecular components.35–38”
From How to build the virtual cell with artificial intelligence: Priorities and opportunities (2024) · cites this paper as [37]
Self-check
Percentages, sums and reported differences re-computed from the paper’s own numbers.
The self-check needs the paper’s full text.
Citations
Cites
LeCun, Y., Bengio, Y., & Hinton, G. (2015) · Nature · doi:10.1038/nature14539 · Cited by 84,126
Berman, H. M. (2000) · Nucleic Acids Research · doi:10.1093/nar/28.1.235 · Cited by 40,196
The use of ranks to avoid the assumption of normality implicit in the analysis of variance
Friedman, M. (1937) · Journal of the American Statistical Association · doi:10.1080/01621459.1937.10503522 · Cited by 7,005
UniProt: a hub for protein information
The UniProt Consortium (2015) · Nucleic Acids Research · doi:10.1093/nar/gku989 · Cited by 5,106
A Comparison of Alternative Tests of Significance for the Problem of $m$ Rankings
Friedman, M. (1940) · The Annals of Mathematical Statistics · doi:10.1214/aoms/1177731944 · Cited by 2,785 · cited 1×
“Specifically, we performed Friedman test (Friedman, 1937, 1940) followed by post-hoc two-tailed Nemenyi test (Nemenyi, 1963).”
MethodInterPro: the integrative protein signature database
Hunter, S., Apweiler, R., Attwood, T. K., Bairoch, A., Bateman, A., Binns, D., Bork, P., Das, U., Daugherty, L., Duquenne, L., et al. (2009) · Nucleic Acids Research · doi:10.1093/nar/gkn785 · Cited by 2,107
Molecular graph convolutions: moving beyond fingerprints
Kearnes, S., McCloskey, K., Berndl, M., Pande, V., & Riley, P. (2016) · Journal of Computer-Aided Molecular Design · doi:10.1007/s10822-016-9938-8 · Cited by 1,631
New and continuing developments at PROSITE
Sigrist, C. J. A., de Castro, E., Cerutti, L., Cuche, B. A., Hulo, N., Bridge, A., Bougueleret, L., & Xenarios, I. (2012) · Nucleic Acids Research · doi:10.1093/nar/gks1067 · Cited by 1,562
Statistical Comparisons of Classifiers over Multiple Data Sets
DemšarJanez (2006) · Journal of Machine Learning Research · doi:10.5555/1248547.1248548 · Cited by 1,074
Pagani, I., Liolios, K., Jansson, J., Chen, I.-M. A., Smirnova, T., Nosrat, B., Markowitz, V. M., & Kyrpides, N. C. (2012) · Nucleic Acids Research · doi:10.1093/nar/gkr1100 · Cited by 1,056
Cited by
Structure-based protein function prediction using graph convolutional networks
Gligorijević, V., Renfrew, P. D., Kosciolek, T., Leman, J. K., Berenberg, D., Vatanen, T., Chandler, C., Taylor, B. C., Fisk, I. M., Vlamakis, H., et al. (2021) · Nature Communications · doi:10.1038/s41467-021-23303-9 · Cited by 906
How to build the virtual cell with artificial intelligence: Priorities and opportunities
Bunne, C., Roohani, Y., Rosen, Y., Gupta, A., Zhang, X., Roed, M., Alexandrov, T., AlQuraishi, M., Brennan, P., Burkhardt, D. B., et al. (2024) · Cell · doi:10.1016/j.cell.2024.11.015 · Cited by 393
Graph Convolutional Neural Networks for Predicting Drug-Target Interactions
Torng, W., & Altman, R. B. (2019) · Journal of Chemical Information and Modeling · doi:10.1021/acs.jcim.9b00628 · Cited by 371
Self-citationAlQuraishi, M., & Sorger, P. K. (2021) · Nature Methods · doi:10.1038/s41592-021-01283-4 · Cited by 96
Metal3D: a general deep learning framework for accurate metal ion location prediction in proteins
Dürr, S. L., Levy, A., & Rothlisberger, U. (2023) · Nature Communications · doi:10.1038/s41467-023-37870-6 · Cited by 88
Metadata
- Authors
- Torng, W., & Altman, R. B.
- Affiliations
- Stanford University (US)
- Corresponding author
- Altman, Russ B
- Venue
- Bioinformatics
- Publisher
- Oxford University Press (OUP)
- Published
- 2018-09-20
- Volume
- 35
- Issue
- 9
- Pages
- 1503-1512
- ISSN
- 1367-4803 (ISSN-L)
- 1367-4811
- PMC
- PMC6499237
- OpenAlex
- W2891927397
- Cited by
- 69
- References
- 53
- Citations by year
- 2026: 4 · 2025: 6 · 2024: 16 · 2023: 13 · 2022: 8 · 2021: 16 · 2020: 3 · 2019: 3
- FWCI
- 1.96
- Type
- journal article
- Language
- en
- Open access
- hybrid
- doi.org
- Licence
- Locations
- Bioinformatics (publishedVersion, cc-by-nc)
- PubMed Central (publishedVersion, cc-by-nc)
- PubMed (publishedVersion)
- Funders
- National Institutes of Health (GM102365, LM05652, HL117798)
- Topics
- Life Sciences › Biochemistry, Genetics and Molecular Biology › Molecular Biology › Protein Structure and Dynamics
- Life Sciences › Biochemistry, Genetics and Molecular Biology › Molecular Biology › Machine Learning in Bioinformatics
- Life Sciences › Biochemistry, Genetics and Molecular Biology › Structural Biology › Enzyme Structure and Function
- Keywords
- 3D convolutional neural networks, nitric oxide synthase, trypsin-like enzymes, feature attribution, protein structure-function relationship
- MeSH terms
- Proteins, Neural Networks, Computer
About these checks
Registry, retraction, Cites and statistics results are computed, not judged, with one exception: a printed reference that no index lists is read once by a model before it counts as a citation error. Claims are extracted by a model and kept only when their quote appears verbatim in the text; each cited source is then checked, with a model’s help, for whether it says what the claim relies on. Those verdicts can be wrong — read the claim’s quote and the cited source before relying on one.
Statistics and arithmetic are recomputed, not judged.
Confidence bands are shown only for fields calibrated on our annotated test set. None is calibrated yet, so no band is shown.
What counts as a claim ›How we measure confidence ›How we check this ›
Are you an author, or do you see a problem with this page? Request a review
How to cite
Cite CoChat for the checks on this page, and the paper for its own findings.
- This page
- CoChat. (2026). Citation check: High precision protein functional site detection using 3D convolutional neural networks. https://app.cochat.ai/papers/10.1093/bioinformatics/bty813
- The paper
- Torng, W., & Altman, R. B. (2019). High precision protein functional site detection using 3D convolutional neural networks. Bioinformatics. https://doi.org/10.1093/bioinformatics/bty813
Data sources
Bibliographic data: Semantic Scholar, OpenAlex, Crossref.
Contains information from the Semantic Scholar Academic Graph Datasets, made available under the ODC Attribution License (ODC-BY 1.0).
Semantic Scholar’s data is described in: Kinney, R., et al. (2023). The Semantic Scholar Open Data Platform. arXiv:2301.10140.
