

The DOI matches its Crossref record; 48 of the 48 references it cites were found in a registry or an index.
Robust network inference using response logic
Open accessPublished version of a preprint
Abstract
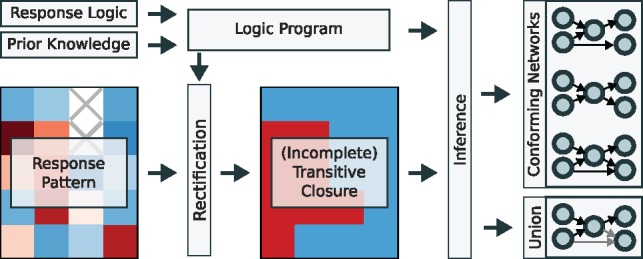
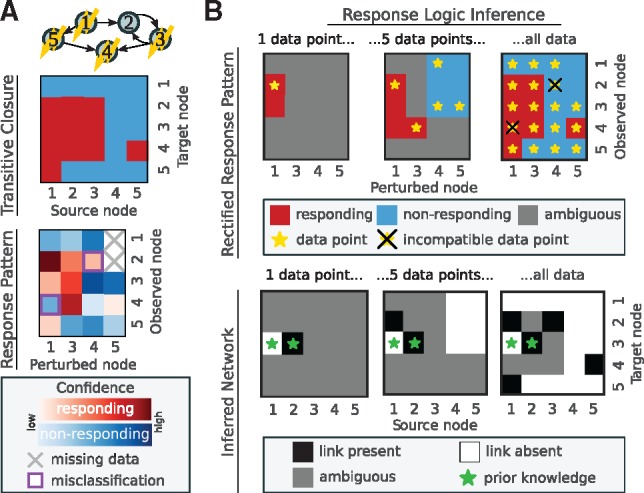
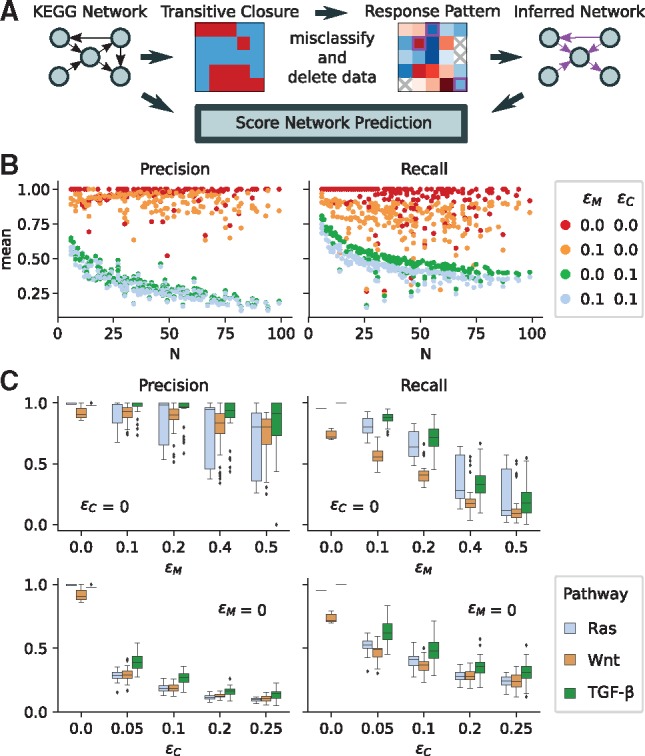
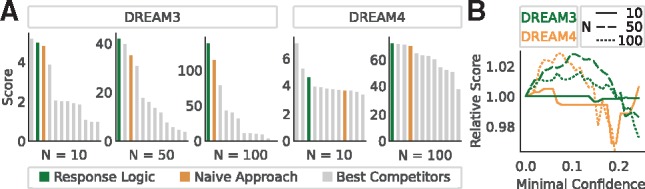
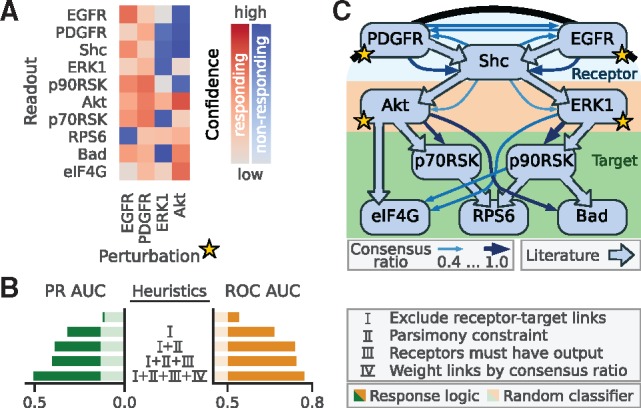
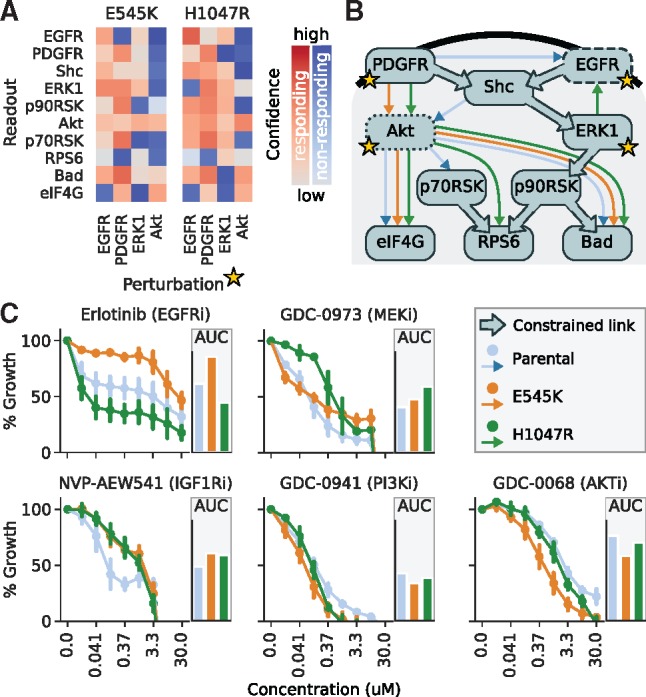
Motivation: A major challenge in molecular and cellular biology is to map out the regulatory networks of cells. As regulatory interactions can typically not be directly observed experimentally, various computational methods have been proposed to disentangling direct and indirect effects. Most of these rely on assumptions that are rarely met or cannot be adapted to a given context. Results: We present a network inference method that is based on a simple response logic with minimal presumptions. It requires that we can experimentally observe whether or not some of the system’s components respond to perturbations of some other components, and then identifies the directed networks that most accurately account for the observed propagation of the signal. To cope with the intractable number of possible networks, we developed a logic programming approach that can infer networks of hundreds of nodes, while being robust to noisy, heterogeneous or missing data. This allows to directly integrate prior network knowledge and additional constraints such as sparsity. We systematically benchmark our method on KEGG pathways, and show that it outperforms existing approaches in DREAM3 and DREAM4 challenges. Applied to a novel perturbation dataset on PI3K and MAPK pathways in isogenic models of a colon cancer cell line, it generates plausible network hypotheses that explain distinct sensitivities toward various targeted inhibitors due to different PI3K mutants. Availability and implementation: A Python/Answer Set Programming implementation can be accessed at github.com/GrossTor/response-logic. Data and analysis scripts are available at github.com/GrossTor/response-logic-projects. Supplementary information: Supplementary data are available at Bioinformatics online.
Overview
The claims and statistics of this paper haven’t been checked yet.
Free: it reads the open-access text and checks the first 5 claims that cite a source we can check. Create a free account to check every claim.
Integrity signals
Registry
Cites
Statistics
Figures
Verification
Claims the paper makes
The claims and statistics of this paper haven’t been checked yet.
Free: it reads the open-access text and checks the first 5 claims that cite a source we can check. Create a free account to check every claim.
Claims other papers make about this one
Each is checked against this paper’s own text: does it say what the citing paper says it does?
In the citing paper
“Directionality in regulatory network models cannot be inferred without interventional or time-series data10.”
From scPerturb: harmonized single-cell perturbation data (2024) · cites this paper as [10]
Self-check
Percentages, sums and reported differences re-computed from the paper’s own numbers.
The self-check needs the paper’s full text.
Citations
Cites
Investigating causal relations by econometric models and cross-spectral methods
Granger, C. W. J. (1969) · Econometrica · doi:10.2307/1912791 · Cited by 22,989
KEGG: new perspectives on genomes, pathways, diseases and drugs
Kanehisa, M., Furumichi, M., Tanabe, M., Sato, Y., & Morishima, K. (2017) · Nucleic Acids Research · doi:10.1093/nar/gkw1092 · Cited by 8,865
Exploring Network Structure, Dynamics, and Function Using NetworkX
Hagberg, A. A., Schult, D. A., & Swart, P. J. (2008) · Proceedings of the Python in Science Conference · doi:10.25080/tcwv9851 · Cited by 7,477 · cited 1×
“Additional functions were taken from the networkx package (Hagberg et al. , 2008).”
Detecting Causality in Complex Ecosystems
Sugihara, G., May, R., Ye, H., Hsieh, C.-H., Deyle, E., Fogarty, M., & Munch, S. (2012) · Science · doi:10.1126/science.1227079 · Cited by 2,539
Causal Protein-Signaling Networks Derived from Multiparameter Single-Cell Data
Sachs, K., Perez, O., Pe'er, D., Lauffenburger, D. A., & Nolan, G. P. (2005) · Science · doi:10.1126/science.1105809 · Cited by 1,708
Knowledge Representation, Reasoning and Declarative Problem Solving
Baral, C. (2003) · Cambridge University Press eBooks · doi:10.1017/cbo9780511543357 · Cited by 1,413
Reverse engineering of regulatory networks in human B cells
Basso, K., Margolin, A. A., Stolovitzky, G., Klein, U., Dalla-Favera, R., & Califano, A. (2005) · Nature Genetics · doi:10.1038/ng1532 · Cited by 1,404
Revealing strengths and weaknesses of methods for gene network inference
Marbach, D., Prill, R. J., Schaffter, T., Mattiussi, C., Floreano, D., & Stolovitzky, G. (2010) · Proceedings of the National Academy of Sciences · doi:10.1073/pnas.0913357107 · Cited by 752
The Transitive Reduction of a Directed Graph
Aho, A. V., Garey, M. R., & Ullman, J. D. (1972) · SIAM Journal on Computing · doi:10.1137/0201008 · Cited by 718
Negative feedback regulation of the ERK1/2 MAPK pathway
Lake, D., Corrêa, S. A. L., & Müller, J. (2016) · Cellular and Molecular Life Sciences · doi:10.1007/s00018-016-2297-8 · Cited by 565
Research works printed but not linked: 2
- Bockmayr, 2002, Logic Programming, Lecture Notes in Computer Science, 85
- Hagberg, 2008, Proceedings of the 7th Python in Science Conference, Pasadena, CA, 11
Cited by
scPerturb: harmonized single-cell perturbation data
Peidli, S., Green, T. D., Shen, C., Gross, T., Min, J., Garda, S., Yuan, B., Schumacher, L. J., Taylor-King, J. P., Marks, D. S., et al. (2024) · Nature Methods · doi:10.1038/s41592-023-02144-y · Cited by 194
Self-citationIdentifiability and experimental design in perturbation studies
Gross, T., & Blüthgen, N. (2020) · Bioinformatics · doi:10.1093/bioinformatics/btaa404 · Cited by 11
Self-citation
Metadata
- Authors
- Gross, T., Wongchenko, M. J., Yan, Y., & Blüthgen, N.
- Affiliations
- Humboldt-Universität zu Berlin (DE)
- Genentech (US)
- Corresponding author
- Blüthgen, Nils
- Venue
- Bioinformatics
- Publisher
- Oxford University Press (OUP)
- Published
- 2019-07
- Volume
- 35
- Issue
- 14
- Pages
- i634-i642
- ISSN
- 1367-4803 (ISSN-L)
- 1367-4811
- PMC
- PMC6612863
- OpenAlex
- W2953607540
- Cited by
- 7
- References
- 48
- Citations by year
- 2024: 2 · 2022: 1 · 2021: 3 · 2020: 1
- FWCI
- 0.41
- Type
- journal article
- Language
- en
- Open access
- hybrid
- doi.org
- Licence
- Locations
- Bioinformatics (publishedVersion, cc-by-nc)
- bioRxiv (Cold Spring Harbor Laboratory) (acceptedVersion, cc-by-nc-nd)
- Europe PMC (PubMed Central) (publishedVersion, cc-by-nc)
- PubMed Central (publishedVersion, cc-by-nc)
- PubMed (publishedVersion)
- edoc Publication server (Humboldt University of Berlin) (submittedVersion, cc-by-nc)
- edoc Publication server (Humboldt University of Berlin)
- Funders
- Berlin Institute of Health
- German Research Foundation (GRK1772, RTG2424)
- Topics
- Life Sciences › Biochemistry, Genetics and Molecular Biology › Molecular Biology › Gene Regulatory Network Analysis
- Life Sciences › Biochemistry, Genetics and Molecular Biology › Molecular Biology › Bioinformatics and Genomic Networks
- Life Sciences › Biochemistry, Genetics and Molecular Biology › Molecular Biology › Microbial Metabolic Engineering and Bioproduction
- Keywords
- network inference, gene regulatory networks, signal propagation, logic programming, answer set programming, robust inference, sparsity constraints, PI3K signaling, MAPK signaling, colon cancer cell lines, targeted inhibitors, DREAM challenge
- MeSH terms
- Algorithms, Logic, Computational Biology
About these checks
Registry, retraction, Cites and statistics results are computed, not judged, with one exception: a printed reference that no index lists is read once by a model before it counts as a citation error. Claims are extracted by a model and kept only when their quote appears verbatim in the text; each cited source is then checked, with a model’s help, for whether it says what the claim relies on. Those verdicts can be wrong — read the claim’s quote and the cited source before relying on one.
Statistics and arithmetic are recomputed, not judged.
Confidence bands are shown only for fields calibrated on our annotated test set. None is calibrated yet, so no band is shown.
What counts as a claim ›How we measure confidence ›How we check this ›
Are you an author, or do you see a problem with this page? Request a review
How to cite
Cite CoChat for the checks on this page, and the paper for its own findings.
- This page
- CoChat. (2026). Citation check: Robust network inference using response logic. https://app.cochat.ai/papers/10.1093/bioinformatics/btz326
- The paper
- Gross, T., Wongchenko, M. J., Yan, Y., & Blüthgen, N. (2019). Robust network inference using response logic. Bioinformatics. https://doi.org/10.1093/bioinformatics/btz326
Data sources
Bibliographic data: Semantic Scholar, OpenAlex, Crossref.
Contains information from the Semantic Scholar Academic Graph Datasets, made available under the ODC Attribution License (ODC-BY 1.0).
Semantic Scholar’s data is described in: Kinney, R., et al. (2023). The Semantic Scholar Open Data Platform. arXiv:2301.10140.
