

The DOI matches its Crossref record; 57 of the 57 references it cites were found in a registry or an index.
Diagnostic value of cerebrospinal fluid alpha-synuclein seed quantification in synucleinopathies
Open accessAbstract
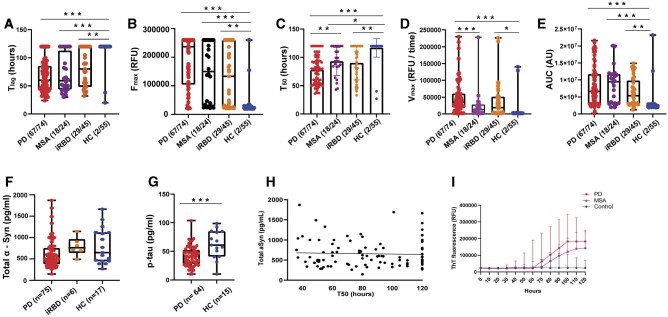
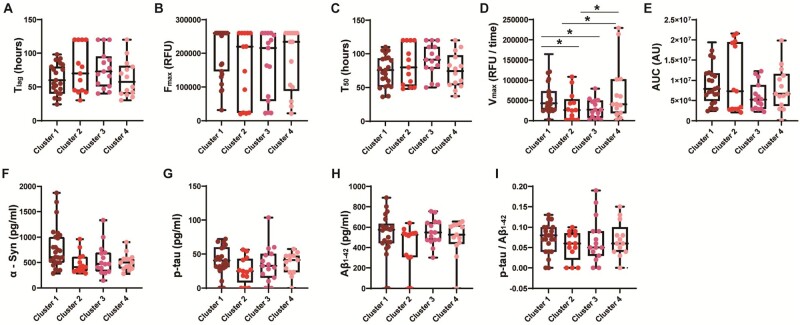
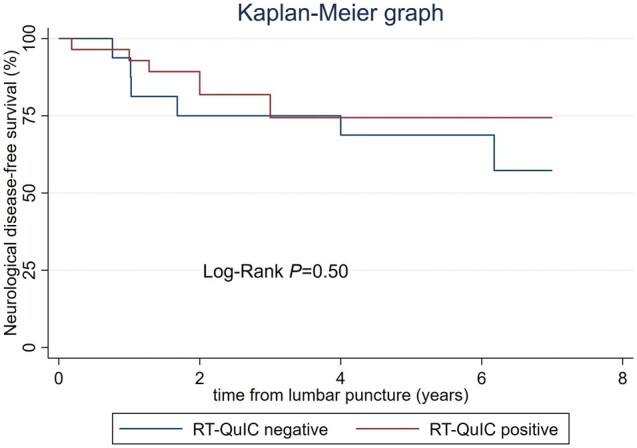
Several studies have confirmed the α-synuclein real-time quaking-induced conversion (RT-QuIC) assay to have high sensitivity and specificity for Parkinson’s disease. However, whether the assay can be used as a robust, quantitative measure to monitor disease progression, stratify different synucleinopathies and predict disease conversion in patients with idiopathic REM sleep behaviour disorder remains undetermined. The aim of this study was to assess the diagnostic value of CSF α-synuclein RT-QuIC quantitative parameters in regard to disease progression, stratification and conversion in synucleinopathies. We performed α-synuclein RT-QuIC in the CSF samples from 74 Parkinson’s disease, 24 multiple system atrophy and 45 idiopathic REM sleep behaviour disorder patients alongside 55 healthy controls, analysing quantitative assay parameters in relation to clinical data. α-Synuclein RT-QuIC showed 89% sensitivity and 96% specificity for Parkinson’s disease. There was no correlation between RT-QuIC quantitative parameters and Parkinson’s disease clinical scores (e.g. Unified Parkinson’s Disease Rating Scale motor), but RT-QuIC positivity and some quantitative parameters (e.g. Vmax) differed across the different phenotype clusters. RT-QuIC parameters also added value alongside standard clinical data in diagnosing Parkinson’s disease. The sensitivity in multiple system atrophy was 75%, and CSF samples showed longer T50 and lower Vmax compared to Parkinson’s disease. All RT-QuIC parameters correlated with worse clinical progression of multiple system atrophy (e.g. change in Unified Multiple System Atrophy Rating Scale). The overall sensitivity in idiopathic REM sleep behaviour disorder was 64%. In three of the four longitudinally followed idiopathic REM sleep behaviour disorder cohorts, we found around 90% sensitivity, but in one sample (DeNoPa) diagnosing idiopathic REM sleep behaviour disorder earlier from the community cases, this was much lower at 39%. During follow-up, 14 of 45 (31%) idiopathic REM sleep behaviour disorder patients converted to synucleinopathy with 9/14 (64%) of convertors showing baseline RT-QuIC positivity. In summary, our results showed that α-synuclein RT-QuIC adds value in diagnosing Parkinson’s disease and may provide a way to distinguish variations within Parkinson’s disease phenotype. However, the quantitative parameters did not correlate with disease severity in Parkinson’s disease. The assay distinguished multiple system atrophy patients from Parkinson’s disease patients and in contrast to Parkinson’s disease, the quantitative parameters correlated with disease progression of multiple system atrophy. Our results also provided further evidence for α-synuclein RT-QuIC having potential as an early biomarker detecting synucleinopathy in idiopathic REM sleep behaviour disorder patients prior to conversion. Further analysis of longitudinally followed idiopathic REM sleep behaviour disorder patients is needed to better understand the relationship between α-synuclein RT-QuIC signature and the progression from prodromal to different synucleinopathies.
Overview
The claims and statistics of this paper haven’t been checked yet.
Run the check — free, no account needed. It reads the open-access text and checks the sources it cites.
Integrity signals
Registry
Cites
Statistics
Figures
Verification
Claims the paper makes
The claims and statistics of this paper haven’t been checked yet.
Run the check — free, no account needed. It reads the open-access text and checks the sources it cites.
Claims other papers make about this one
Each is checked against this paper’s own text: does it say what the citing paper says it does?
The source backs part of the claim, not all of it — or backs it for a different population, condition or comparison.
In the citing paper
“SAA has already proven to be a robust technique for identifying pathological α-synuclein from cerebrospinal fluid sample from patients with PD and RBD [71, 72].”
From The gut–brain axis in early Parkinson’s disease: from prodrome to prevention (2025) · cites this paper as [72]
Experimental — accuracy not yet measured
Self-check
Percentages, sums and reported differences re-computed from the paper’s own numbers.
The self-check needs the paper’s full text.
Citations
Cites
Staging of brain pathology related to sporadic Parkinson’s disease
Braak, H., Tredici, K. D., Rüb, U., de Vos, R. A. I., Jansen Steur, E. N. H., & Braak, E. (2003) · Neurobiology of Aging · doi:10.1016/s0197-4580(02)00065-9 · Cited by 10,777
Hughes, A. J., Daniel, S. E., Kilford, L., & Lees, A. J. (1992) · Journal of Neurology, Neurosurgery & Psychiatry · doi:10.1136/jnnp.55.3.181 · Cited by 10,378
MDS clinical diagnostic criteria for Parkinson’s disease
Postuma, R. B., Berg, D., Stern, M., Poewe, W., Olanow, C. W., Oertel, W., Obeso, J., Marek, K., Litvan, I., Lang, A. E., et al. (2015) · Movement Disorders · doi:10.1002/mds.26424 · Cited by 7,653
Self-citationDiagnosis and management of dementia with Lewy bodies: Third report of the DLB consortium
McKeith, I. G., Dickson, D. W., Lowe, J., Emre, M., O'Brien, J. T., Feldman, H., Cummings, J., Duda, J. E., Lippa, C., Perry, E. K., et al. (2005) · Neurology · doi:10.1212/01.wnl.0000187889.17253.b1 · Cited by 5,069
Second consensus statement on the diagnosis of multiple system atrophy
Gilman, S., Wenning, G. K., Low, P. A., Brooks, D. J., Mathias, C. J., Trojanowski, J. Q., Wood, N. W., Colosimo, C., Dürr, A., Fowler, C. J., et al. (2008) · Neurology · doi:10.1212/01.wnl.0000324625.00404.15 · Cited by 3,140
The Sydney multicenter study of Parkinson's disease: The inevitability of dementia at 20 years
Hely, M. A., Reid, W. G. J., ADENA, M. A., Halliday, G. M., & Morris, J. G. (2008) · Movement Disorders · doi:10.1002/mds.21956 · Cited by 2,346
Self-propagation of pathogenic protein aggregates in neurodegenerative diseases
Jucker, M., & Walker, L. C. (2013) · Nature · doi:10.1038/nature12481 · Cited by 1,663
MDS research criteria for prodromal Parkinson's disease
Berg, D., Postuma, R. B., Adler, C. H., Bloem, B. R., Chan, P., Dubois, B., Gasser, T., Goetz, C. G., Halliday, G. M., Joseph, L., et al. (2015) · Movement Disorders · doi:10.1002/mds.26431 · Cited by 1,394
Self-citationPostuma, R. B., Iranzo, Á., Hu, M., Högl, B., Boeve, B. F., Manni, R., Oertel, W. H., Arnulf, I., Ferini‐Strambi, L., Puligheddu, M., et al. (2019) · Brain · doi:10.1093/brain/awz030 · Cited by 1,189
Self-citationChronic Behavioral Disorders of Human REM Sleep: A New Category of Parasomnia
Schenck, C. H., Bundlie, S. R., Ettinger, M. G., & Mahowald, M. W. (1986) · SLEEP · doi:10.1093/sleep/9.2.293 · Cited by 1,156
Cited by
Sorted by citations
Structures of α-synuclein filaments from human brains with Lewy pathology
Yang, Y., Shi, Y., Schweighauser, M., Zhang, X., Kotecha, A., Murzin, A. G., Garringer, H. J., Cullinane, P. W., Saito, Y., Foroud, T., et al. (2022) · Nature · doi:10.1038/s41586-022-05319-3 · Cited by 486
Propagative α-synuclein seeds as serum biomarkers for synucleinopathies
Okuzumi, A., Hatano, T., Matsumoto, G., Nojiri, S., Ueno, S., Imamichi, Y., Kimura, H., Kakuta, S., Kondo, A., Fukuhara, T., et al. (2023) · Nature Medicine · doi:10.1038/s41591-023-02358-9 · Cited by 331
Poewe, W. H., Stanković, I., Halliday, G. M., Meissner, W. G., Wenning, G. K., Pellecchia, M. T., Seppi, K., Palma, J., & Kaufmann, H. (2022) · Nature Reviews Disease Primers · doi:10.1038/s41572-022-00382-6 · Cited by 295
Self-citationα-Synuclein Seed Amplification Assays for Diagnosing Synucleinopathies
Bellomo, G., Luca, C. M. G. D., Paoletti, F. P., Gaetani, L., Moda, F., & Parnetti, L. (2022) · Neurology · doi:10.1212/wnl.0000000000200878 · Cited by 165
Magalhães, P., & Lashuel, H. A. (2022) · npj Parkinson s Disease · doi:10.1038/s41531-022-00357-0 · Cited by 167
Neuroimaging and fluid biomarkers in Parkinson’s disease in an era of targeted interventions
Zarkali, A., Thomas, G. E. C., Zetterberg, H., & Weil, R. S. (2024) · Nature Communications · doi:10.1038/s41467-024-49949-9 · Cited by 131
Grossauer, A., Hemicker, G., Krismer, F., Peball, M., Djamshidian, A., Poewe, W. H., Seppi, K., & Heim, B. (2023) · Movement Disorders Clinical Practice · doi:10.1002/mdc3.13710 · Cited by 122
Iranzo, Á., Mammana, A., Lopetegi, A. M., Dellavalle, S., Mayà, G., Rossi, M., Serradell, M., Baiardi, S., Arqueros, A., Quadalti, C., et al. (2023) · Neurology · doi:10.1212/wnl.0000000000207147 · Cited by 114
Concha‐Marambio, L., Weber, S., Farris, C. M., Dakna, M., Lang, E., Wicke, T., Ma, Y., Starke, M., Ebentheuer, J., Sixel‐Döring, F., et al. (2023) · Movement Disorders · doi:10.1002/mds.29329 · Cited by 119
Self-citationRutledge, J., Lehallier, B., Zarifkar, P., Losada, P. M., Shahid, M., Western, D., Gorijala, P., Ryman, S. G., Yutsis, M. V., Deutsch, G. K., et al. (2024) · Acta Neuropathologica · doi:10.1007/s00401-024-02706-0 · Cited by 119
A Statement of the MDS on Biological Definition, Staging, and Classification of Parkinson's Disease
Cardoso, F., Goetz, C. G., Mestre, T., Sampaio, C., Adler, C. H., Berg, D., Bloem, B. R., Burn, D. J., Fitts, M. S., Gasser, T., et al. (2023) · Movement Disorders · doi:10.1002/mds.29683 · Cited by 101
Self-citationCai, X., Chen, Z., He, C., Zhang, P., Nie, K., Qiu, Y., Wang, L., Wang, L., Jing, P., & Zhang, Y. (2022) · CNS Neuroscience & Therapeutics · doi:10.1111/cns.13984 · Cited by 86
Monitoring α-synuclein aggregation
Estaún‐Panzano, J., Arotçarena, M.-L., & Bézard, E. (2022) · Neurobiology of Disease · doi:10.1016/j.nbd.2022.105966 · Cited by 93
Proposal for a Biologic Staging System of Parkinson’s Disease
Chahine, L. M., Merchant, K., Siderowf, A. D., Sherer, T., Tanner, C. M., MAREK, K. L., & Simuni, T. (2023) · Journal of Parkinson s Disease · doi:10.3233/jpd-225111 · Cited by 86
Ma, Y., Farris, C. M., Weber, S., Schade, S., Nguyen, H., Pérez‐Soriano, A., Giraldo, D. M., Fernández, M., Soto, M., Cámara, A., et al. (2024) · The Lancet Neurology · doi:10.1016/s1474-4422(24)00395-8 · Cited by 84
Self-citationYoo, D., Bang, J.-I., Ahn, C., Nyaga, V. N., Kim, Y., Kang, M. J., & Ahn, T. (2022) · Parkinsonism & Related Disorders · doi:10.1016/j.parkreldis.2022.10.007 · Cited by 81
Detecting Misfolded α‐Synuclein in Blood Years before the Diagnosis of Parkinson's Disease
Kluge, A., Schaeffer, E., Bunk, J., Sommerauer, M., Röttgen, S., Schulte, C., Röeben, B., von Thaler, A., Welzel, J., Lucius, R., et al. (2024) · Movement Disorders · doi:10.1002/mds.29766 · Cited by 71
Multiple system atrophy: advances in pathophysiology, diagnosis, and treatment
Krismer, F., Fanciulli, A., Meissner, W. G., Coon, E. A., & Wenning, G. K. (2024) · The Lancet Neurology · doi:10.1016/s1474-4422(24)00396-x · Cited by 66
Self-citationBongianni, M., Catalan, M., Perra, D., Fontana, E., Janes, F., Bertolotti, C., Sacchetto, L., Capaldi, S., Tagliapietra, M., Polverino, P., et al. (2022) · Translational Neurodegeneration · doi:10.1186/s40035-022-00311-3 · Cited by 63
Fluid biomarkers in Alzheimer's disease
Simrén, J., Elmgren, A., Blennow, K., & Zetterberg, H. (2023) · Advances in Clinical Chemistry · doi:10.1016/bs.acc.2022.09.006 · Cited by 58
How should we be using biomarkers in trials of disease modification in Parkinson’s disease?
Vijiaratnam, N., & Foltynie, T. (2023) · Brain · doi:10.1093/brain/awad265 · Cited by 56
Pathological Validation of the MDS Criteria for the Diagnosis of Multiple System Atrophy
Virameteekul, S., Révész, T., Jaunmuktane, Z., Warner, T. T., & Pablo‐Fernández, E. D. (2023) · Movement Disorders · doi:10.1002/mds.29304 · Cited by 48
Kuzkina, A., Panzer, C., Seger, A., Schmitt, D., Rößle, J., Schreglmann, S. R., Knacke, H., Salabasidou, E., Kohl, A., Sittig, E., et al. (2023) · Movement Disorders · doi:10.1002/mds.29340 · Cited by 49
α-Synuclein: A Promising Biomarker for Parkinson’s Disease and Related Disorders
Hatano, T., Okuzumi, A., Matsumoto, G., Tsunemi, T., & Hattori, N. (2024) · Journal of Movement Disorders · doi:10.14802/jmd.24075 · Cited by 49
Stefani, A., Antelmi, E., Arnaldi, D., Arnulf, I., During, E., Högl, B., Hu, M. M. T., Iranzo, Á., Luke, R., Peever, J. H., et al. (2025) · Molecular Neurodegeneration · doi:10.1186/s13024-025-00809-0 · Cited by 47
Self-citationCinpanemab in Early Parkinson Disease
Hutchison, R. M., Fraser, K. B., Yang, M., Fox, T., Hirschhorn, E., Njingti, E., Scott, D., Bedell, B. J., Kistner, K. M., Cedarbaum, J. M., et al. (2024) · Neurology · doi:10.1212/wnl.0000000000209137 · Cited by 47
Self-citationCompta, Y., Painous, C., Soto, M., Pulido-Salgado, M., Fernández, M., Cámara, A., Sánchez, V., Bargalló, N., Caballol, N. S., Pont‐Sunyer, C., et al. (2022) · Parkinsonism & Related Disorders · doi:10.1016/j.parkreldis.2022.05.006 · Cited by 45
Zheng, Y., Li, S., Chen, Y., Yu, Z., Jiang, Y., & Feng, T. (2023) · European Journal of Neurology · doi:10.1111/ene.16041 · Cited by 44
Bernhardt, A. M., Longen, S., Trossbach, S. V., Rossi, M., Weckbecker, D., Schmidt, F., Jäck, A., Katzdobler, S., Fietzek, U. M., Weidinger, E., et al. (2025) · Acta Neuropathologica · doi:10.1007/s00401-025-02853-y · Cited by 42
Peña‐Bautista, C., Kumar, R., Baquero, M., Johansson, J., Cháfer‐Pericás, C., Abelein, A., & Ferreira, D. (2023) · Frontiers in Molecular Biosciences · doi:10.3389/fmolb.2023.1193458 · Cited by 41
Coughlin, D. G., Shifflett, B., Farris, C. M., Ma, Y., Galasko, D. R., Edland, S. D., Mollenhauer, B., Brumm, M. C., Poston, K. L., MAREK, K. L., et al. (2025) · Neurology · doi:10.1212/wnl.0000000000210279 · Cited by 41
Self-citationPharmacological PINK1 activation ameliorates Pathology in Parkinson’s Disease modelsPreprint
Chin, R., Rakhit, R., Ditsworth, D., Wang, C., Bartholoméüs, J., Liu, S., Mody, A., Laishu, A., Eastes, A., Tai, C., et al. (2023) · bioRxiv (Cold Spring Harbor Laboratory) · doi:10.1101/2023.02.14.528378 · Cited by 42
Fluid and Biopsy Based Biomarkers in Parkinson's Disease
Coughlin, D. G., & Irwin, D. J. (2023) · Neurotherapeutics · doi:10.1007/s13311-023-01379-z · Cited by 44
Schaeffer, E., Kluge, A., Schulte, C., Deuschle, C., Bunk, J., Welzel, J., Maetzler, W., & Berg, D. (2024) · Journal of Parkinson s Disease · doi:10.3233/jpd-230390 · Cited by 40
Central and peripheral α‐synuclein in Parkinson disease detected by seed amplification assay
Chahine, L. M., Beach, T. G., Adler, C. H., Hepker, M., Kanthasamy, A. G., Appel, S. M., Pritzkow, S., Pinho, M. A., Mosovsky, S., Serrano, G. E., et al. (2023) · Annals of Clinical and Translational Neurology · doi:10.1002/acn3.51753 · Cited by 38
Self-citationKuang, Y., Mao, H., Huang, X., Chen, M., Dai, W. H., Gan, T., Wang, J., Sun, H., Lin, H., Liu, Q., et al. (2024) · Translational Neurodegeneration · doi:10.1186/s40035-024-00449-2 · Cited by 37
The gut–brain axis in early Parkinson’s disease: from prodrome to prevention
Oliver, P. J., Civitelli, L., & Hu, M. T. (2025) · Journal of Neurology · doi:10.1007/s00415-025-13138-5 · Cited by 42
“SAA has already proven to be a robust technique for identifying pathological α-synuclein from cerebrospinal fluid sample from patients with PD and RBD [71, 72].”
Self-citationWiseman, J. A., Turner, C. P., Faull, R. L. M., Halliday, G. M., & Dieriks, B. V. (2025) · Translational Neurodegeneration · doi:10.1186/s40035-025-00469-6 · Cited by 33
The α-synuclein seed amplification assay: Interpreting a test of Parkinson's pathology
Espay, A. J., Lees, A. J., Cardoso, F., Frucht, S. J., Erskine, D., Sandoval, I. M., Bernal-Conde, L. D., Sturchio, A., Imarisio, A., Hoffmann, C., et al. (2024) · Parkinsonism & Related Disorders · doi:10.1016/j.parkreldis.2024.107256 · Cited by 34
Disease modification in Parkinsonism: obstacles and ways forward
Höllerhage, M., Klietz, M., & Höglinger, G. U. (2022) · Journal of Neural Transmission · doi:10.1007/s00702-022-02520-6 · Cited by 29
Srivastava, A., Wang, Q., Orru, C. D., Fernández, M., Compta, Y., Ghetti, B. F., Zanusso, G., Zou, W., Caughey, B. W., & Beauchemin, C. A. A. (2024) · PLoS Pathogens · doi:10.1371/journal.ppat.1012554 · Cited by 29
Disease-modifying therapies for Parkinson disease: lessons from multiple sclerosis
Kalia, L. V., Asis, A., Arbour, N., Bar‐Or, A., Bove, R. M., Luca, D. G. D., Fon, E. A., Fox, S. H., Gan‐Or, Z., Gommerman, J. L., et al. (2024) · Nature Reviews Neurology · doi:10.1038/s41582-024-01023-0 · Cited by 35
Madrer, N., Vaknine, S., Zorbaz, T., Tzur, Y., Bennett, E. R., Drori, P., Suissa, N., Greenberg, D., Lerner, E., Soreq, E., et al. (2025) · Nature Aging · doi:10.1038/s43587-025-00851-z · Cited by 28
Alpha-Synuclein Strain Variability in Body-First and Brain-First Synucleinopathies
Just, M. K., Gram, H., Theologidis, V., Jensen, P. H., Nilsson, K. P. R., Lindgren, M., Knudsen, K., Borghammer, P., & Berge, N. V. D. (2022) · Frontiers in Aging Neuroscience · doi:10.3389/fnagi.2022.907293 · Cited by 32
Zheng, Y., Yu, Z., Cai, H., Kou, W., Chen, Y., Li, S., Zhang, N., & Feng, T. (2024) · Movement Disorders · doi:10.1002/mds.29828 · Cited by 29
Rissardo, J. P., & Caprara, A. L. F. (2025) · Clinics and Practice · doi:10.3390/clinpract15060107 · Cited by 24
Biomarkers of Parkinson’s Disease: From Basic Research to Clinical Practice
Ma, Z.-L., Wang, Z., Zhang, F., Liu, H. P., Mao, L.-H., & Yuan, L. (2023) · Aging and Disease · doi:10.14336/ad.2023.1005 · Cited by 29
Nanoparticle-Enhanced RT-QuIC (Nano-QuIC) Diagnostic Assay for Misfolded Proteins
Christenson, P. R., Li, M., Rowden, G. R., Larsen, P. A., & Oh, S. (2023) · Nano Letters · doi:10.1021/acs.nanolett.3c01001 · Cited by 23
Multidimensional biomarkers for multiple system atrophy: an update and future directions
Wan, L., Zhu, S., Chen, Z., Qiu, R., Tang, B., & Jiang, H. F. (2023) · Translational Neurodegeneration · doi:10.1186/s40035-023-00370-0 · Cited by 26
Gonzalez‐Robles, C., Weil, R. S., van Wamelen, D. J., Bartlett, M., Burnell, M., Clarke, C. S., Hu, M. T., Huxford, B., Jha, A., Lambert, C., et al. (2023) · Journal of Parkinson s Disease · doi:10.3233/jpd-230051 · Cited by 25
Self-citationα-Synuclein pathology from the body to the brain: so many seeds so close to the central soil
Yang, Y., & Zhang, Z. (2023) · Neural Regeneration Research · doi:10.4103/1673-5374.387967 · Cited by 27
Pharmacological PINK1 activation ameliorates Pathology in Parkinson’s Disease modelsPreprint
Hertz, N. T., Chin, R., Rakhit, R., Ditsworth, D., Wang, C., Bartholoméüs, J., Liu, S., Mody, A., Laihsu, A., Eastes, A., et al. (2024) · Research Square · doi:10.21203/rs.3.rs-4356493/v1 · Cited by 23
Multiple biomarkers improve diagnostic accuracy across Lewy body and Alzheimer's disease spectra
Plastini, M. J., Ruiz, C. A., Young, C. B., Wilson, E. N., Shahid, M., Lamoureux, J., Andreasson, K. I., Kerchner, G. A., Montine, T. J., Henderson, V. W., et al. (2024) · Annals of Clinical and Translational Neurology · doi:10.1002/acn3.52034 · Cited by 23
Pathological α-synuclein detected by real-time quaking-induced conversion in synucleinopathies
Huang, J., Yuan, X., Chen, L., Hu, B., Wang, H., Wang, Y., & Huang, W. (2024) · Experimental Gerontology · doi:10.1016/j.exger.2024.112366 · Cited by 22
An update on new-age potential biomarkers for Parkinson’s disease
Soni, R., Mathur, K., & Shah, J. (2024) · Ageing Research Reviews · doi:10.1016/j.arr.2024.102208 · Cited by 21
Aerobic exercise-induced changes in fluid biomarkers in Parkinson’s disease
Luthra, N., Mehta, N., Munoz, M. J., Fantuzzi, G., Lamotte, G. J., Haus, J. M., McFarland, N. R., Tansey, M. G., González-Latapí, P., Caraveo, G., et al. (2025) · npj Parkinson s Disease · doi:10.1038/s41531-025-01042-8 · Cited by 24
α-synuclein biomarker assays: bridging research and patient care
Agin‐Liebes, J., Lodge, A., Reddy, H., Vacchi, E., Usseglio, J., Honig, L. S., Melli, G., Noble, J. M., & Przedborski, S. (2025) · The Lancet Neurology · doi:10.1016/s1474-4422(25)00194-2 · Cited by 20
Production of Recombinant Alpha-Synuclein: Still No Standardized Protocol in Sight
Al‐Azzani, M., König, A., & Outeiro, T. F. (2022) · Biomolecules · doi:10.3390/biom12020324 · Cited by 21
Bsoul, R., McWilliam, O. H., Waldemar, G., Hasselbalch, S. G., Simonsen, A. H., von Buchwald, C., Bech, M., Pinborg, C. H., Pedersen, C. K., Baungaard, S. O., et al. (2025) · Acta Neuropathologica Communications · doi:10.1186/s40478-025-02034-8 · Cited by 19
Multiple System Atrophy: Advances in Diagnosis and Therapy
Watanabe, H., Shima, S., Mizutani, Y., Ueda, A., & Ito, M. (2022) · Journal of Movement Disorders · doi:10.14802/jmd.22082 · Cited by 19
Giarola, J. D. F., Santos, J., Estévez, M. ‐., Ventura, S., Pallarès, I., & Lechuga, L. M. (2024) · Analytica Chimica Acta · doi:10.1016/j.aca.2024.342559 · Cited by 19
Talyansky, S. D., Guen, Y. L., Kasireddy, N. M., Belloy, M. E., & Greicius, M. D. (2023) · Acta Neuropathologica Communications · doi:10.1186/s40478-023-01626-6 · Cited by 21
Singer, W., Schmeichel, A. M., Sletten, D. M., Gehrking, T. L., Gehrking, J. A., Trejo‐Lopez, J. A., Suarez, M. D., Anderson, J. K., Bass, P. H., Lesnick, T. G., et al. (2023) · Clinical Autonomic Research · doi:10.1007/s10286-023-00974-6 · Cited by 17
Emerging role of microglia in inter-cellular transmission of α-synuclein in Parkinson’s disease
Zhang, X., Yu, H., & Feng, J. (2024) · Frontiers in Aging Neuroscience · doi:10.3389/fnagi.2024.1411104 · Cited by 17
Hypometabolic mismatch with atrophy and tau pathology in mixed Alzheimer’s and Lewy body disease
Duong, M. T., Das, S. R., Khandelwal, P., Lyu, X., Xie, L., McGrew, E., Dehghani, N., McMillan, C. T., Lee, E. B., Shaw, L. M. J., et al. (2024) · Brain · doi:10.1093/brain/awae352 · Cited by 17
Pick’s Disease, Seeding an Answer to the Clinical Diagnosis Conundrum
Tamvaka, N., Manne, S., Kondru, N. C., & Ross, O. A. (2023) · Biomedicines · doi:10.3390/biomedicines11061646 · Cited by 17
Fernandes, M., Maio, S., Eusebi, P., Placidi, F., Izzi, F., Spanetta, M., Masi, C. D., Lupo, C., Calvello, C., Nuccetelli, M., et al. (2023) · SLEEP · doi:10.1093/sleep/zsad198 · Cited by 15
Buongiorno, M., Marzal-Espí, C., Fernández, M., Cullell, N., de Mena, L., Sánchez‐Benavides, G., de la Sierra, A., Krupiński, J., & Compta, Y. (2023) · Frontiers in Aging Neuroscience · doi:10.3389/fnagi.2023.1251755 · Cited by 16
Prasinezumab slows motor progression in Parkinsons disease: beyond the clinical data
Xiao, B., & Tan, E. (2025) · npj Parkinson s Disease · doi:10.1038/s41531-025-00886-4 · Cited by 17
Orso, B., Brosse, S., Frasnelli, J., & Arnaldi, D. (2024) · Journal of Parkinson s Disease · doi:10.3233/jpd-230348 · Cited by 16
Schaeffer, E., Yılmaz, R., Louis, E. K. S., & Noyce, A. J. (2024) · Journal of Parkinson s Disease · doi:10.3233/jpd-230428 · Cited by 15
Recent Advances in Clinical Trials in Multiple System Atrophy
Bendetowicz, D., Fabbri, M., Sirna, F., Fernagut, P., Foubert‐Samier, A., Saulnier, T., Traon, A. P., Proust‐Lima, C., Rascol, O., & Meissner, W. G. (2024) · Current Neurology and Neuroscience Reports · doi:10.1007/s11910-024-01335-0 · Cited by 16
Self-citationBrain-derived and in vitro-seeded alpha-synuclein fibrils exhibit distinct biophysical profiles
Lee, S. S., Civitelli, L., & Parkkinen, L. (2024) · eLife · doi:10.7554/elife.92775.3 · Cited by 21
Self-citationSeibyl, J. P. (2022) · Journal of Nuclear Medicine · doi:10.2967/jnumed.122.264773 · Cited by 14
Lopetegi, A. M., Baiardi, S., Balasa, M., Mammana, A., Mayà, G., Rossi, M., Serradell, M., Zenesini, C., Ticca, A., Santamaría, J., et al. (2024) · npj Parkinson s Disease · doi:10.1038/s41531-024-00770-7 · Cited by 13
Chen, Z., Shi, Q., Xiao, K., Kong, Y., Liang, D.-L., Wang, Y., Min, R. W., Zhang, J., Wang, Z., Ye, H., et al. (2024) · JAMA Neurology · doi:10.1001/jamaneurol.2024.3458 · Cited by 13
Bruschi, G., Bortolin, E., Mazzeo, S., Bombaci, A., Pozzi, F. E., Agosta, F., Ferini‐Strambi, L., Filippi, M., & Salsone, M. (2025) · SLEEP · doi:10.1093/sleep/zsaf174 · Cited by 13
Real-time quaking-induced conversion assay is accurate for Lewy body diseases: a meta-analysis
Wang, Y., Hu, J., Chen, X., Wang, S., Zhang, C., Hu, J., Guo, D., & Liu, X. (2022) · Neurological Sciences · doi:10.1007/s10072-022-06014-x · Cited by 13
Lawton, M., Tan, M. M. X., Ben‐Shlomo, Y., Baig, F., Barber, T. R., Klein, J. C., Evetts, S. G., Millin, S., Malek, N., Grosset, K. A., et al. (2022) · Journal of Neurology Neurosurgery & Psychiatry · doi:10.1136/jnnp-2021-327376 · Cited by 13
Self-citationAlpha-synuclein seeding amplification assays in Lewy body dementia: a brief review
Bregendahl, M. E., Kaya, Z. B., Singer, W., & McLean, P. J. (2025) · Molecular Neurodegeneration · doi:10.1186/s13024-025-00868-3 · Cited by 15
Singer, W. (2022) · Clinical Autonomic Research · doi:10.1007/s10286-022-00882-1 · Cited by 12
Arnaldi, D., Mattioli, P., Pardini, M., Morbelli, S. D., Capriglia, E., Rubino, A., Rustioni, V., Terzaghi, M., Casaglia, E., Serra, A., et al. (2023) · European Journal of Neurology · doi:10.1111/ene.16001 · Cited by 12
Self-citationEvaluating the Diagnostic Potential of Combined Salivary and Skin Biomarkers in Parkinson’s Disease
Costanzo, M., Galosi, E., Bartolo, M. I. D., Gallo, G., Leodori, G., Belvisi, D., Conte, A., Fabbrini, G., Truini, A., Berardelli, A., et al. (2024) · International Journal of Molecular Sciences · doi:10.3390/ijms25094823 · Cited by 13
Abdi, I. Y., Hashish, S. A., & El‐Agnaf, O. M. A. (2025) · Journal of Parkinson s Disease · doi:10.1177/1877718x251325124 · Cited by 14
The promise of amplification assays for accurate early detection of α-synucleinopathies: A review
Kurapova, R., Chouliaras, L., & O'Brien, J. T. (2022) · Experimental Gerontology · doi:10.1016/j.exger.2022.111842 · Cited by 11
Novel CSF Biomarkers Tracking Autoimmune Inflammatory and Neurodegenerative Aspects of CNS Diseases
Kapaki, E. N., Vakrakou, A. G., & Boufidou, F. (2022) · Diagnostics · doi:10.3390/diagnostics13010073 · Cited by 11
Biofluid Detection of Pathological α -Synuclein in the Prodromal Phase of Synucleinopathies
Kluge, A., & Iranzo, Á. (2024) · Journal of Parkinson s Disease · doi:10.3233/jpd-230429 · Cited by 12
CSF α-Synuclein Seed Amplification Assays and Skin Immunofluorescence
Coughlin, D. G., Adler, C. H., Barbosa, W. A., Feuerstein, J., Galasko, D. R., Gunzler, S. A., Shahed, J. J., Kannarkat, G. T., Lang, A. E., Lemus, J. D. L., et al. (2026) · Neurology · doi:10.1212/wnl.0000000000214648 · Cited by 10
Alpha‐synuclein pathology in isolated rapid eye movement sleep behaviour disorder: a meta‐analysis
IFTIKHAR, I. H., Alshimemeri, S. A., Rabah, H., Rao, S. T., & BaHammam, A. S. (2024) · Journal of Sleep Research · doi:10.1111/jsr.14204 · Cited by 10
Pilotto, A., Zanusso, G., Antelmi, E., Okuzumi, A., Zatti, C., Lupini, A., Bongianni, M., Padovani, A., & Hattori, N. (2024) · Journal of Parkinson s Disease · doi:10.3233/jpd-240007 · Cited by 10
Self-citationSeeding Aggregation Assays in Lewy Bodies Disorders: A Narrative State-of-the-Art Review
Bougea, A. M. (2024) · International Journal of Molecular Sciences · doi:10.3390/ijms251910783 · Cited by 10
Sirerol-Piquer, M. S., Pérez‐Villalba, A., Duart-Abadía, P., Belenguer, G., Gómez‐Pinedo, U., Blasco-Chamarro, L., Carrillo-Barberà, P., Pérez‐Cañamás, A., Navarro, V., Dehay, B., et al. (2025) · Molecular Neurodegeneration · doi:10.1186/s13024-025-00816-1 · Cited by 12
Brain-derived and in vitro-seeded alpha-synuclein fibrils exhibit distinct biophysical profilesPreprint
Lee, S. S., Civitelli, L., & Parkkinen, L. (2024) · eLife · doi:10.7554/elife.92775 · Cited by 10
Self-citationα‐Synuclein species in plasma neuron‐derived extracellular vesicles as biomarkers for iRBD
Wang, X., Zheng, Y., Cai, H., Kou, W., Yang, C., Li, S., Zhu, B., Wu, J., Zhang, N., Feng, T., et al. (2024) · Annals of Clinical and Translational Neurology · doi:10.1002/acn3.52200 · Cited by 9
Being Prodromal: Current Criteria in the Context of Isolated REM Sleep Behavior Disorder
Ophey, A., Röttgen, S., Reichrath, J., Kalbe, E., Fink, G. R., & Sommerauer, M. (2025) · Movement Disorders Clinical Practice · doi:10.1002/mdc3.70006 · Cited by 9
A Narrative Review on Biochemical Markers and Emerging Treatments in Prodromal Synucleinopathies
Rissardo, J. P., & Caprara, A. L. F. (2025) · Clinics and Practice · doi:10.3390/clinpract15030065 · Cited by 9
Blauwendraat, C., Noyce, A. J., Mata, I. F., Screven, L. A., Solle, J. C., Dumanis, S. B., Riley, E. A. U., Periñán, M. T., Okubadejo, N. U., Klein, C., et al. (2025) · The American Journal of Human Genetics · doi:10.1016/j.ajhg.2025.07.014 · Cited by 11
α-Synuclein Seed Amplifications Assay in a Cohort With Cognitive Impairment
Esteller, D., Pérez‐Millan, A., Sarto, J., Puey, R., Soley, N. G., Tort‐Merino, A., Falgàs, N., Borrego‐Écija, S., Piñol‐Ripoll, G., Massons, M., et al. (2025) · Neurology · doi:10.1212/wnl.0000000000214040 · Cited by 12
α-synuclein monoclonal antibodies in Parkinson's disease: A failed promise or unmet potential?
Messak, M., Abdelmageed, A., Khattab, Y. A., Altalab, G., Mandour, Y., & Shaker, O. (2026) · Journal of the Neurological Sciences · doi:10.1016/j.jns.2026.125806 · Cited by 9
Duan, S., Yang, J., Cui, Z., Li, J., Zheng, H., Zhao, T., Yuan, Y., Liu, Y., Zhao, L., Wang, Y., et al. (2023) · Translational Neurodegeneration · doi:10.1186/s40035-023-00345-1 · Cited by 9
Metadata
- Authors
- Poggiolini, I., Gupta, V., Lawton, M., Lee, S., El-Turabi, A., Querejeta-Coma, A., Trenkwalder, C., Sixel-Döring, F., Foubert-Samier, A., Pavy-Le Traon, A., Plazzi, G., Biscarini, F., Montplaisir, J., Gagnon, J.-F., Postuma, R. B., Antelmi, E., Meissner, W. G., Mollenhauer, B., Ben-Shlomo, Y., Hu, M. T., & Parkkinen, L.
- Affiliations
- University of Oxford (GB)
- University of Bristol (GB)
- Nuffield Department of Clinical Neurosciences, Oxford Parkinson’s Disease Centre, University of Oxford, UK
- Universitätsmedizin Göttingen (DE)
- Paracelsus Elena Klinik, Centre for Movement Disorders, Kassel, Germany
- French Reference Centre for MSA, University Hospital Bordeaux, Bordeaux, France
- French Reference Centre for MSA, University Hospital of Toulouse, Toulouse, France
- University of Modena and Reggio Emilia (IT)
- University of Bologna (IT)
- Hôpital du Sacré-Cœur de Montréal (CA)
- Université du Québec à Montréal (CA)
- Montreal General Hospital (CA)
- University of Verona (IT)
- Centre National de la Recherche Scientifique (FR)
- School of Social and Community Medicine, Bristol Medical School, University of Bristol, UK
- Corresponding author
- Parkkinen, Laura
- ORCID
- Venue
- Brain
- Publisher
- Oxford University Press (OUP)
- Published
- 2021-12-11
- Volume
- 145
- Issue
- 2
- Pages
- 584-595
- ISSN
- 0006-8950 (ISSN-L)
- 1460-2156
- PMC
- PMC9014737
- OpenAlex
- W4200520313
- Cited by
- 191
- References
- 57
- Citations by year
- 2026: 33 · 2025: 50 · 2024: 48 · 2023: 35 · 2022: 25
- FWCI
- 12.92
- Type
- journal article
- Language
- en
- Open access
- hybrid
- doi.org
- Licence
- Locations
- Brain (publishedVersion, cc-by-nc)
- PubMed Central (publishedVersion, cc-by-nc)
- PubMed (publishedVersion)
- Explore Bristol Research (publishedVersion, cc-by-nc)
- HAL (submittedVersion, cc-by-nc)
- Archivio istituzionale della ricerca (Alma Mater Studiorum Università di Bologna) (submittedVersion, cc-by-nc)
- IRIS UNIMORE (University of Modena and Reggio Emilia) (submittedVersion, cc-by)
- Oskar-Bordeaux (Universite de Bordeaux) (submittedVersion, cc-by-nc)
- Funders
- Biogen
- Teva Pharmaceutical Industries
- Jazz Pharmaceuticals
- Parkinson's Foundation
- UK Research and Innovation
- National Institute for Health and Care Research
- Parkinson's UK (J-1403, G‐1806, J-0901, J-2101)
- Deutsche Forschungsgemeinschaft
- Eisai
- Servier
- H. Lundbeck A/S
- Deutsche Parkinson Vereinigung
- Idorsia Pharmaceuticals
- Otsuka Pharmaceutical Development and Commercialization
- Canadian Institutes of Health Research
- Medical Research Council (MR/T046287/1)
- Engineering and Physical Sciences Research Council (EP/R013756/1)
- NIHR Oxford Biomedical Research Centre
- Topics
- Health Sciences › Medicine › Clinical Neurology › Parkinson's Disease Mechanisms and Treatments
- Health Sciences › Medicine › Psychiatry and Mental health › Dementia and Cognitive Impairment Research
- Life Sciences › Neuroscience › Neurology › Neuroinflammation and Neurodegeneration Mechanisms
- Keywords
- alpha-synuclein, cerebrospinal fluid, RT-QuIC, synucleinopathies, Parkinson's disease, multiple system atrophy, idiopathic REM sleep behavior disorder, disease progression, disease transformation, sensitivity and specificity, Vmax, T50, biomarkers, Unified Parkinson's Disease Rating Scale
- MeSH terms
- Synucleinopathies, Humans, Parkinson Disease, Disease Progression, Multiple System Atrophy, REM Sleep Behavior Disorder, alpha-Synuclein
About these checks
Registry, retraction, Cites and statistics results are computed, not judged, with one exception: a printed reference that no index lists is read once by a model before it counts as a citation error. Claims are extracted by a model and kept only when their quote appears verbatim in the text; each cited source is then checked, with a model’s help, for whether it says what the claim relies on. Those verdicts can be wrong — read the claim’s quote and the cited source before relying on one.
Statistics and arithmetic are recomputed, not judged.
Confidence bands are shown only for fields calibrated on our annotated test set. None is calibrated yet, so no band is shown.
What counts as a claim ›How we measure confidence ›How we check this ›
Are you an author, or do you see a problem with this page? Request a review
