

The DOI matches its Crossref record; 34 of the 34 references it cites were found in a registry or an index.
Triglyceride-rich lipoprotein remnants, low-density lipoproteins, and risk of coronary heart disease: a UK Biobank study
Open accessAbstract
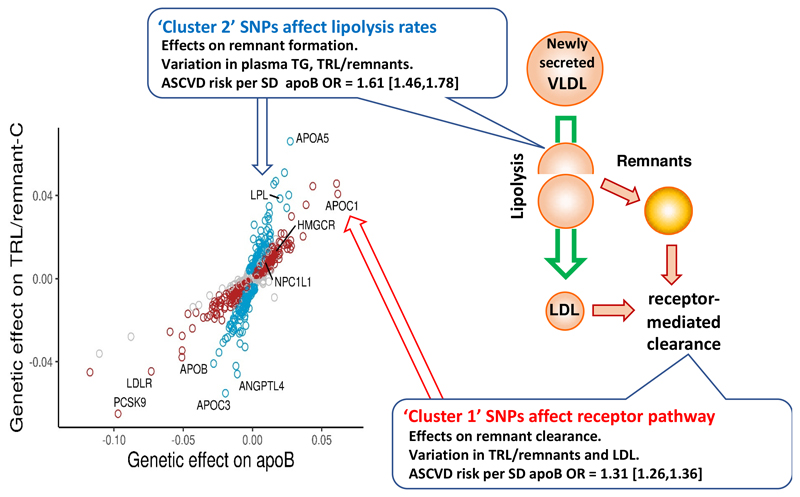
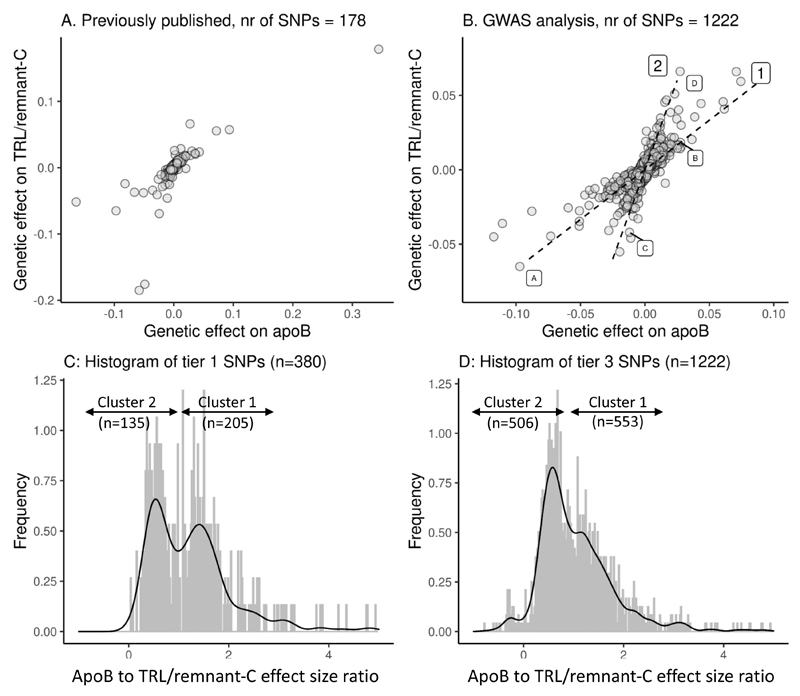
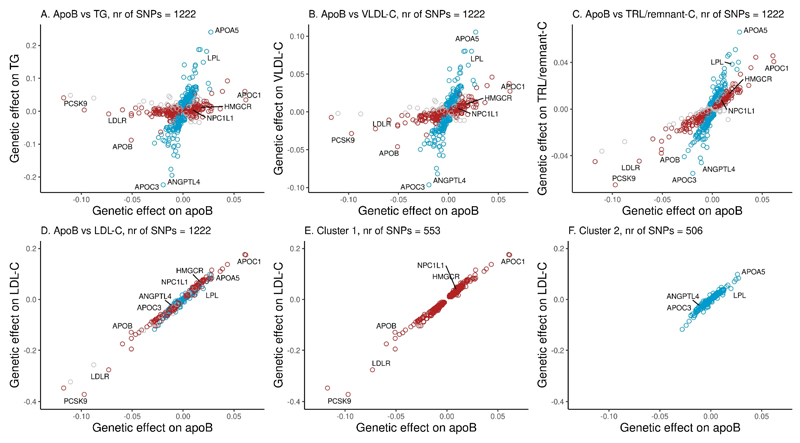
Aims: The strength of the relationship of triglyceride-rich lipoproteins (TRL) with risk of coronary heart disease (CHD) compared with low-density lipoprotein (LDL) is yet to be resolved. Methods and results: Single-nucleotide polymorphisms (SNPs) associated with TRL/remnant cholesterol (TRL/remnant-C) and LDL cholesterol (LDL-C) were identified in the UK Biobank population. In a multivariable Mendelian randomization analysis, TRL/remnant-C was strongly and independently associated with CHD in a model adjusted for apolipoprotein B (apoB). Likewise, in a multivariable model, TRL/remnant-C and LDL-C also exhibited independent associations with CHD with odds ratios per 1 mmol/L higher cholesterol of 2.59 [95% confidence interval (CI): 1.99–3.36] and 1.37 [95% CI: 1.27–1.48], respectively. To examine the per-particle atherogenicity of TRL/remnants and LDL, SNPs were categorized into two clusters with differing effects on TRL/remnant-C and LDL-C. Cluster 1 contained SNPs in genes related to receptor-mediated lipoprotein removal that affected LDL-C more than TRL/remnant-C, whereas cluster 2 contained SNPs in genes related to lipolysis that had a much greater effect on TRL/remnant-C. The CHD odds ratio per standard deviation (Sd) higher apoB for cluster 2 (with the higher TRL/remnant to LDL ratio) was 1.76 (95% CI: 1.58–1.96), which was significantly greater than the CHD odds ratio per Sd higher apoB in cluster 1 [1.33 (95% CI: 1.26–1.40)]. A concordant result was obtained by using polygenic scores for each cluster to relate apoB to CHD risk. Conclusion: Distinct SNP clusters appear to impact differentially on remnant particles and LDL. Our findings are consistent with TRL/remnants having a substantially greater atherogenicity per particle than LDL.
Overview
The claims and statistics of this paper haven’t been checked yet.
Run the check — free, no account needed. It reads the open-access text and checks the sources it cites.
Integrity signals
Registry
Cites
Statistics
Figures
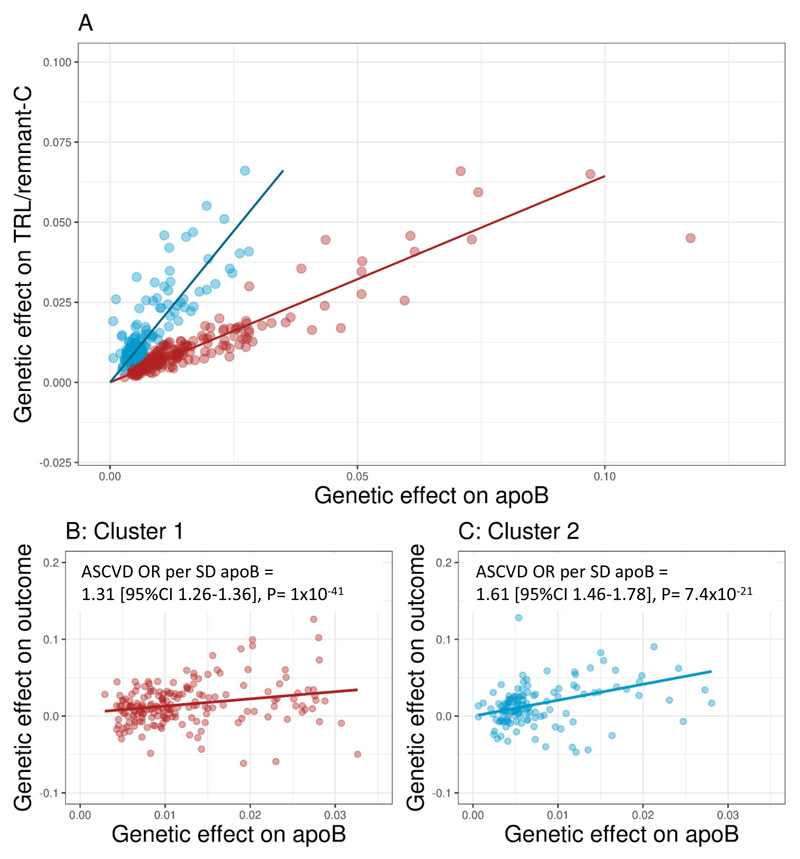
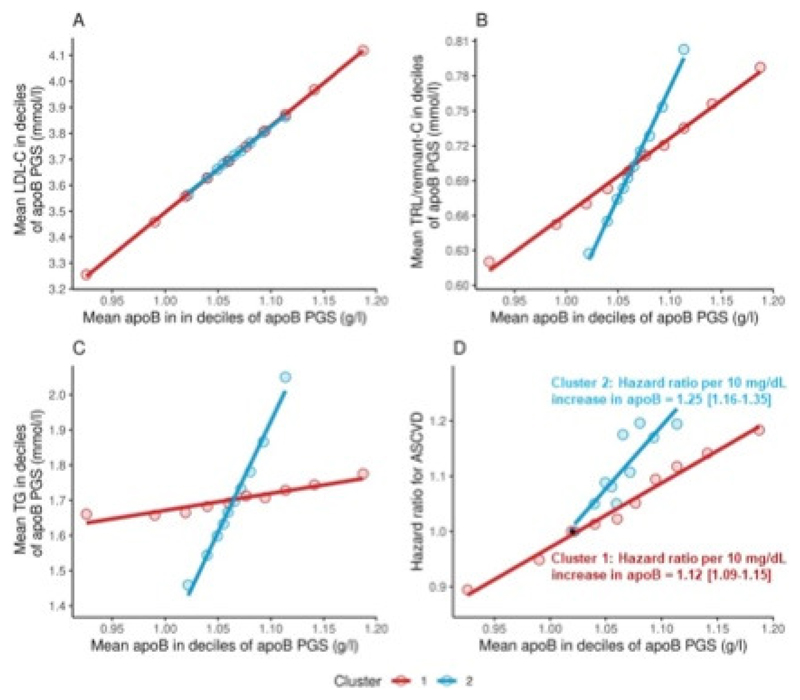
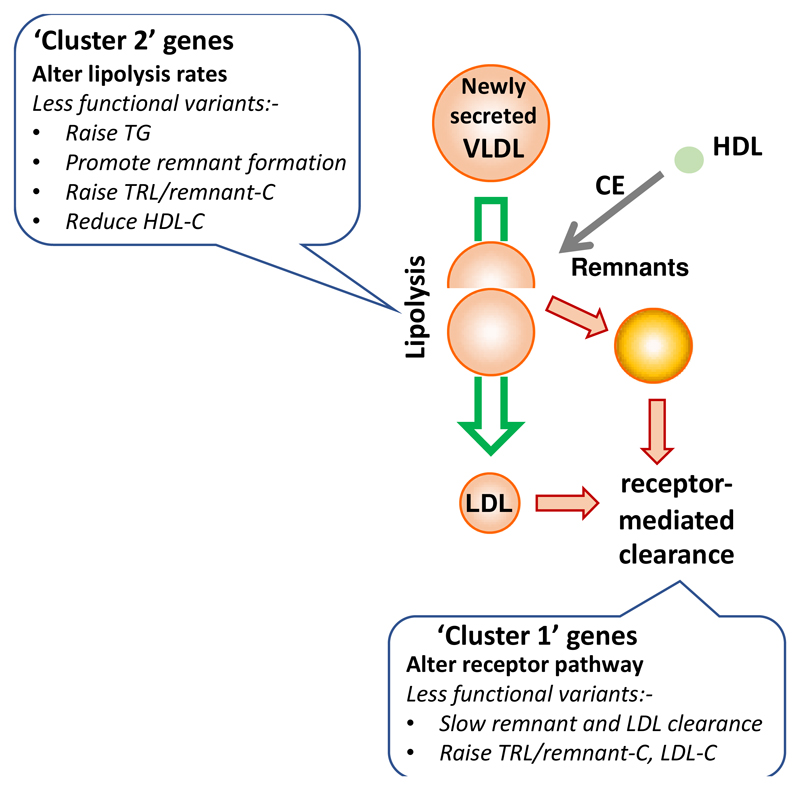
Verification
Claims the paper makes
The claims and statistics of this paper haven’t been checked yet.
Run the check — free, no account needed. It reads the open-access text and checks the sources it cites.
Claims other papers make about this one
Each is checked against this paper’s own text: does it say what the citing paper says it does?
The source backs part of the claim, not all of it — or backs it for a different population, condition or comparison.
In the citing paper
“Moderate elevations in triglyceride levels are associated with an increased risk of atherosclerotic cardiovascular disease, 1,2,19,20”
From Targeting APOC3 with Olezarsen in Moderate Hypertriglyceridemia (2025) · cites this paper as [19]
Experimental — accuracy not yet measuredThe source backs part of the claim, not all of it — or backs it for a different population, condition or comparison.
In the citing paper
“In summary, when lipid metabolism is imbalanced, elevated levels of RC can lead to its infiltration into the arterial wall, causing cholesterol deposition beneath the endothelium and accelerating the formation of foam cells and lipid plaques, while provoking a low-grade inflammatory response. These processes significantly increase the risk of AS.”
From Remnant cholesterol, lipid ratios, and the severity of coronary artery lesions: a retrospective cohort study in patients with coronary heart disease (2025) · cites this paper as [16]
Experimental — accuracy not yet measuredThe source backs part of the claim, not all of it — or backs it for a different population, condition or comparison.
In the citing paper
“Observational cohorts demonstrate that higher TG and remnant cholesterol predict cardiovascular events independently of LDL-C, while Mendelian randomization analyses confirm a causal relationship between lifelong TRL elevation and ASCVD.”
From Targeting triglycerides for cardiovascular risk reduction (2026) · cites this paper as [56]
Experimental — accuracy not yet measuredThe cited source says what the claim attributes to it.
In the citing paper
“Thus, RC may have a stronger atherogenic effect than LDL-C.”
From Remnant cholesterol, lipid ratios, and the severity of coronary artery lesions: a retrospective cohort study in patients with coronary heart disease (2025) · cites this paper as [16]
The cited source says what the claim attributes to it.
In the citing paper
“triglyceride-rich lipoproteins are thought to be at least as atherogenic as LDL cholesterol on a perparticle basis. 19,21”
From Targeting APOC3 with Olezarsen in Moderate Hypertriglyceridemia (2025) · cites this paper as [19]
Self-check
Percentages, sums and reported differences re-computed from the paper’s own numbers.
The self-check needs the paper’s full text.
Citations
Cites
Sudlow, C., Gallacher, J., Allen, N., Beral, V., Burton, P., Danesh, J., Downey, P., Elliott, P., Green, J., Landray, M., et al. (2015) · PLOS Medicine · doi:10.1371/journal.pmed.1001779 · Cited by 12,728
Interpreting findings from Mendelian randomization using the MR-Egger method.
Burgess, S., & Thompson, S. G. (2017) · European Journal of Epidemiology · doi:10.1007/s10654-017-0255-x · Cited by 4,571 · cited 2×
“The possible impact of pleiotropic effects (SNP variants influencing the outcome out with their effect on the exposure) was examined using the MR-Egger 19 and the MR ‘contamination mixture’ methods (see Supplementary Tables 3 and 4 for a fuller discussion).”
Self-citationWiller (2013) · doi:10.1038/ng.2797 · Cited by 2,983
Major lipids, apolipoproteins, and risk of vascular disease
The Emerging Risk Factors Collaboration* (2009) · JAMA · doi:10.1001/jama.2009.1619 · Cited by 2,731
Guidelines for performing Mendelian randomization investigations
Burgess, S., Smith, G. D., Davies, N. M., Dudbridge, F., Gill, D., Glymour, M. M., Hartwig, F. P., Holmes, M. V., Minelli, C., Relton, C. L., et al. (2019) · Wellcome Open Research · doi:10.12688/wellcomeopenres.15555.1 · Cited by 1,828
Self-citationBorén, J., Chapman, M. J., Krauss, R. M., Packard, C. J., Bentzon, J. F., Binder, C. J., Daemen, M. J., Demer, L. L., Hegele, R. A., Nicholls, S. J., et al. (2020) · European Heart Journal · doi:10.1093/eurheartj/ehz962 · Cited by 1,601 · cited 2×
“29, 30 Remnant particles contain more cholesterol per apoB and so if the ‘atherogenicity’ of TRL/remnant-C is higher than LDL-C then this implies that the per-particle (per apoB) impact on atherosclerotic processes must be even greater.”
Self-citationTriglycerides and cardiovascular disease
Nordestgaard, B. G., & Varbo, A. (2014) · The Lancet · doi:10.1016/s0140-6736(14)61177-6 · Cited by 1,419 · cited 4×
“27, 28, 1, 2, 11, 29 The key question that arises from the present and earlier investigations is what is the basis of a remnant particle’s enhanced atherogenicity?”
InfluentialTabas, I., Williams, K. J., & Borén, J. (2007) · Circulation · doi:10.1161/circulationaha.106.676890 · Cited by 1,399
Self-citationGuidelines for performing Mendelian randomization investigations
Burgess, S., Davey Smith, G., Davies, N. M., Dudbridge, F., Gill, D., Glymour, M. M., Hartwig, F. P., Holmes, M. V., Minelli, C., Relton, C. L., et al. (2020) · Wellcome Open Research · doi:10.12688/wellcomeopenres.15555.2 · Cited by 1,273 · cited 4×
“21 It is worthwhile noting that the two SNP clusters were defined empirically based on the observed effect size for apoB relative to TRL/remnant-C rather than any preconception as to which SNPs/genes should be grouped together based on their role in lipid metabolism or their relationship to ASCVD…”
InfluentialSelf-citationChapman, M. J., Ginsberg, H. N., Amarenco, P., Andreotti, F., Borén, J., Catapano, A. L., Descamps, O. S., Fisher, E., Kovanen, P. T., Kuivenhoven, J. A., et al. (2011) · European Heart Journal · doi:10.1093/eurheartj/ehr112 · Cited by 1,227 · cited 2×
“27, 28, 1, 2, 11, 29 The key question that arises from the present and earlier investigations is what is the basis of a remnant particle’s enhanced atherogenicity?”
Self-citation
Cited by
Sorted by citations
Zodasiran, an RNAi Therapeutic Targeting ANGPTL3, for Mixed Hyperlipidemia
Rosenson, R. S., Gaudet, D., Hegele, R. A., Ballantyne, C. M., Nicholls, S. J., Lucas, K. J., San Martin, J., Zhou, R., Muhsin, M., Chang, T., et al. (2024) · New England Journal of Medicine · doi:10.1056/nejmoa2404147 · Cited by 213
Plozasiran, an RNA Interference Agent Targeting APOC3, for Mixed Hyperlipidemia
Ballantyne, C. M., Vasas, S., Azizad, M., Clifton, P., Rosenson, R. S., Chang, T., Melquist, S., Zhou, R., Mushin, M., Leeper, N. J., et al. (2024) · New England Journal of Medicine · doi:10.1056/nejmoa2404143 · Cited by 210
Olezarsen for Hypertriglyceridemia in Patients at High Cardiovascular Risk
Bergmark, B. A., Marston, N. A., Prohaska, T. A., Alexander, V. J., Zimerman, A., Moura, F. A., Murphy, S. A., Goodrich, E. L., Zhang, S., Gaudet, D., et al. (2024) · New England Journal of Medicine · doi:10.1056/nejmoa2402309 · Cited by 214
Plozasiran (ARO-APOC3) for Severe Hypertriglyceridemia
Gaudet, D., Pall, D., Watts, G. F., Nicholls, S. J., Rosenson, R. S., Modesto, K., San Martin, J., Hellawell, J., & Ballantyne, C. M. (2024) · JAMA Cardiology · doi:10.1001/jamacardio.2024.0959 · Cited by 172
Triglyceride-glucose index (TyG) as a novel biomarker in the era of cardiometabolic medicine
Арманович, А. А., Вачиковна, П. Н., Fogacci, F., Aghajanova, E., Jndoyan, Z., Patoulias, D., Sasso, L. L., Bernardi, M., Faggiano, A., Mohammadifard, N., et al. (2024) · International Journal of Cardiology · doi:10.1016/j.ijcard.2024.132663 · Cited by 115
Metadata
- Authors
- Björnson, E., Adiels, M., Taskinen, M.-R., Burgess, S., Rawshani, A., Borén, J., & Packard, C. J.
- Affiliations
- Sahlgrenska University Hospital (SE)
- University of Helsinki (FI)
- University of Cambridge (GB)
- University of Glasgow (GB)
- Corresponding author
- Borén, Jan
- ORCID
- Venue
- European Heart Journal
- Publisher
- Oxford University Press (OUP)
- Published
- 2023-06-26
- Volume
- 44
- Issue
- 39
- Pages
- 4186-4195
- ISSN
- 0195-668X (ISSN-L)
- 1522-9645
- PMC
- PMC10576615
- OpenAlex
- W4382011883
- Cited by
- 183
- References
- 28
- Citations by year
- 2026: 47 · 2025: 76 · 2024: 50 · 2023: 9
- FWCI
- 48.59
- Type
- journal article
- Language
- en
- Open access
- hybrid
- doi.org
- Licence
- Locations
- European Heart Journal (publishedVersion, cc-by-nc)
- PubMed Central (publishedVersion, cc-by-nc)
- PubMed (publishedVersion)
- Apollo (University of Cambridge) (submittedVersion, cc-by-nc)
- Informationszentrum Lebenswissenschaften (ZB MED) (submittedVersion, cc-by-nc)
- Työväentutkimus Vuosikirja (submittedVersion)
- Funders
- Swedish Research Council
- Swedish Heart–Lung Foundation (ALFGBG-965404)
- Sigrid Juselius Foundation
- Finnish Foundation for Cardiovascular Research
- Wellcome Trust and the Royal Society (204623/Z/16/Z)
- United Kingdom Research and Innovation Medical Research Council (MC_UU_00002/7)
- National Institute for Health Research Cambridge Biomedical Research Centre (BRC-1215-20014)
- National Institute for Health Research
- Department of Health and Social Care
- Topics
- Health Sciences › Medicine › Cardiology and Cardiovascular Medicine › Lipoproteins and Cardiovascular Health
- Health Sciences › Medicine › Cardiology and Cardiovascular Medicine › Lipid metabolism and disorders
- Life Sciences › Biochemistry, Genetics and Molecular Biology › Genetics › Genetic Associations and Epidemiology
- Keywords
- remnant cholesterol, LDL cholesterol, coronary heart disease risk, apolipoprotein B, atherogenicity, lipoprotein particle size, lipolysis, single nucleotide polymorphisms, polygenic risk score, Mendelian randomization
- MeSH terms
- Apolipoproteins B, Cholesterol, Coronary Disease, United Kingdom, Humans, Lipoproteins, Cholesterol, LDL, Triglycerides, Biological Specimen Banks
About these checks
Registry, retraction, Cites and statistics results are computed, not judged, with one exception: a printed reference that no index lists is read once by a model before it counts as a citation error. Claims are extracted by a model and kept only when their quote appears verbatim in the text; each cited source is then checked, with a model’s help, for whether it says what the claim relies on. Those verdicts can be wrong — read the claim’s quote and the cited source before relying on one.
Statistics and arithmetic are recomputed, not judged.
Confidence bands are shown only for fields calibrated on our annotated test set. None is calibrated yet, so no band is shown.
What counts as a claim ›How we measure confidence ›How we check this ›
Are you an author, or do you see a problem with this page? Request a review
