

The DOI matches its Crossref record; 57 of the 57 references it cites were found in a registry or an index.
The Tree and Net Components of Prokaryote Evolution
Open accessAbstract
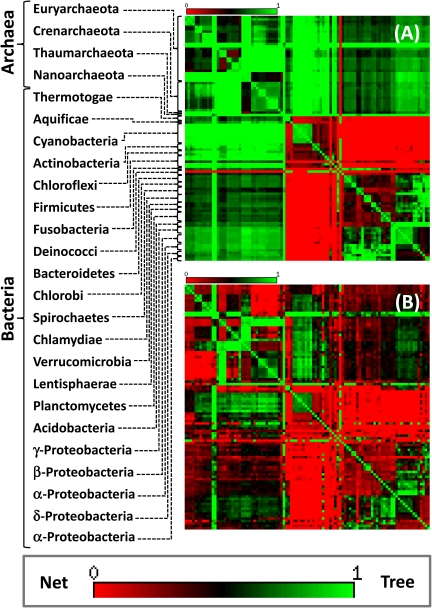
Phylogenetic trees of individual genes of prokaryotes (archaea and bacteria) generally have different topologies, largely owing to extensive horizontal gene transfer (HGT), suggesting that the Tree of Life (TOL) should be replaced by a "net of life" as the paradigm of prokaryote evolution. However, trees remain the natural representation of the histories of individual genes given the fundamentally bifurcating process of gene replication. Therefore, although no single tree can fully represent the evolution of prokaryote genomes, the complete picture of evolution will necessarily combine trees and nets. A quantitative measure of the signals of tree and net evolution is derived from an analysis of all quartets of species in all trees of the "Forest of Life" (FOL), which consists of approximately 7,000 phylogenetic trees for prokaryote genes including approximately 100 nearly universal trees (NUTs). Although diverse routes of net-like evolution collectively dominate the FOL, the pattern of tree-like evolution that reflects the consistent topologies of the NUTs is the most prominent coherent trend. We show that the contributions of tree-like and net-like evolutionary processes substantially differ across bacterial and archaeal lineages and between functional classes of genes. Evolutionary simulations indicate that the central tree-like signal cannot be realistically explained by a self-reinforcing pattern of biased HGT.
Overview
The claims and statistics of this paper haven’t been checked yet.
Free: it reads the open-access text and checks the first 5 claims that cite a source we can check. Create a free account to check every claim.
Integrity signals
Registry
Cites
Statistics
Figures



Verification
Claims the paper makes
The claims and statistics of this paper haven’t been checked yet.
Free: it reads the open-access text and checks the first 5 claims that cite a source we can check. Create a free account to check every claim.
Claims other papers make about this one
Each is checked against this paper’s own text: does it say what the citing paper says it does?
The source backs part of the claim, not all of it — or backs it for a different population, condition or comparison.
In the citing paper
“Recent theoretical, comparative genomic and experimental research on microbial evolution clearly indicates that HGT is the principal factor in microbial adaptation and innovation (46, 65, 66, 80).”
From Origin and Evolution of the Universal Genetic Code (2017) · cites this paper as [66]
Experimental — accuracy not yet measured
Self-check
Percentages, sums and reported differences re-computed from the paper’s own numbers.
The self-check needs the paper’s full text.
Citations
Cites
MUSCLE: multiple sequence alignment with high accuracy and high throughput
Edgar, R. C. (2004) · Nucleic Acids Research · doi:10.1093/nar/gkh340 · Cited by 44,662
Towards a natural system of organisms: proposal for the domains Archaea, Bacteria, and Eucarya.
Woese, C. R., Kandler, O., & Wheelis, M. L. (1990) · Proceedings of the National Academy of Sciences · doi:10.1073/pnas.87.12.4576 · Cited by 6,128
Talavera, G., & Castresana, J. (2007) · Systematic Biology · doi:10.1080/10635150701472164 · Cited by 5,631
Woese, C. R. (1987) · Microbiological Reviews · doi:10.1128/mr.51.2.221-271.1987 · Cited by 5,042 · cited 1×
“…of ribosomal RNA (rRNA) that was subsequently buttressed by trees of other universal genes, such as ribosomal proteins and core RNA polymerase subunits, is perceived as a veritable triumph of tree thinking in biology (Woese 1987; Woese et al. 1990; Pace 1997; Ciccarelli et al. 2006; Pace 2006).”
BackgroundThe COG database: an updated version includes eukaryotes
Tatusov, R. L., Fedorova, N. D., Jackson, J. D., Jacobs, A. R., Kiryutin, B., Koonin, E. V., Krylov, D. M., Mazumder, R., Mekhedov, S. L., Nikolskaya, A. N., et al. (2003) · BMC Bioinformatics · doi:10.1186/1471-2105-4-41 · Cited by 4,430
Self-citationA Genomic Perspective on Protein Families
Tatusov, R. L., Koonin, E. V., & Lipman, D. J. (1997) · Science · doi:10.1126/science.278.5338.631 · Cited by 3,590
Self-citationA Molecular View of Microbial Diversity and the Biosphere
Pace, N. R. (1997) · Science · doi:10.1126/science.276.5313.734 · Cited by 2,746
Phylogenetic Classification and the Universal Tree
Doolittle, W. F. (1999) · Science · doi:10.1126/science.284.5423.2124 · Cited by 1,888
Toward Automatic Reconstruction of a Highly Resolved Tree of Life
Ciccarelli, F. D., Doerks, T., von Mering, C., Creevey, C. J., Snel, B., & Bork, P. (2006) · Science · doi:10.1126/science.1123061 · Cited by 1,663
Phylogenomics and the reconstruction of the tree of life
Delsuc, F., Brinkmann, H., & Philippe, H. (2005) · Nature Reviews Genetics · doi:10.1038/nrg1603 · Cited by 1,236
Research works printed but not linked: 1
- Darwin, 1859, On the origin of species
Cited by
Genomics and taxonomy in diagnostics for food security: soft-rotting enterobacterial plant pathogens
Pritchard, L., Glover, R. H., Humphris, S., Elphinstone, J. G., & Toth, I. K. (2016) · Analytical Methods · doi:10.1039/c5ay02550h · Cited by 1,579
Pathways for horizontal gene transfer in bacteria revealed by a global map of their plasmids
Redondo-Salvo, S., Fernández-López, R., Ruiz, R., Vielva, L., de Toro, M., Rocha, E. P. C., Garcillán-Barcia, M. P., & de la Cruz, F. (2020) · Nature Communications · doi:10.1038/s41467-020-17278-2 · Cited by 433
Gene transfer agents: phage-like elements of genetic exchange
Lang, A. S., Zhaxybayeva, O., & Beatty, J. T. (2012) · Nature Reviews Microbiology · doi:10.1038/nrmicro2802 · Cited by 416
A rooted phylogeny resolves early bacterial evolution
Coleman, G. A., Davín, A. A., Mahendrarajah, T. A., Szánthó, L. L., Spang, A., Hugenholtz, P., Szöllősi, G. J., & Williams, T. A. (2021) · Science · doi:10.1126/science.abe0511 · Cited by 285
Genomes in turmoil: quantification of genome dynamics in prokaryote supergenomes
Puigbò, P., Lobkovsky, A. E., Kristensen, D. M., Wolf, Y. I., & Koonin, E. V. (2014) · BMC Biology · doi:10.1186/s12915-014-0066-4 · Cited by 232
Self-citation
Metadata
- Authors
- Puigbò, P., Wolf, Y. I., & Koonin, E. V.
- Affiliations
- National Institutes of Health (US)
- Corresponding author
- Koonin, Eugene V.
- Venue
- Genome Biology and Evolution
- Publisher
- Oxford University Press (OUP)
- Published
- 2010-01-01
- Volume
- 2
- Pages
- 745-756
- ISSN
- 1759-6653 (ISSN-L)
- PMC
- PMC2997564
- OpenAlex
- W2064003510
- Cited by
- 181
- References
- 57
- Citations by year
- 2025: 9 · 2024: 6 · 2023: 1 · 2022: 9 · 2021: 6 · 2020: 6 · 2019: 6 · 2018: 9 · 2017: 4 · 2016: 11 · 2015: 9 · 2014: 10 · 2013: 16 · 2012: 22
- FWCI
- 12.37
- Type
- journal article
- Language
- en
- Open access
- gold
- doi.org
- Licence
- cc-by-nc
- Locations
- Genome Biology and Evolution (publishedVersion, cc-by-nc)
- PubMed Central (publishedVersion, cc-by-nc)
- PubMed (publishedVersion)
- Funders
- U.S. Department of Health and Human Services
- National Institutes of Health
- U.S. National Library of Medicine
- Topics
- Life Sciences › Biochemistry, Genetics and Molecular Biology › Molecular Biology › Genomics and Phylogenetic Studies
- Life Sciences › Agricultural and Biological Sciences › Ecology, Evolution, Behavior and Systematics › Protist diversity and phylogeny
- Physical Sciences › Environmental Science › Ecology › Microbial Community Ecology and Physiology
- Keywords
- prokaryote evolution, horizontal gene transfer, phylogenetic tree, phylogenetic networks, tree of life, gene family evolution, archaea, bacteria, gene replication, evolutionary simulation
- MeSH terms
- Computer Simulation, Biological Evolution, Phylogeny, Prokaryotic Cells, Evolution, Molecular
About these checks
Registry, retraction, Cites and statistics results are computed, not judged, with one exception: a printed reference that no index lists is read once by a model before it counts as a citation error. Claims are extracted by a model and kept only when their quote appears verbatim in the text; each cited source is then checked, with a model’s help, for whether it says what the claim relies on. Those verdicts can be wrong — read the claim’s quote and the cited source before relying on one.
Statistics and arithmetic are recomputed, not judged.
Confidence bands are shown only for fields calibrated on our annotated test set. None is calibrated yet, so no band is shown.
What counts as a claim ›How we measure confidence ›How we check this ›
Are you an author, or do you see a problem with this page? Request a review
How to cite
Cite CoChat for the checks on this page, and the paper for its own findings.
- This page
- CoChat. (2026). Citation check: The Tree and Net Components of Prokaryote Evolution. https://app.cochat.ai/papers/10.1093/gbe/evq062
- The paper
- Puigbò, P., Wolf, Y. I., & Koonin, E. V. (2010). The Tree and Net Components of Prokaryote Evolution. Genome Biology and Evolution. https://doi.org/10.1093/gbe/evq062
Data sources
Bibliographic data: Semantic Scholar, OpenAlex, Crossref.
Contains information from the Semantic Scholar Academic Graph Datasets, made available under the ODC Attribution License (ODC-BY 1.0).
Semantic Scholar’s data is described in: Kinney, R., et al. (2023). The Semantic Scholar Open Data Platform. arXiv:2301.10140.
