

The DOI matches its Crossref record; 86 of the 86 references it cites were found in a registry or an index.
Evidence for Deep Regulatory Similarities in Early Developmental Programs across Highly Diverged Insects
Abstract
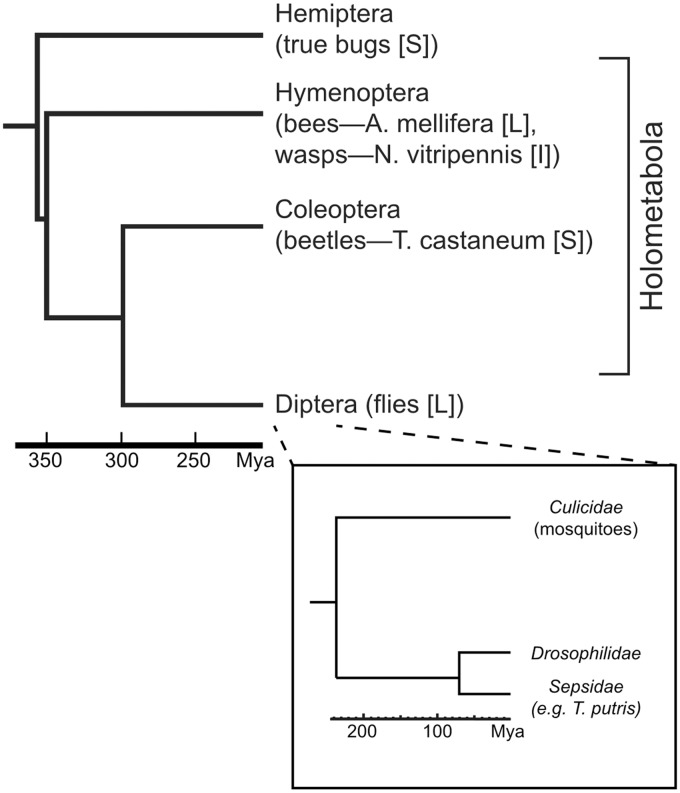
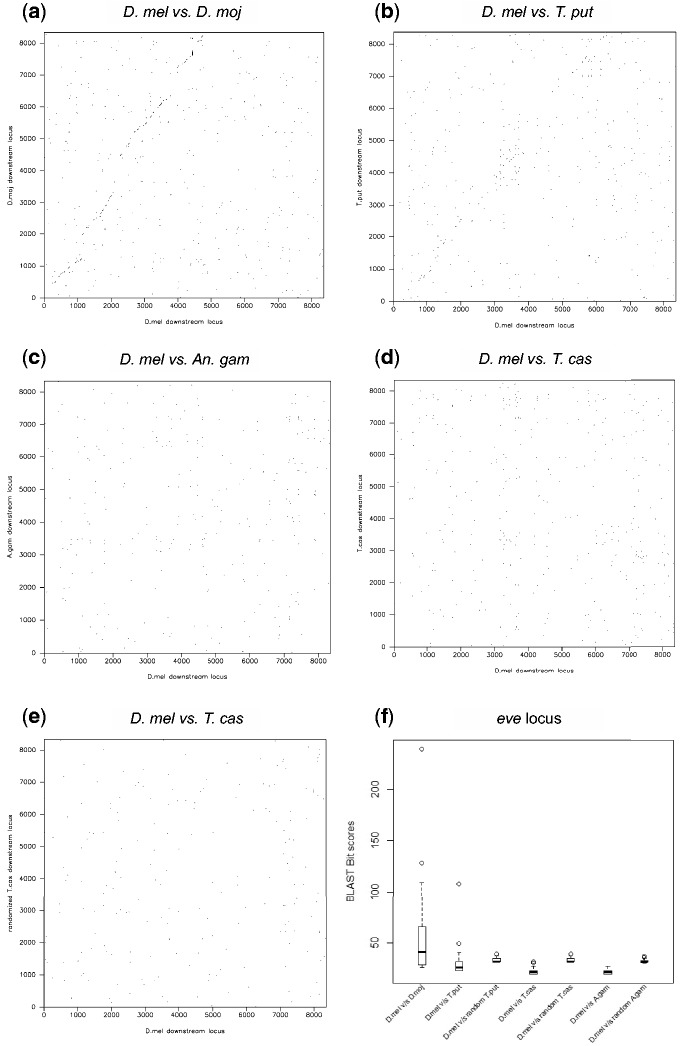
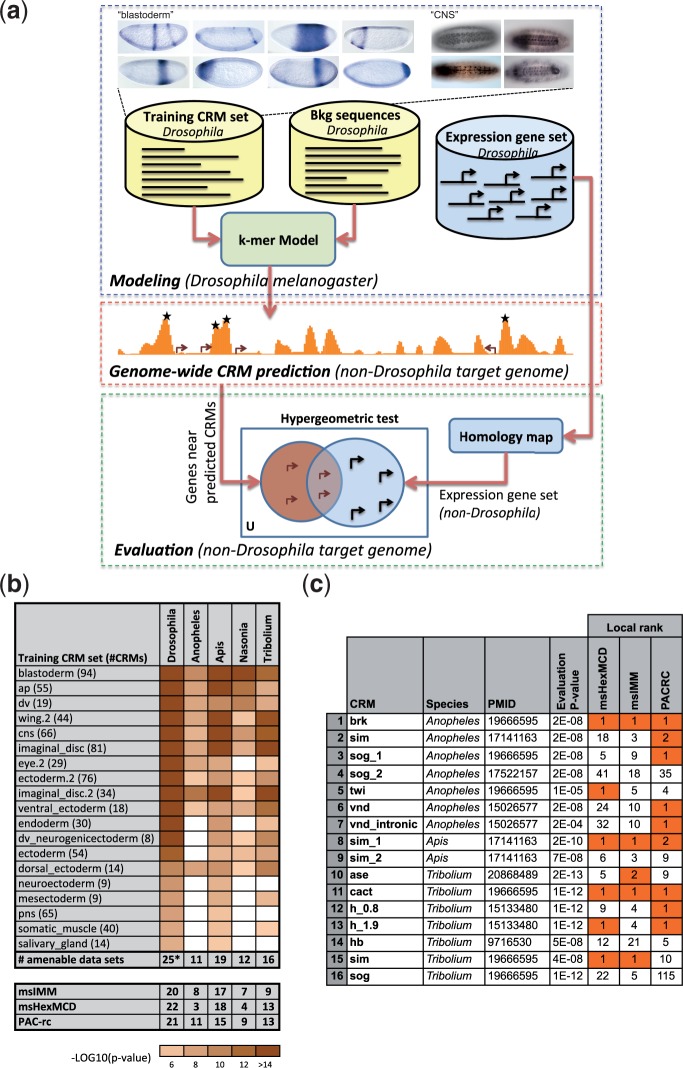
Many genes familiar from Drosophila development, such as the so-called gap, pair-rule, and segment polarity genes, play important roles in the development of other insects and in many cases appear to be deployed in a similar fashion, despite the fact that Drosophila-like "long germband" development is highly derived and confined to a subset of insect families. Whether or not these similarities extend to the regulatory level is unknown. Identification of regulatory regions beyond the well-studied Drosophila has been challenging as even within the Diptera (flies, including mosquitoes) regulatory sequences have diverged past the point of recognition by standard alignment methods. Here, we demonstrate that methods we previously developed for computational cis-regulatory module (CRM) discovery in Drosophila can be used effectively in highly diverged (250-350 Myr) insect species including Anopheles gambiae, Tribolium castaneum, Apis mellifera, and Nasonia vitripennis. In Drosophila, we have successfully used small sets of known CRMs as "training data" to guide the search for other CRMs with related function. We show here that although species-specific CRM training data do not exist, training sets from Drosophila can facilitate CRM discovery in diverged insects. We validate in vivo over a dozen new CRMs, roughly doubling the number of known CRMs in the four non-Drosophila species. Given the growing wealth of Drosophila CRM annotation, these results suggest that extensive regulatory sequence annotation will be possible in newly sequenced insects without recourse to costly and labor-intensive genome-scale experiments. We develop a new method, Regulus, which computes a probabilistic score of similarity based on binding site composition (despite the absence of nucleotide-level sequence alignment), and demonstrate similarity between functionally related CRMs from orthologous loci. Our work represents an important step toward being able to trace the evolutionary history of gene regulatory networks and defining the mechanisms underlying insect evolution.
Overview
The claims and statistics of this paper haven’t been checked yet.
Run the check — free, no account needed. It reads the open-access text and checks the sources it cites.
Integrity signals
Registry
Cites
Statistics
Figures
Verification
Claims the paper makes
The claims and statistics of this paper haven’t been checked yet.
Run the check — free, no account needed. It reads the open-access text and checks the sources it cites.
Claims other papers make about this one
Each is checked against this paper’s own text: does it say what the citing paper says it does?
In the citing paper
“dGRNs have provided a systems-level construct at which similarities of developmental regulation emerge across great evolutionary spans despite extensive sequence-level divergence (39, 40).”
From Behavior-related gene regulatory networks: A new level of organization in the brain (2020) · cites this paper as [39]
Self-check
Percentages, sums and reported differences re-computed from the paper’s own numbers.
The self-check needs the paper’s full text.
Citations
Cites
EMBOSS: the European molecular biology open software suite.
Rice, P., Longden, I., & Bleasby, A. (2000) · Trends in Genetics · doi:10.1016/s0168-9525(00)02024-2 · Cited by 9,466
BLAST: a more efficient report with usability improvements
Boratyn, G. M., Camacho, C., Cooper, P. S., Coulouris, G., Fong, A., Ma, N., Madden, T. L., Matten, W. T., McGinnis, S. D., Merezhuk, Y., et al. (2013) · Nucleic Acids Research · doi:10.1093/nar/gkt282 · Cited by 1,369
Genome-Wide Quantitative Enhancer Activity Maps Identified by STARR-seq
Arnold, C. D., Gerlach, D., Stelzer, C., Boryń, Ł. M., Rath, M., & Stark, A. (2013) · Science · doi:10.1126/science.1232542 · Cited by 1,125
Microbial gene identification using interpolated Markov models
Salzberg, S. L., Delcher, A. L., Kasif, S., & White, O. R. (1998) · Nucleic Acids Research · doi:10.1093/nar/26.2.544 · Cited by 989
Episodic radiations in the fly tree of life
Wiegmann, B. M., Trautwein, M. D., Winkler, I. S., Barr, N. B., Kim, J.-W., Lambkin, C., Bertone, M. A., Cassel, B. K., Bayless, K. M., Heimberg, A. M., et al. (2011) · Proceedings of the National Academy of Sciences · doi:10.1073/pnas.1012675108 · Cited by 936
Improved pairwise alignment of genomic dna
Harris, R. S. (2007) · Cited by 890
Unlocking the secrets of the genome
modENCODE Consortium, Celniker, S. E., Dillon, L. A. L., Gerstein, M. B., Gunsalus, K. C., Henikoff, S., Karpen, G. H., Kellis, M., Lai, E. C., Lieb, J. D., et al. (2009) · Nature · doi:10.1038/459927a · Cited by 781
InParanoid 7: new algorithms and tools for eukaryotic orthology analysis
Ostlund, G., Schmitt, T., Forslund, K., Kostler, T., Messina, D. N., Roopra, S., Frings, O., & Sonnhammer, E. L. L. (2010) · Nucleic Acids Research · doi:10.1093/nar/gkp931 · Cited by 623
Phenotypic robustness conferred by apparently redundant transcriptional enhancers
Frankel, N., Davis, G. K., Vargas, D., Wang, S., Payre, F., & Stern, D. L. (2010) · Nature · doi:10.1038/nature09158 · Cited by 510
Shadow enhancers as a source of evolutionary novelty
Hong, J.-W., Hendrix, D. A., & Levine, M. S. (2008) · Science · doi:10.1126/science.1160631 · Cited by 474
Cited by
Behavior-related gene regulatory networks: A new level of organization in the brain
Sinha, S., Jones, B. M., Traniello, I. M., Bukhari, S. A., Halfon, M. S., Hofmann, H. A., Huang, S., Katz, P. S., Keagy, J., Lynch, V. J., et al. (2020) · Proceedings of the National Academy of Sciences · doi:10.1073/pnas.1921625117 · Cited by 85
Self-citationCross‐species systems analysis of evolutionary toolkits of neurogenomic response to social challenge
Saul, M. C., Blatti, C., Yang, W., Bukhari, S. A., Shpigler, H. Y., Troy, J. M., Seward, C. H., Sloofman, L., Chandrasekaran, S., Bell, A. M., et al. (2019) · Genes, Brain and Behavior · doi:10.1111/gbb.12502 · Cited by 38
Self-citation
Metadata
- Authors
- Kazemian, M., Suryamohan, K., Chen, J.-Y., Zhang, Y., Samee, M. A. H., Halfon, M. S., & Sinha, S.
- Venue
- Genome Biology and Evolution
- Publisher
- Oxford University Press (OUP)
- Published
- 2014-08-29
- Volume
- 6
- Issue
- 9
- Pages
- 2301-2320
- ISSN
- 1759-6653
- PMC
- PMC4217690
- Cited by
- 42
- References
- 86
- Language
- en
About these checks
Registry, retraction, Cites and statistics results are computed, not judged, with one exception: a printed reference that no index lists is read once by a model before it counts as a citation error. Claims are extracted by a model and kept only when their quote appears verbatim in the text; each cited source is then checked, with a model’s help, for whether it says what the claim relies on. Those verdicts can be wrong — read the claim’s quote and the cited source before relying on one.
Statistics and arithmetic are recomputed, not judged.
Confidence bands are shown only for fields calibrated on our annotated test set. None is calibrated yet, so no band is shown.
What counts as a claim ›How we measure confidence ›How we check this ›
Are you an author, or do you see a problem with this page? Request a review
Data sources
Bibliographic data: Semantic Scholar, OpenAlex, Crossref.
Contains information from the Semantic Scholar Academic Graph Datasets, made available under the ODC Attribution License (ODC-BY 1.0).
Semantic Scholar’s data is described in: Kinney, R., et al. (2023). The Semantic Scholar Open Data Platform. arXiv:2301.10140.
