

The DOI matches its Crossref record; 9 of the 9 references it cites were found in a registry or an index.
Obesity, starch digestion and amylase: association between copy number variants at human salivary (AMY1) and pancreatic (AMY2) amylase genes
Overview
The claims and statistics of this paper haven’t been checked yet.
Run the check — free, no account needed. It reads the open-access text and checks the sources it cites.
Integrity signals
Registry
Cites
Statistics
Figures
Verification
Claims the paper makes
The claims and statistics of this paper haven’t been checked yet.
Run the check — free, no account needed. It reads the open-access text and checks the sources it cites.
Claims other papers make about this one
Each is checked against this paper’s own text: does it say what the citing paper says it does?
In the citing paper
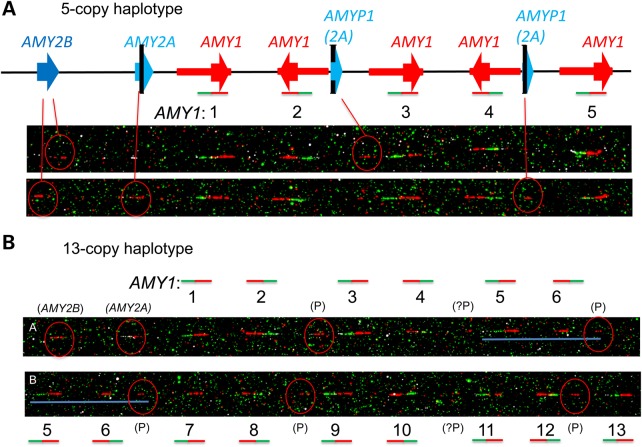
“To validate the computational callsets, we used: aCGH; alkaline lysis fibre-FISH, following the protocol of Perry, et al.42; and molecular combing fibre-FISH, following Polley et al.43, Carpenter et al.44, and instructions from the manufacturer, Genomic Vision.”
From Punctuated bursts in human male demography inferred from 1,244 worldwide Y-chromosome sequences (2016) · cites this paper as [44]
Self-check
Percentages, sums and reported differences re-computed from the paper’s own numbers.
The self-check needs the paper’s full text.
Citations
Cites
An integrated map of genetic variation from 1,092 human genomes
The 1000 Genomes Project Consortium (2012) · Nature · doi:10.1038/nature11632 · Cited by 7,711
Detection of large-scale variation in the human genome
Iafrate, A. J., Feuk, L., Rivera, M. N., Listewnik, M. L., Donahoe, P. K., Qi, Y., Scherer, S. W., & Lee, C. (2004) · Nature Genetics · doi:10.1038/ng1416 · Cited by 2,892
Origins and functional impact of copy number variation in the human genome
The Wellcome Trust Case Control Consortium, Conrad, D. F., Pinto, D., Redon, R., Feuk, L., Gokcumen, O., Zhang, Y., Aerts, J., Andrews, T. D., Barnes, C., et al. (2010) · Nature · doi:10.1038/nature08516 · Cited by 1,970
Ancient human genomes suggest three ancestral populations for present-day Europeans
Lazaridis, I., Patterson, N., Mittnik, A., Renaud, G., Mallick, S., Kirsanow, K., Sudmant, P. H., Schraiber, J. G., Castellano, S., Lipson, M., et al. (2014) · Nature · doi:10.1038/nature13673 · Cited by 1,357
Self-citationThe genomic signature of dog domestication reveals adaptation to a starch-rich diet
Axelsson, E., Ratnakumar, A., Arendt, M.-L., Maqbool, K., Webster, M. T., Perloski, M., Liberg, O., Arnemo, J. M., Hedhammar, Å., & Lindblad-Toh, K. (2013) · Nature · doi:10.1038/nature11837 · Cited by 963
The Wellcome Trust Case Control Consortium (2010) · Nature · doi:10.1038/nature08979 · Cited by 807
Derived immune and ancestral pigmentation alleles in a 7,000-year-old Mesolithic European
Olalde, I., Allentoft, M. E., Sánchez-Quinto, F., Santpere, G., Chiang, C. W. K., DeGiorgio, M., Prado-Martinez, J., Rodríguez, J. A., Rasmussen, S., Quilez, J., et al. (2014) · Nature · doi:10.1038/nature12960 · Cited by 360
Low copy number of the salivary amylase gene predisposes to obesity
Falchi, M., El-Sayed Moustafa, J. S., Takousis, P., Pesce, F., Bonnefond, A., Andersson-Assarsson, J. C., Sudmant, P. H., Dorajoo, R., Al-Shafai, M. N., Bottolo, L., et al. (2014) · Nature Genetics · doi:10.1038/ng.2939 · Cited by 254
Gribble, S. M., Wiseman, F. K., Clayton, S., Prigmore, E., Langley, E., Yang, F., Maguire, S., Fu, B., Rajan, D., Sheppard, O., et al. (2013) · PLoS ONE · doi:10.1371/journal.pone.0060482 · Cited by 102
Self-citation
Research works printed but not linked: 25
- 2006, PNAS, 103, 8006, 10.1073/pnas.0602318103 · DOI
- Sudmant, 2010, Science, 330, 641, 10.1126/science.1197005 · DOI · Paper page
- Groot, 1989, Genomics, 5, 29, 10.1016/0888-7543(89)90083-9 · DOI
- Pronk, 1979, Human heredity, 29, 181, 10.1159/000153038 · DOI
- Pronk, 1982, Human genetics, 60, 32, 10.1007/BF00281260 · DOI
- Groot, 1991, Genomics, 10, 779, 10.1016/0888-7543(91)90463-O · DOI
- Groot, 1990, Genomics, 8, 97, 10.1016/0888-7543(90)90230-R · DOI
- Bank, 1992, Human genetics, 89, 213, 10.1007/BF00217126 · DOI
- Perry, 2007, Nature genetics, 39, 1256, 10.1038/ng2123 · DOI
- 2013, 7, 61
- 2007, Nucleic Acids Research, 35, e19, 10.1093/nar/gkl1089 · DOI
- Samuelson, 1996, Molecular Biology and Evolution, 13, 767, 10.1093/oxfordjournals.molbev.a025637 · DOI
- Brock, 1988, Clinical Chemistry, 34, 1516, 10.1093/clinchem/34.7.1516 · DOI
- Sjolund, 1991, Gut, 32, 546, 10.1136/gut.32.5.546 · DOI
- Groot, 1989, Gene, 85, 567, 10.1016/0378-1119(89)90454-X · DOI
- Carpenter, 2011, BMC genomics [electronic resource], 12, 418, 10.1186/1471-2164-12-418 · DOI
- 2010, Human Molecular Genetics, 19, 4930, 10.1093/hmg/ddq411 · DOI
- Walker, 2009, Genomics, 93, 98, 10.1016/j.ygeno.2008.09.004 · DOI
- 2015, Nature genetics, 47, 296, 10.1038/ng.3200 · DOI · Paper page
- Field, 2009, Nature medicine, 15, 1115, 10.1038/nm1009-1115 · DOI
- 2013, Human mutation, 34, 1, 10.1002/humu.22172 · DOI
- Veal, 2012, BMC genomics [electronic resource], 13, 455, 10.1186/1471-2164-13-455 · DOI
- Fellermann, 2006, American journal of human genetics, 79, 439, 10.1086/505915 · DOI
- Bentley, 2010, The American journal of gastroenterology, 105, 354, 10.1038/ajg.2009.582 · DOI
- Michalet, 1997, Science, 277, 1518, 10.1126/science.277.5331.1518 · DOI
Cited by
Personalized nutrition by prediction of glycemic responses
Zeevi, D., Korem, T., Zmora, N., Israeli, D., Rothschild, D., Weinberger, A., Ben-Yacov, O., Lador, D., Avnit-Sagi, T., Lotan-Pompan, M., et al. (2015) · Cell · doi:10.1016/j.cell.2015.11.001 · Cited by 2,929
Genetic determinants of the gut microbiome in UK twins
Goodrich, J. K., Davenport, E. R., Beaumont, M., Jackson, M. A., Knight, R., Ober, C., Spector, T. D., Bell, J. T., Clark, A. G., & Ley, R. E. (2016) · Cell Host & Microbe · doi:10.1016/j.chom.2016.04.017 · Cited by 1,048
Punctuated bursts in human male demography inferred from 1,244 worldwide Y-chromosome sequences
The 1000 Genomes Project Consortium, Poznik, G. D., Xue, Y., Mendez, F. L., Willems, T. F., Massaia, A., Wilson Sayres, M. A., Ayub, Q., McCarthy, S. A., Narechania, A., et al. (2016) · Nature Genetics · doi:10.1038/ng.3559 · Cited by 331
Self-citation
Metadata
- Authors
- Carpenter, D., Dhar, S., Mitchell, L. M., Fu, B., Tyson, J., Shwan, N. A. A., Yang, F., Thomas, M. G., & Armour, J. A. L.
- Venue
- Human Molecular Genetics
- Publisher
- Oxford University Press (OUP)
- Published
- 2015-03-18
- Volume
- 24
- Issue
- 12
- Pages
- 3472-3480
- ISSN
- 0964-6906
- 1460-2083
- PMC
- PMC4498156
- Cited by
- 128
- References
- 9
- Language
- en
About these checks
Registry, retraction, Cites and statistics results are computed, not judged, with one exception: a printed reference that no index lists is read once by a model before it counts as a citation error. Claims are extracted by a model and kept only when their quote appears verbatim in the text; each cited source is then checked, with a model’s help, for whether it says what the claim relies on. Those verdicts can be wrong — read the claim’s quote and the cited source before relying on one.
Statistics and arithmetic are recomputed, not judged.
Confidence bands are shown only for fields calibrated on our annotated test set. None is calibrated yet, so no band is shown.
What counts as a claim ›How we measure confidence ›How we check this ›
Are you an author, or do you see a problem with this page? Request a review
How to cite
Cite CoChat for the checks on this page, and the paper for its own findings.
- This page
- CoChat. (2026). Citation check: Obesity, starch digestion and amylase: association between copy number variants at human salivary (AMY1) and pancreatic (AMY2) amylase genes. https://app.cochat.ai/papers/10.1093/hmg/ddv098
- The paper
- Carpenter, D., Dhar, S., Mitchell, L. M., Fu, B., Tyson, J., Shwan, N. A. A., Yang, F., Thomas, M. G., & Armour, J. A. L. (2015). Obesity, starch digestion and amylase: association between copy number variants at human salivary (AMY1) and pancreatic (AMY2) amylase genes. Human Molecular Genetics. https://doi.org/10.1093/hmg/ddv098
