

Development of an artificial intelligence-based assessment model for prediction of embryo viability using static images captured by optical light microscopy during IVF
Open accessThe DOI matches its Crossref record; 21 of the 23 references it cites were found in a registry or an index.
Abstract
STUDY QUESTION: Can an artificial intelligence (AI)-based model predict human embryo viability using images captured by optical light microscopy? SUMMARY ANSWER: We have combined computer vision image processing methods and deep learning techniques to create the non-invasive Life Whisperer AI model for robust prediction of embryo viability, as measured by clinical pregnancy outcome, using single static images of Day 5 blastocysts obtained from standard optical light microscope systems. WHAT IS KNOWN ALREADY: Embryo selection following IVF is a critical factor in determining the success of ensuing pregnancy. Traditional morphokinetic grading by trained embryologists can be subjective and variable, and other complementary techniques, such as time-lapse imaging, require costly equipment and have not reliably demonstrated predictive ability for the endpoint of clinical pregnancy. AI methods are being investigated as a promising means for improving embryo selection and predicting implantation and pregnancy outcomes. STUDY DESIGN, SIZE, DURATION: These studies involved analysis of retrospectively collected data including standard optical light microscope images and clinical outcomes of 8886 embryos from 11 different IVF clinics, across three different countries, between 2011 and 2018. PARTICIPANTS/MATERIALS, SETTING, METHODS: The AI-based model was trained using static two-dimensional optical light microscope images with known clinical pregnancy outcome as measured by fetal heartbeat to provide a confidence score for prediction of pregnancy. Predictive accuracy was determined by evaluating sensitivity, specificity and overall weighted accuracy, and was visualized using histograms of the distributions of predictions. Comparison to embryologists’ predictive accuracy was performed using a binary classification approach and a 5-band ranking comparison. MAIN RESULTS AND THE ROLE OF CHANCE: The Life Whisperer AI model showed a sensitivity of 70.1% for viable embryos while maintaining a specificity of 60.5% for non-viable embryos across three independent blind test sets from different clinics. The weighted overall accuracy in each blind test set was >63%, with a combined accuracy of 64.3% across both viable and non-viable embryos, demonstrating model robustness and generalizability beyond the result expected from chance. Distributions of predictions showed clear separation of correctly and incorrectly classified embryos. Binary comparison of viable/non-viable embryo classification demonstrated an improvement of 24.7% over embryologists’ accuracy (P = 0.047, n = 2, Student’s t test), and 5-band ranking comparison demonstrated an improvement of 42.0% over embryologists (P = 0.028, n = 2, Student’s t test). LIMITATIONS, REASONS FOR CAUTION: The AI model developed here is limited to analysis of Day 5 embryos; therefore, further evaluation or modification of the model is needed to incorporate information from different time points. The endpoint described is clinical pregnancy as measured by fetal heartbeat, and this does not indicate the probability of live birth. The current investigation was performed with retrospectively collected data, and hence it will be of importance to collect data prospectively to assess real-world use of the AI model. WIDER IMPLICATIONS OF THE FINDINGS: These studies demonstrated an improved predictive ability for evaluation of embryo viability when compared with embryologists’ traditional morphokinetic grading methods. The superior accuracy of the Life Whisperer AI model could lead to improved pregnancy success rates in IVF when used in a clinical setting. It could also potentially assist in standardization of embryo selection methods across multiple clinical environments, while eliminating the need for complex time-lapse imaging equipment. Finally, the cloud-based software application used to apply the Life Whisperer AI model in clinical practice makes it broadly applicable and globally scalable to IVF clinics worldwide. STUDY FUNDING/COMPETING INTEREST(S): Life Whisperer Diagnostics, Pty Ltd is a wholly owned subsidiary of the parent company, Presagen Pty Ltd. Funding for the study was provided by Presagen with grant funding received from the South Australian Government: Research, Commercialisation and Startup Fund (RCSF). ‘In kind’ support and embryology expertise to guide algorithm development were provided by Ovation Fertility. J.M.M.H., D.P. and M.P. are co-owners of Life Whisperer and Presagen. Presagen has filed a provisional patent for the technology described in this manuscript (52985P pending). A.P.M. owns stock in Life Whisperer, and S.M.D., A.J., T.N. and A.P.M. are employees of Life Whisperer.
Overview
The claims and statistics of this paper haven’t been checked yet.
Free: it reads the open-access text and checks the first 5 claims that cite a source we can check. Create a free account to check every claim.
Integrity signals
Registry
Cites
Statistics
Figures



Verification
Claims the paper makes
The claims and statistics of this paper haven’t been checked yet.
Free: it reads the open-access text and checks the first 5 claims that cite a source we can check. Create a free account to check every claim.
Claims other papers make about this one
Each is checked against this paper’s own text: does it say what the citing paper says it does?
In the citing paper
“Beyond the analysis of disease states, CV can serve the future of human health and welfare through applications such as screening human embryos for implantation 52 .”
From Deep learning-enabled medical computer vision (2021) · cites this paper as [52]
Self-check
Percentages, sums and reported differences re-computed from the paper’s own numbers.
The self-check needs the paper’s full text.
Citations
Cites
Deep Residual Learning for Image Recognition
He, K., Zhang, X., Ren, S., & Sun, J. (2016) · 2016 IEEE Conference on Computer Vision and Pattern Recognition (CVPR) · doi:10.1109/cvpr.2016.90 · Cited by 235,474 · cited 1×
“ResNet-101 (He et al., 2016), and densely connected networks, such as DenseNet-121 and DenseNet-161 (Huang et al.”
BackgroundBreiman, L. (2001) · Machine Learning · doi:10.1023/a:1010933404324 · Cited by 133,538
Adam: A Method for Stochastic Optimization
Kingma, D. P., & Ba, J. (2014) · arXiv · doi:10.48550/arxiv.1412.6980 · Cited by 98,946
Densely Connected Convolutional Networks
Huang, G., Liu, Z., Van Der Maaten, L., & Weinberger, K. Q. (2017) · 2017 IEEE Conference on Computer Vision and Pattern Recognition (CVPR) · doi:10.1109/cvpr.2017.243 · Cited by 48,566
Learning representations by back-propagating errors
Rumelhart, D. E., Hinton, G. E., & Williams, R. J. (1986) · Nature · doi:10.1038/323533a0 · Cited by 31,892 · cited 9×
“One full-embryo DenseNet-161 model, trained using SGD with momentum = 0.9, CE loss, learning rate 1.0e-4, step-wise scheduler halving the learning rate every 5 epochs, batch size of 32, input resolution of 299 x 299, a dropout value of 0.”
MethodInfluentialHearst, M. A., Dumais, S. T., Osuna, E., Platt, J., & Scholkopf, B. (1998) · IEEE Intelligent Systems and their Applications · doi:10.1109/5254.708428 · Cited by 7,243
Inception-v4, Inception-ResNet and the Impact of Residual Connections on Learning
Szegedy, C., Ioffe, S., Vanhoucke, V., & Alemi, A. (2017) · Proceedings of the AAAI Conference on Artificial Intelligence · doi:10.1609/aaai.v31i1.11231 · Cited by 4,636
Rokach, L. (2010) · Artificial Intelligence Review · doi:10.1007/s10462-009-9124-7 · Cited by 2,657 · cited 1×
“The final prediction model was an ensemble of the highest performing individual models (Rokach, 2010).”
MethodWong, C. C., Loewke, K. E., Bossert, N. L., Behr, B., De Jonge, C. J., Baer, T. M., & Pera, R. A. R. (2010) · Nature Biotechnology · doi:10.1038/nbt.1686 · Cited by 783
Murray, C. J. L., Callender, C. S. K. H., Kulikoff, X. R., Srinivasan, V., Abate, D., Abate, K. H., Abay, S. M., Abbasi, N., Abbastabar, H., Abdela, J., et al. (2018) · The Lancet · doi:10.1016/s0140-6736(18)32278-5 · Cited by 484
Cited by
Deep learning-enabled medical computer vision
Esteva, A., Chou, K., Yeung, S., Naik, N., Madani, A., Mottaghi, A., Liu, Y., Topol, E., Dean, J., & Socher, R. (2021) · npj Digital Medicine · doi:10.1038/s41746-020-00376-2 · Cited by 1,406
Artificial intelligence in human in vitro fertilization and embryology
Zaninovic, N., & Rosenwaks, Z. (2020) · Fertility and Sterility · doi:10.1016/j.fertnstert.2020.09.157 · Cited by 196
Berntsen, J., Rimestad, J., Lassen, J. T., Tran, D., & Kragh, M. F. (2022) · PLOS ONE · doi:10.1371/journal.pone.0262661 · Cited by 161
“Some studies have measured model performance using wellknown diagnostic performance parameters such as sensitivity, specificity and accuracy [57, 58], while other studies have used AUC to measure the sorting capabilities [4, 28, 35].”
Artificial intelligence in the embryology laboratory: a review
Dimitriadis, I., Zaninović, N., Chávez-Badiola, A., & Bormann, C. L. (2021) · Reproductive BioMedicine Online · doi:10.1016/j.rbmo.2021.11.003 · Cited by 156
“, loss function and optimization methods) were considered before building their final architecture (VerMilyea et al., 2020).”
BackgroundMethodInfluentialEmbryo selection through artificial intelligence versus embryologists: a systematic review
Salih, M., Austin, C., Warty, R. R., Tiktin, C., Rolnik, D. L., Momeni, M., Rezatofighi, H., Reddy, S., Smith, V., Vollenhoven, B. J., et al. (2023) · Human Reproduction Open · doi:10.1093/hropen/hoad031 · Cited by 191
“Similarly, VerMilyea et al. (2020) scored a higher accuracy (64”
InfluentialSufriyana, H., Husnayain, A., Chen, Y.-L., Kuo, C.-Y., Singh, O., Yeh, T.-Y., Wu, Y., & Su, E. C. (2020) · JMIR Medical Informatics · doi:10.2196/16503 · Cited by 169
Embryo selection with artificial intelligence: how to evaluate and compare methods?
Kragh, M. F., & Karstoft, H. (2021) · Journal of Assisted Reproduction and Genetics · doi:10.1007/s10815-021-02254-6 · Cited by 149
“Some of these even claim statistical significant superiority over embryologists [12, 13, 20].”
BackgroundInfluentialShinde, R., Patil, S., Kotecha, K. V., Potdar, V. M., Selvachandran, G., & Abraham, A. (2023) · Transactions on Emerging Telecommunications Technologies · doi:10.1002/ett.4884 · Cited by 178
“Researchers combined computer vision approaches with deep learning neural network techniques to create a comprehensive image processing model to predict human embryo viability [87].”
BackgroundIllingworth, P. J., Venetis, C. A., Gardner, D. K., Nelson, S. M., Berntsen, J., Larman, M. G., Agresta, F., Ahitan, S., Ahlström, A., Cattrall, F. R., et al. (2024) · Nature Medicine · doi:10.1038/s41591-024-03166-5 · Cited by 139
“To date, several studies have employed deep learning algorithms for embryo quality grading or development stage classification based on static images from time-lapse incubators 8–11 .”
Fernandez, E. I., Ferreira, A. S., Cecílio, M. H. M., Chéles, D. S., de Souza, R. C. M., Nogueira, M. F. G., & Rocha, J. C. (2020) · Journal of Assisted Reproduction and Genetics · doi:10.1007/s10815-020-01881-9 · Cited by 137
Medenica, S., Živanović, D., Batkoska, L., Marinelli, S., Basile, G., Perino, A., Cucinella, G., Gullo, G., & Zaami, S. (2022) · Diagnostics · doi:10.3390/diagnostics12122979 · Cited by 138
“So, the usage of this type of AI found its application in determining the morphokinetic parameters of the embryos that are most optimal [30], determining cost effectiveness in human oocyte cryopreservation [31], predicting IVF and ICSI outcomes, and classification of sperm cells [32].”
MethodDiakiw, S. M., Hall, J. M. M., VerMilyea, M. D., Amin, J., Aizpurúa, J., Giardini, L., Briones, Y. G., Lim, A. Y. X., Dakka, M. A., Nguyen, T., et al. (2022) · Human Reproduction · doi:10.1093/humrep/deac131 · Cited by 101
“The previous method used for pad-ding in VerMilyea et al. (2020) was replaced with a Region Based Convolutional Neural Network (R-CNN) deep learning model called Faster R-CNN, which is known to be robust to background artifacts in the image (Ren et al. , 2015).”
InfluentialSelf-citationMachine learning for sperm selection
You, J. B., McCallum, C., Wang, Y., Riordon, J., Nosrati, R., & Sinton, D. A. (2021) · Nature Reviews Urology · doi:10.1038/s41585-021-00465-1 · Cited by 111
Liao, Q., Zhang, Q., Feng, X., Huang, H., Xu, H., Tian, B., Liu, J., Yu, Q., Guo, N., Liu, Q., et al. (2021) · Communications Biology · doi:10.1038/s42003-021-01937-1 · Cited by 111
Artificial intelligence in the fertility clinic: status, pitfalls and possibilities
Riegler, M. A., Stensen, M. H., Witczak, O., Andersen, J. M., Hicks, S. A., Hammer, H. L., Delbarre, E., Halvorsen, P., Yazidi, A., Holst, N., et al. (2021) · Human Reproduction · doi:10.1093/humrep/deab168 · Cited by 93
Development and validation of deep learning based embryo selection across multiple days of transfer
Lassen, J. T., Kragh, M. F., Rimestad, J., Johansen, M. B., & Berntsen, J. (2023) · Scientific Reports · doi:10.1038/s41598-023-31136-3 · Cited by 87
“These are methods that have only been trained on transferred embryos and therefore generally have not seen embryos of poor quality [4, 5, 6].”
BackgroundMethodJiang, V. S., & Bormann, C. L. (2023) · Fertility and Sterility · doi:10.1016/j.fertnstert.2023.05.149 · Cited by 84
Advances in the study of the correlation between insulin resistance and infertility
Lei, R., Chen, S., & Li, W. (2024) · Frontiers in Endocrinology · doi:10.3389/fendo.2024.1288326 · Cited by 96
Nguyen, T. V., Dakka, M. A., Diakiw, S. M., VerMilyea, M. D., Perugini, M., Hall, J. M. M., & Perugini, D. (2022) · Scientific Reports · doi:10.1038/s41598-022-12833-x · Cited by 77
“In considering a medical dataset, we focused on the problem of assessing the viability of embryos in the IVF sector, using an existing algorithm called Life Whisperer Viability—a commercial in-market ML application for embryo selection 7 .”
MethodSelf-citationBasic of machine learning and deep learning in imaging for medical physicists
Manco, L., Maffei, N., Strolin, S., Vichi, S., Bottazzi, L., & Strigari, L. (2021) · Physica Medica · doi:10.1016/j.ejmp.2021.03.026 · Cited by 83
“In the Embryology field, AI/Deep learning methods were used for the robust selection for prediction of embryo viability [56,57].”
MethodLoewke, K. E., Cho, H., Brumar, C. D., Maeder-York, P., Barash, O. O., Malmsten, J. E., Zaninović, N., Sakkas, D., Miller, K. A., Levy, M. L., et al. (2022) · Fertility and Sterility · doi:10.1016/j.fertnstert.2021.11.022 · Cited by 71
Self-citationAutomation in ART: Paving the Way for the Future of Infertility Treatment
Abdullah, K. A. L., Atazhanova, T., Chávez-Badiola, A., & Shivhare, S. B. (2022) · Reproductive Sciences · doi:10.1007/s43032-022-00941-y · Cited by 83
“, UK) and Life Whisperer© (Presagen, Australia), both computer-based softwares, provide deep learning platforms using static images of embryos, requiring no costly equipment, making its clinical application most affordable and flexible [61, 62].”
BackgroundAhlström, A., Lundin, K., Lind, A., Gunnarsson, K., Westlander, G., Hannah, P., Thurin‐Kjellberg, A., Thorsteinsdottir, S. A., Einarsson, S., Åström, M., et al. (2022) · Human Reproduction · doi:10.1093/humrep/deac020 · Cited by 68
“Future hopes now lie invested in the use of artificial intelligence technologies to interpret the full scope of TL images and identify key features that have been missed or not quantified in current models and without manual annotations (Tran et al., 2019; VerMilyea et al., 2020).”
Ueno, S., Berntsen, J., Ito, M., Uchiyama, K., Okimura, T., Yabuuchi, A., & Kato, K. (2021) · Fertility and Sterility · doi:10.1016/j.fertnstert.2021.06.001 · Cited by 66
Diakiw, S. M., Hall, J. M. M., VerMilyea, M. D., Lim, A. Y. X., Quangkananurug, W., Chanchamroen, S., Bankowski, B. J., Stones, R. E., Storr, A., Miller, A. C., et al. (2022) · Reproductive BioMedicine Online · doi:10.1016/j.rbmo.2022.07.018 · Cited by 72
Self-citationLouis, C. M., Erwin, A., Handayani, N., Polim, A. A., Boediono, A., & Sini, I. R. (2021) · Journal of Assisted Reproduction and Genetics · doi:10.1007/s10815-021-02123-2 · Cited by 69
“Kragh [58], VerMilyea [54], Bormann [61] and Kanakasabapathy [55] employed a function pipeline which incorporated at least one CNN based function among others.”
BackgroundMethodInfluentialA brief history of artificial intelligence embryo selection: from black-box to glass-box
Lee, T., Natalwala, J., Chapple, V., & Liu, Y. (2023) · Human Reproduction · doi:10.1093/humrep/dead254 · Cited by 71
Application of artificial intelligence to the diagnosis and therapy of colorectal cancer.
Wang, Y., He, X., Nie, H., Zhou, J., Cao, P., & Ou, C. (2020) · PubMed · Cited by 80
Fordham, D. E., Rosentraub, D., Polsky, A. L., Aviram, T., Wolf, Y., Perl, O., Devir, A., Rosentraub, S., Silver, D. H., Zamir, Y. G., et al. (2022) · Human Reproduction · doi:10.1093/humrep/deac171 · Cited by 55
Human Oocyte Morphology and Outcomes of Infertility Treatment: a Systematic Review
Nikiforov, D., Grøndahl, M. L., Hreinsson, J. G., & Andersen, C. Y. (2021) · Reproductive Sciences · doi:10.1007/s43032-021-00723-y · Cited by 60
New frontiers in embryo selection
Glatstein, I. Z., Chávez-Badiola, A., & Curchoe, C. L. (2023) · Journal of Assisted Reproduction and Genetics · doi:10.1007/s10815-022-02708-5 · Cited by 52
Artificial intelligence for life sciences: A comprehensive guide and future trends
Luo, M., Yang, W., Bai, L., Zhang, L., Huang, J., Cao, Y.-H., Xie, Y., Tong, L., Zhang, H., Lei, Y., et al. (2024) · The Innovation Life · doi:10.59717/j.xinn-life.2024.100105 · Cited by 61
Current Advancements in Noninvasive Profiling of the Embryo Culture Media Secretome
Zmuidinaite, R., Sharara, F. I., & Iles, R. K. (2021) · International Journal of Molecular Sciences · doi:10.3390/ijms22052513 · Cited by 54
Enatsu, N., Miyatsuka, I., An, L. M., Inubushi, M., Enatsu, K., Otsuki, J., Iwasaki, T., Kokeguchi, S., & Shiotani, M. (2022) · Reproductive Medicine and Biology · doi:10.1002/rmb2.12443 · Cited by 54
“9,11 Since there are lots of variables that affect pregnancy, including uterine condition, hormonal status, and complications besides infertility, the theoretical accuracy of predicting clinical pregnancy is estimated to be 80%.”
BackgroundMethodInfluentialDuval, A., Nogueira, D., Gidel-Dissler, N., Filali, M. M., Matos, F. D., Chansel‐Debordeaux, L., Ferrer-Buitrago, M., Ferrer, E., Antequera, V., Ruíz-Jorro, M., et al. (2023) · Human Reproduction · doi:10.1093/humrep/dead023 · Cited by 47
“In contrast, a more objective approach consists of training models that either analyze a single image (VerMilyea et al. , 2020) or the entire embryonic development (Tran et al. , 2019; Berntsen et al. , 2022; Lassen et al. , 2022) using pregnancy outcome as a label.”
Precision medicine and artificial intelligence: overview and relevance to reproductive medicine
Hajirasouliha, I., & Elemento, O. (2020) · Fertility and Sterility · doi:10.1016/j.fertnstert.2020.09.156 · Cited by 46
Coticchio, G., Fiorentino, G., Nicora, G., Sciajno, R., Cavalera, F., Bellazzi, R., Garagna, S., Borini, A., & Zuccotti, M. (2020) · Reproductive BioMedicine Online · doi:10.1016/j.rbmo.2020.12.008 · Cited by 41
Automated Evaluation of Human Embryo Blastulation and Implantation Potential using Deep‐Learning
Kan‐Tor, Y., Zabari, N., Erlich, I., Szeskin, A., Amitai, T., Richter, D., Or, Y., Shoham, Z., Hurwitz, A., Har‐Vardi, I., et al. (2020) · Advanced Intelligent Systems · doi:10.1002/aisy.202000080 · Cited by 35
Amitai, T., Kan‐Tor, Y., Or, Y., Shoham, Z., Shofaro, Y., Richter, D., Har‐Vardi, I., Ben‐Meir, A., Srebnik, N., & Buxboim, A. (2022) · Journal of Assisted Reproduction and Genetics · doi:10.1007/s10815-022-02619-5 · Cited by 36
“This AUC value is comparable with the prediction accuracy of other reported algorithms, including CNN-based classification models of embryo implantation outcome [20, 22].”
Yaseen, I., & Rather, R. A. (2024) · International Journal of Women s Health · doi:10.2147/ijwh.s454127 · Cited by 54
“43,44 These early detections can significantly influence maternal and fetal health outcomes.”
BackgroundLiu, H., Zhang, Z., Gu, Y., Dai, C., Shan, G., Song, H., Li, D., Chen, W., Lin, G., & Sun, Y. (2023) · eLife · doi:10.7554/elife.83662 · Cited by 42
Yuan, Z., Yuan, M., Song, X., Huang, X., & Yan, W. (2023) · Scientific Reports · doi:10.1038/s41598-023-29319-z · Cited by 35
A hybrid feature fusion deep learning framework for multi-source medical image analysis
Cao, Q., & Cheng, X. S. (2024) · Information Processing & Management · doi:10.1016/j.ipm.2024.103934 · Cited by 40
Shah, J. S., Venturas, M., Sanchez, T. H., Penzias, A. S., Needleman, D. J., & Sakkas, D. (2022) · Human Reproduction · doi:10.1093/humrep/deac016 · Cited by 34
Ueno, S., Berntsen, J., Ito, M., Okimura, T., & Kato, K. (2022) · Journal of Assisted Reproduction and Genetics · doi:10.1007/s10815-022-02562-5 · Cited by 34
Cheredath, A., Uppangala, S., Asha, C. S., Jijo, A., Vani Lakshmi, R., Kumar, P., Joseph, D. M., Gowda, G. A. N., Kalthur, G., & Adiga, S. K. (2022) · Reproductive Sciences · doi:10.1007/s43032-022-01071-1 · Cited by 33
Barrie, A., McDowell, G., & Troup, S. A. (2021) · Fertility and Sterility · doi:10.1016/j.fertnstert.2020.10.037 · Cited by 32
Letterie, G. S. (2021) · Journal of Assisted Reproduction and Genetics · doi:10.1007/s10815-021-02159-4 · Cited by 43
Goss, D. M., Vasilescu, S. A., Vasilescu, P. A., Cooke, S., Kim, S. H., Sacks, G. P., Gardner, D. K., & Warkiani, M. E. (2024) · Reproductive BioMedicine Online · doi:10.1016/j.rbmo.2024.103910 · Cited by 36
Data-Driven Medicine in the Diagnosis and Treatment of Infertility
de Santiago, I., & Polański, Ł. (2022) · Journal of Clinical Medicine · doi:10.3390/jcm11216426 · Cited by 33
Infertility Treatment Now and in the Future
Doody, K. J. (2021) · Obstetrics and Gynecology Clinics of North America · doi:10.1016/j.ogc.2021.07.005 · Cited by 44
Automated detection of poor-quality data: case studies in healthcare
Dakka, M. A., Nguyen, T., Hall, J. M. M., Diakiw, S. M., VerMilyea, M. D., Linke, R. J., Perugini, M., & Perugini, D. (2021) · Scientific Reports · doi:10.1038/s41598-021-97341-0 · Cited by 35
Self-citationA classification system of day 3 human embryos using deep learning
Wu, C., Yan, W., Li, H., Li, J., Wang, H., Chang, S., Yu, T., Jin, Y., Ma, C., Luo, Y., et al. (2021) · Biomedical Signal Processing and Control · doi:10.1016/j.bspc.2021.102943 · Cited by 29
Artificial intelligence—the future is now
Trolice, M. P., Curchoe, C. L., & Quaas, A. M. (2021) · Journal of Assisted Reproduction and Genetics · doi:10.1007/s10815-021-02272-4 · Cited by 36
Multifactor Prediction of Embryo Transfer Outcomes Based on a Machine Learning Algorithm
Liu, R., Bai, S., Jiang, X., Luo, L., Tong, X., Zheng, S., Wang, Y., & Xu, B. (2021) · Frontiers in Endocrinology · doi:10.3389/fendo.2021.745039 · Cited by 30
“established the life whisper AI model which can improve the ability of predicting embryo viability compared with the traditional embryo grading method (19).”
MethodChen, L., Li, W., Liu, Y., Peng, Z., Cai, L., Zhang, N., Xu, J., Wang, L., Teng, X., Yao, Y., et al. (2022) · Reproductive BioMedicine Online · doi:10.1016/j.rbmo.2022.03.006 · Cited by 27
Yang, L., Peavey, M. C., Kaskar, K., Chappell, N. R., Zhu, L., Devlin, D. J., Valdés, C. T., Schutt, A. K., Woodard, T. L., Zarutskie, P. W., et al. (2022) · F&S Reports · doi:10.1016/j.xfre.2022.04.004 · Cited by 29
Predicting Embryo Viability Based on Self-Supervised Alignment of Time-Lapse Videos
Kragh, M. F., Rimestad, J., Lassen, J. T., Berntsen, J., & Karstoft, H. (2021) · IEEE Transactions on Medical Imaging · doi:10.1109/tmi.2021.3116986 · Cited by 33
Sfakianoudis, K., Maziotis, E., Grigoriadis, S., Pantou, A., Kokkini, G., Trypidi, A., Giannelou, P., Zikopoulos, A., Angeli, I., Vaxevanoglou, T., et al. (2022) · Biomedicines · doi:10.3390/biomedicines10030697 · Cited by 34
“Several AI-based prediction models have been developed, documenting successful identification of embryos with the highest implantation potential [21,22].”
BackgroundMethodInfluentialIsa, I. S., Yusof, U. K., & Zain, M. M. (2023) · Applied Sciences · doi:10.3390/app13021195 · Cited by 35
Understanding and Assisting Reproduction in Wildlife Species Using Microfluidics
Gac, S. L., Ferraz, M. D. A. M. M., Venzac, B., & Comizzoli, P. (2020) · Trends in biotechnology · doi:10.1016/j.tibtech.2020.08.012 · Cited by 25
Lee, C., Huang, C., Lee, T., Chen, H.-H., Cheng, E., Lin, P., Yu, T.-N., Chen, C.-I., Chen, C.-H., & Lee, M. (2024) · Reproductive Biology and Endocrinology · doi:10.1186/s12958-024-01185-y · Cited by 25
“These AI algorithms, which are derived from deep-learning techniques, have been developed to fully automate embryo assessments and eliminate the bias associated with manual evaluation [9–17].”
MethodRotem, O., Schwartz, T., Maor, R., Tauber, Y., Shapiro, M. T., Meseguer, M., Gilboa, D., Seidman, D. S., & Zaritsky, A. (2024) · Nature Communications · doi:10.1038/s41467-024-51136-9 · Cited by 37
“This approach of applying a segmentation to mask background regions before training a classi fi cation CNN was used by others in the domain medical imaging 98,99 , speci fi cally in the context of IVF 100 – 102 .”
Revolutionizing Sperm Analysis with AI: A Review of Computer-Aided Sperm Analysis Systems
Baldán, F. J., García‐Gil, D., & Fernandez‐Basso, C. (2025) · Computation · doi:10.3390/computation13060132 · Cited by 24
Kim, J., Lee, J., & Jun, J. H. (2022) · Daehan saengsik uihak hoeji/Clinical and experimental reproductive medicine · doi:10.5653/cerm.2022.05575 · Cited by 24
“Another AI-based model, termed Life Whisperer (LW), was developed by assessing the images of 8,886 embryos from 11 IVF clinics and provided time-saving and higher accuracy for successful pregnancy [56].”
MethodBovine embryo production in vitro: evolution of culture media and commercial perspectives
Krisher, R. L., & Herrick, J. R. (2024) · Animal Reproduction · doi:10.1590/1984-3143-ar2024-0051 · Cited by 23
Miyagi, Y., Habara, T., Hirata, R., & Hayashi, N. (2020) · Artificial Intelligence in Medical Imaging · doi:10.35711/aimi.v1.i3.94 · Cited by 26
Barrie, A., Smith, R., Campbell, A., & Fishel, S. B. (2021) · Human Reproduction · doi:10.1093/humrep/deab209 · Cited by 22
Buldo-Licciardi, J., Large, M. J., McCulloh, D. H., McCaffrey, C., & GRIFO, J. A. (2023) · Journal of Assisted Reproduction and Genetics · doi:10.1007/s10815-022-02695-7 · Cited by 22
“The accuracy of machine learning in predicting embryo growth [9] or implantation potential [10] remains too low for clinical use, with accuracies and AUCs in the 0.”
BackgroundFruchter-Goldmeier, Y., Kantor, B., Ben‐Meir, A., Wainstock, T., Erlich, I., Levitas, E., Shufaro, Y., Sapir, O., & Har‐Vardi, I. (2023) · Scientific Reports · doi:10.1038/s41598-023-40923-x · Cited by 22
The Role of Artificial Intelligence and Machine Learning in Assisted Reproductive Technologies
Jiang, V. S., Pavlovic, Z. J., & Hariton, E. (2023) · Obstetrics and Gynecology Clinics of North America · doi:10.1016/j.ogc.2023.09.003 · Cited by 24
Microfluidic chip as a promising evaluation method in assisted reproduction: A systematic review
Wu, T., Wu, Y., Yan, J., Zhang, J., & Wang, S. (2023) · Bioengineering & Translational Medicine · doi:10.1002/btm2.10625 · Cited by 23
“147 Still, applying AI systems and microfluidic technology to analyze the cell stage and corresponding division intervals presents a challenge.”
MethodPavlovic, Z. J., Jiang, V. S., & Hariton, E. (2024) · Current Opinion in Obstetrics & Gynecology · doi:10.1097/gco.0000000000000951 · Cited by 25
Artificial Intelligence: A Review of Progress and Prospects in Medicine and Healthcare
Mishra, S. (2022) · Journal of Electronics Electromedical Engineering and Medical Informatics · doi:10.35882/jeeemi.v4i1.1 · Cited by 33
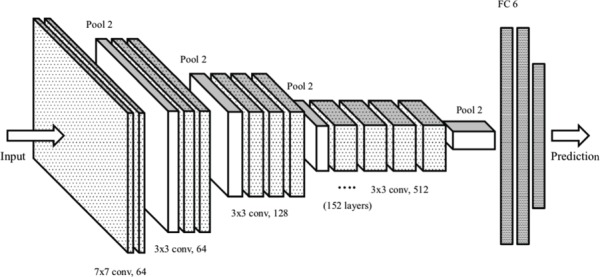
“, [160] design an ensemble comprising of 8 different models created using ResNet-152 and DenseNet-161 to predict the embryo viability during IVF using images of embryos extracted on Day 5 of culture.”
MethodAssisted Reproductive Technology: A Ray of Hope for Infertility
Tenchov, R., & Zhou, Q. A. (2025) · ACS Omega · doi:10.1021/acsomega.5c01643 · Cited by 33
Oocyte quality evaluation: a review of engineering approaches toward clinical challenges
Palay, P., Fathi, D., & Fathi, R. (2022) · Biology of Reproduction · doi:10.1093/biolre/ioac219 · Cited by 20
Application of artificial intelligence in gametes and embryos selection
Si, K., Huang, B., & Jin, L. (2023) · Human Fertility · doi:10.1080/14647273.2023.2256980 · Cited by 20
Kim, H., Kang, H. D., Lee, C., Park, J. H., Chung, M. K., Kim, M., Kim, N. Y., & Lee, H. J. (2024) · Journal of Medical Internet Research · doi:10.2196/52637 · Cited by 19
“Previous studies have predominantly focused on comparing the embryologists’ independent assessments with AI-only evaluations [12,13].”
BackgroundResultInfluentialAssessment of embryo implantation potential with a cloud-based automatic software
Alegre, L., Gallego, R. D., Bori, L., Loewke, K. E., Maddah, M., Aparicio‐Ruiz, B., Palma-Govea, A., Marcos, J., & Meseguer, M. (2020) · Reproductive BioMedicine Online · doi:10.1016/j.rbmo.2020.09.032 · Cited by 19
Unique Deep Radiomic Signature Shows NMN Treatment Reverses Morphology of Oocytes from Aged Mice
Habibalahi, A., Bertoldo, M. J., Mahbub, S. B., Campbell, J. M., Goss, D. M., Ledger, W. J., Gilchrist, R. B., Wu, L. E., & Goldys, E. M. (2022) · Biomedicines · doi:10.3390/biomedicines10071544 · Cited by 19
Parra, A., Denkova, D., Burgos-Artizzu, X. P., Aroca, E., Casals, M., Godeau, A. L., Ares, M. A., Ferrer‐Vaquer, A., Massafret, O., Oliver‐Vila, I., et al. (2024) · Proceedings of the National Academy of Sciences · doi:10.1073/pnas.2315043121 · Cited by 19
Tartia, A. P., Wu, C. Q., Gale, J., Shmorgun, D., & Léveillé, M.-C. (2022) · Reproductive BioMedicine Online · doi:10.1016/j.rbmo.2022.03.019 · Cited by 18
Artificial intelligence in human reproduction: charting the ethical debate over AI in IVF
Tamir, S. (2022) · AI and Ethics · doi:10.1007/s43681-022-00216-x · Cited by 29
“…embryo evaluation and selection process presently performed by embryologists, using methods such as morphokinetic grading and time-lapse imaging [45], is not only similarly opaque for IVF patients as that of AI(i)IVF's methodology, but also equally inexplainable, as would be the inner workings…”
MethodBlastAssist: a deep learning pipeline to measure interpretable features of human embryos
Yang, H. Y., Leahy, B., Jang, W.-D., Wei, D., Kalma, Y., Rahav, R., Carmon, A., Kopel, R., Azem, F., Venturas, M., et al. (2024) · Human Reproduction · doi:10.1093/humrep/deae024 · Cited by 18
Salih, M., Austin, C., Mantravadi, K., Seow, E., Jitanantawittaya, S., Reddy, S., Vollenhoven, B. J., Rezatofighi, H., & Horta, F. (2025) · Scientific Reports · doi:10.1038/s41598-025-02076-x · Cited by 25
“As most currently proposed AI systems only use embryo images 13,42–47 , the boosted performance of the fusion model presented in this study demonstrated a significant value of including the patients’ clinical data in the model to predict clinical outcomes.”
Predicting the likelihood of live birth: an objective and user-friendly blastocyst grading system
Pons, M. C., Carrasco, B., Rives, N., Delgado, A., Martínez‐Moro, Á., Martínez-Granados, L., Rodríguez, I., Cairó, O., & Cuevas, I. (2023) · Reproductive BioMedicine Online · doi:10.1016/j.rbmo.2023.05.015 · Cited by 16
Wang, S., Chen, L., & Sun, H. (2023) · Reproductive BioMedicine Online · doi:10.1016/j.rbmo.2023.103371 · Cited by 19
Canosa, S., Licheri, N., Bergandi, L., Gennarelli, G., Paschero, C., Beccuti, M., Cimadomo, D., Coticchio, G., Rienzi, L. F., Benedetto, C., et al. (2024) · Journal of Ovarian Research · doi:10.1186/s13048-024-01376-6 · Cited by 18
“In another study, the prediction accuracy of embryo assessment performed by experienced embryologists with morphokinetic grading methods added to conventional static morphology was shown to range between 60% and 70%, with AUC = 0.63–0.70 [ 44].”
MethodInfluentialEmbryo ploidy status classification through computer-assisted morphology assessment
Danardono, G. B., Handayani, N., Louis, C. M., Polim, A. A., Sirait, B. I., Periastiningrum, G., Afadlal, S., Boediono, A., & Sini, I. R. (2023) · AJOG Global Reports · doi:10.1016/j.xagr.2023.100209 · Cited by 16
“Masking and padding: Masking and padding were applied to the original image with the threshold image as the mask parameter, which would be used to segment the embryo images.(23)”
MethodChávez-Badiola, A., Farias, A. F.-S., Mendizabal‐Ruiz, G., Silvestri, G., Griffin, D. K., Valencia-Murillo, R., Drakeley, A., & Cohen, J. (2024) · Reproductive BioMedicine Online · doi:10.1016/j.rbmo.2024.103934 · Cited by 17
EVATOM: an optical, label-free, machine learning assisted embryo health assessment tool
Goswami, N., Winston, N. J., Choi, W., Lai, N. Z. E., Arcanjo, R. B., Chen, X., Sobh, N., Nowak, R. A., Anastasio, M. A., & Popescu, G. (2024) · Communications Biology · doi:10.1038/s42003-024-05960-w · Cited by 21
“Otherreports document studies with blastocyst grading algorithms incorporating ground truth data of known pregnancy outcomes, either through fetal heartbeat 54 , PGT-A 55 , or beta-hCG 55,56 based pregnancy results.”
InfluentialESHRE’s key research priorities in infertility: maximizing impact on science, people and society
Tassot, J., Ahlström, A., Capalbo, A., Cheong, Y. C., Coticchio, G., Delbaere, I., Fadler, C., Gameiro, S., Goddijn, M., Kirkman‐Brown, J., et al. (2025) · Human Reproduction · doi:10.1093/humrep/deaf150 · Cited by 14
“Preliminary research suggests AI-driven tools have the potential to outperform manual assessments and minimize operator-related subjectivity (Tran et al. , 2019; VerMilyea et al. , 2020; Theilgaard Lassen et al. , 2023; Fjeldstad et al. , 2024).”
Mina, A., Younesi, M., Doohandeh, T., Darzi, S., Ardehjani, N. A., Sheibani, S., Hosseinirad, H., & Valizadeh, R. (2025) · Contraception and Reproductive Medicine · doi:10.1186/s40834-025-00400-4 · Cited by 20
“The model showed sensitivity and specificity rates of 70.1% and 60.5%, respectively, indicating robust performance in predicting embryo viability [31].”
InfluentialFerreira, I., Simões, J., Pereira, B., Correia, J. V. M., & Areia, A. L. (2024) · Scientific Reports · doi:10.1038/s41598-024-65394-6 · Cited by 16
Onthuam, K., Charnpinyo, N., Suthicharoenpanich, K., Engphaiboon, S., Siricharoen, P., Chaichaowarat, R., & Suebthawinkul, C. (2025) · Journal of Imaging · doi:10.3390/jimaging11010013 · Cited by 16
“Vermilyea et al. [23] developed an ensemble CNN model to predict human embryo viability using a dataset of 5282 (3892 training and 390 validation images) light microscopic images of a single day 5 embryo in a pilot study to determine what techniques should be used.”
Stem Cell and Synthetic Embryo Models: Advances, Applications, and Ethical Considerations
Marei, H. E. S. (2025) · Stem Cell Reviews and Reports · doi:10.1007/s12015-025-10890-z · Cited by 19
“By allowing researchers to explore embryo viability, assess fertility therapies, and develop solutions for people dealing with infertility concerns, these models might help to enhance reproductive health [66].”
Liu, H., Chen, L., Shan, G., Sun, C., Lu, C., Liao, H., Zhang, S., Dong, S., Xu, X., Yan, Q., et al. (2025) · Human Reproduction · doi:10.1093/humrep/deaf066 · Cited by 13
Thirumalaraju, P., Kanakasabapathy, M. K., Kandula, H., Kandula, T., Katkuri, A. V. R., Cipriano, C., Malmsten, J. E., Zaninović, N., Bormann, C. L., & Shafiee, H. (2025) · Fertility and Sterility · doi:10.1016/j.fertnstert.2025.08.021 · Cited by 17
“We prioritized day 5 embryos as the majority of static image-based AI models in the literature, and nearly all those approaching commercial deployment, are trained and validated on day 5 blastocyst images (4, 5, 8, 9).”
InfluentialDeep learning system for classification of ploidy status using time-lapse videos
Payá, E., Pulgarín-Ospina, C. C., Bori, L., Colomer, A., Naranjo, V., & Meseguer, M. (2023) · F&S Science · doi:10.1016/j.xfss.2023.06.002 · Cited by 12
Criteria for implementing artificial intelligence systems in reproductive medicine
Penas, E. G. (2023) · Daehan saengsik uihak hoeji/Clinical and experimental reproductive medicine · doi:10.5653/cerm.2023.06009 · Cited by 12
Metadata
- Authors
- VerMilyea, M., Hall, J. M. M., Diakiw, S. M., Johnston, A., Nguyen, T., Perugini, D., Miller, A., Picou, A., Murphy, A. P., & Perugini, M.
- Affiliations
- Texas Fertility Center (US)
- ARC Centre for Nanoscale BioPhotonics (AU)
- Life Whisperer Diagnostics, Presagen Pty Ltd., Adelaide, SA 5000, Australia
- The University of Adelaide (AU)
- Ovation Fertility (US)
- Corresponding author
- Perugini, M
- Venue
- Human Reproduction
- Publisher
- Oxford University Press (OUP)
- Published
- 2020-04
- Volume
- 35
- Issue
- 4
- Pages
- 770-784
- ISSN
- 0268-1161 (ISSN-L)
- 1460-2350
- PMC
- PMC7192535
- OpenAlex
- W3015106848
- Cited by
- 331
- References
- 23
- Citations by year
- 2026: 47 · 2025: 59 · 2024: 72 · 2023: 49 · 2022: 49 · 2021: 38 · 2020: 16
- FWCI
- 27.61
- Type
- journal article
- Language
- en
- Open access
- hybrid
- doi.org
- Licence
- Locations
- Human Reproduction (publishedVersion, cc-by-nc)
- PubMed Central (publishedVersion, cc-by-nc)
- PubMed (publishedVersion)
- Funders
- South Australian Government: Research, Commercialisation and Startup Fund
- Topics
- Health Sciences › Medicine › Reproductive Medicine › Reproductive Biology and Fertility
- Health Sciences › Medicine › Reproductive Medicine › Reproductive Health and Technologies
- Health Sciences › Medicine › Pediatrics, Perinatology and Child Health › Assisted Reproductive Technology and Twin Pregnancy
- Keywords
- embryo viability prediction, embryo selection, in vitro fertilization, day 5 blastocyst, deep learning, computer vision, clinical pregnancy outcomes, non-invasive embryo assessment, embryo morphokinetics, implantation prediction
- MeSH terms
- Artificial Intelligence, Australia, Female, Fertilization in Vitro, Humans, Microscopy, Pregnancy, Retrospective Studies
About these checks
Registry, retraction, Cites and statistics results are computed, not judged, with one exception: a printed reference that no index lists is read once by a model before it counts as a citation error. Claims are extracted by a model and kept only when their quote appears verbatim in the text; each cited source is then checked, with a model’s help, for whether it says what the claim relies on. Those verdicts can be wrong — read the claim’s quote and the cited source before relying on one.
Statistics and arithmetic are recomputed, not judged.
Confidence bands are shown only for fields calibrated on our annotated test set. None is calibrated yet, so no band is shown.
What counts as a claim ›How we measure confidence ›How we check this ›
Are you an author, or do you see a problem with this page? Request a review
Data sources
Bibliographic data: Semantic Scholar, OpenAlex, Crossref.
Contains information from the Semantic Scholar Academic Graph Datasets, made available under the ODC Attribution License (ODC-BY 1.0).
Semantic Scholar’s data is described in: Kinney, R., et al. (2023). The Semantic Scholar Open Data Platform. arXiv:2301.10140.
