

Integrating Probability and Nonprobability Samples for Survey Inference
Open accessThe DOI matches its Crossref record; 38 of the 40 references it cites were found in a registry or an index.
Abstract
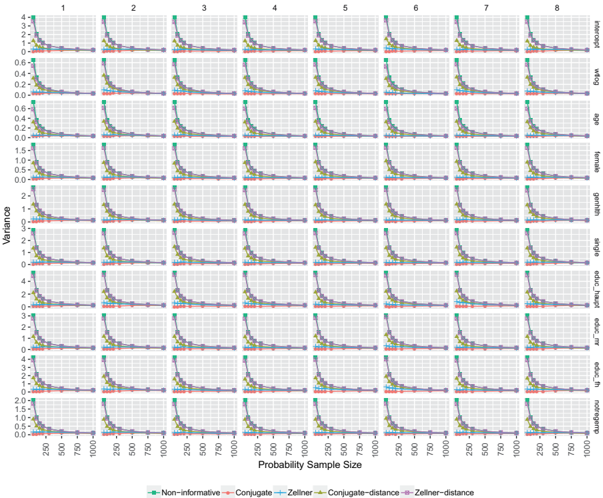
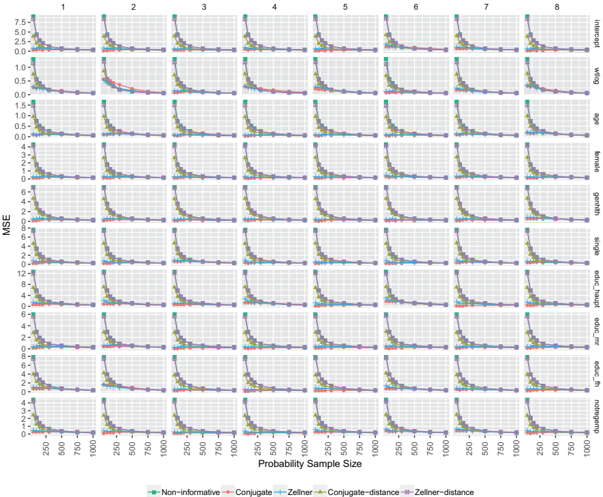
Survey data collection costs have risen to a point where many survey researchers and polling companies are abandoning large, expensive probability-based samples in favor of less expensive nonprobability samples. The empirical literature suggests this strategy may be suboptimal for multiple reasons, among them that probability samples tend to outperform nonprobability samples on accuracy when assessed against population benchmarks. However, nonprobability samples are often preferred due to convenience and costs. Instead of forgoing probability sampling entirely, we propose a method of combining both probability and nonprobability samples in a way that exploits their strengths to overcome their weaknesses within a Bayesian inferential framework. By using simulated data, we evaluate supplementing inferences based on small probability samples with prior distributions derived from nonprobability data. We demonstrate that informative priors based on nonprobability data can lead to reductions in variances and mean squared errors for linear model coefficients. The method is also illustrated with actual probability and nonprobability survey data. A discussion of these findings, their implications for survey practice, and possible research extensions are provided in conclusion.
Overview
The claims and statistics of this paper haven’t been checked yet.
Free: it reads the open-access text and checks the first 5 claims that cite a source we can check. Create a free account to check every claim.
Integrity signals
Registry
Cites
Statistics
Figures

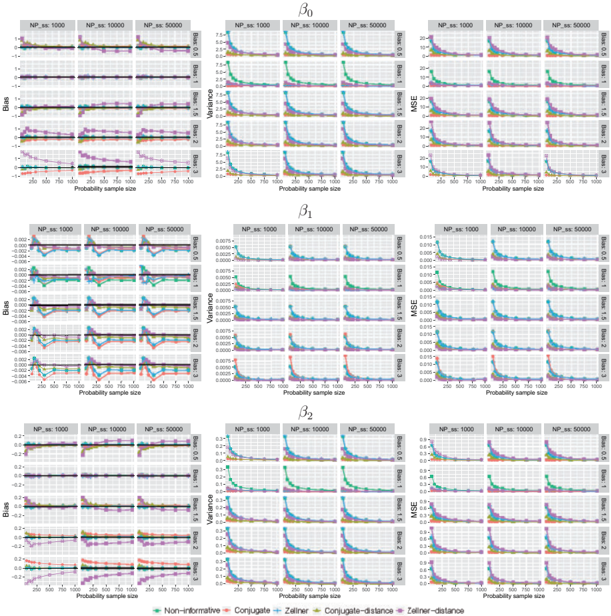
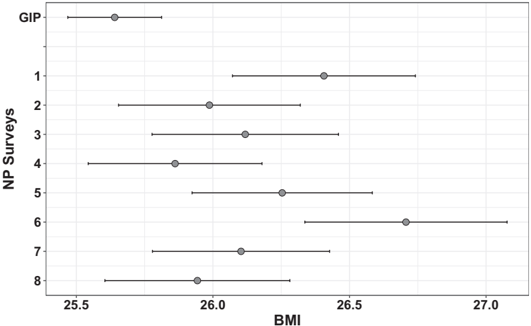
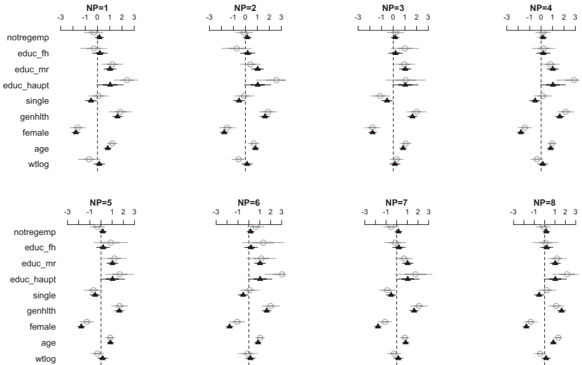


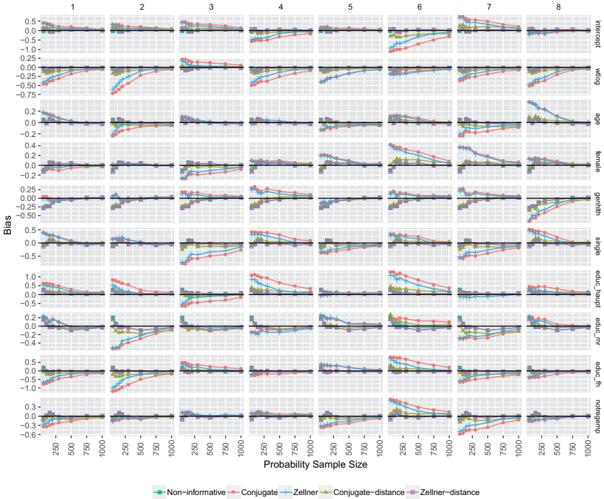
Verification
Claims the paper makes
The claims and statistics of this paper haven’t been checked yet.
Free: it reads the open-access text and checks the first 5 claims that cite a source we can check. Create a free account to check every claim.
Claims other papers make about this one
Each is checked against this paper’s own text: does it say what the citing paper says it does?
The cited source says what the claim attributes to it.
In the citing paper
“Other promising approaches include integrating surveys of varying quality 53,54 , and leveraging the estimated ddc in one outcome to correct bias in others under several scenarios”
From Unrepresentative big surveys significantly overestimated US vaccine uptake (2021) · cites this paper as [53]
Self-check
Percentages, sums and reported differences re-computed from the paper’s own numbers.
The self-check needs the paper’s full text.
Citations
Cites
Ridge regression: Biased estimation for nonorthogonal problems
Hoerl, A. E., & Kennard, R. W. (1970) · Technometrics · doi:10.1080/00401706.1970.10488634 · Cited by 9,648
An Introduction to Multivariate Statistical Analysis
Muirhead, R. J., & Anderson, T. W. (1986) · Journal of Business & Economic Statistics · doi:10.2307/1391399 · Cited by 9,082
An Introduction to Multivariate Statistical Analysis.
Skinner, C. J., & Anderson, T. W. (1985) · Journal of the Royal Statistical Society. Series A (General) · doi:10.2307/2981950 · Cited by 3,245
AN ESSAY TOWARDS SOLVING A PROBLEM IN THE DOCTRINE OF CHANCES
BAYES (1958) · Biometrika · doi:10.1093/biomet/45.3-4.296 · Cited by 2,911
An invariant form for the prior probability in estimation problems
Jeffreys, H. (1946) · Proceedings of the Royal Society of London. Series A. Mathematical and Physical Sciences · doi:10.1098/rspa.1946.0056 · Cited by 2,323
Rao, J. N. K. (2004) · Encyclopedia of Statistical Sciences · doi:10.1002/0471667196.ess0731 · Cited by 2,049
An Introduction to Bayesian Inference in Econometrics.
Sargan, J. D., & Zellner, A. (1974) · Journal of the Royal Statistical Society. Series A (General) · doi:10.2307/2344559 · Cited by 1,914
An Introduction to Bayesian Inference in Econometrics.
Aigner, D., & Zellner, A. (1972) · Journal of the American Statistical Association · doi:10.2307/2284674 · Cited by 1,653
A Reference Bayesian Test for Nested Hypotheses and its Relationship to the Schwarz Criterion
Kass, R. E., & Wasserman, L. (1995) · Journal of the American Statistical Association · doi:10.1080/01621459.1995.10476592 · Cited by 1,253
Mixtures of g Priors for Bayesian Variable Selection
Liang, F., Paulo, R., Molina, G., Clyde, M. A., & Berger, J. O. (2008) · Journal of the American Statistical Association · doi:10.1198/016214507000001337 · Cited by 1,089
Research works printed but not linked: 2
- 2016, Standard Definitions: Final Dispositions of Case Codes and Outcome Rates for Surveys
- Rubin, 1985, The Use of Propensity Scores in Applied Bayesian Inference, Bayesian Statistics, 2, 463
Cited by
Menentukan Populasi dan Sampel: Pendekatan Metodologi Penelitian Kuantitatif dan Kualitatif
Subhaktiyasa, P. G. (2024) · Jurnal Ilmiah Profesi Pendidikan · doi:10.29303/jipp.v9i4.2657 · Cited by 650
Unrepresentative big surveys significantly overestimated US vaccine uptake
Bradley, V. C., Kuriwaki, S., Isakov, M., Sejdinovic, D., Meng, X.-L., & Flaxman, S. (2021) · Nature · doi:10.1038/s41586-021-04198-4 · Cited by 248
The impact of eWOM information in social media on the online purchase intention of Generation Z
Ngo, T. T. A., Vuong, B. L., Le, M. D., Nguyen, T. T., Tran, M. M., & Nguyen, Q. K. (2024) · Cogent Business & Management · doi:10.1080/23311975.2024.2316933 · Cited by 192
Survey sampling design in wave 1 of the Global Flourishing Study
Padgett, R. N., Cowden, R. G., Chattopadhyay, M., Han, Y., Honohan, J., Ritter, Z., Srinivasan, R., Johnson, B. R., & VanderWeele, T. J. (2025) · European Journal of Epidemiology · doi:10.1007/s10654-024-01167-9 · Cited by 124
Kessler, R. C., Ruhm, C. J., Puac‐Polanco, V., Hwang, I. H., Lee, S., Petukhova, M. V., Sampson, N. A., Ziobrowski, H. N., Zaslavsky, A. M., & Zubizarreta, J. R. (2022) · JAMA Network Open · doi:10.1001/jamanetworkopen.2022.17223 · Cited by 83
Metadata
- Authors
- Wiśniowski, A., Sakshaug, J. W., Perez Ruiz, D. A., & Blom, A. G.
- Affiliations
- University of Manchester (GB)
- University of Mannheim (DE)
- Department of Mathematics, University of Manchester, Alan Turing Building, Oxford Road, Manchester M13 9PL, UK
- Corresponding author
- Wiśniowski, Arkadiusz
- Venue
- Journal of Survey Statistics and Methodology
- Publisher
- Oxford University Press (OUP)
- Published
- 2020-01-27
- Volume
- 8
- Issue
- 1
- Pages
- 120-147
- ISSN
- 2325-0984 (ISSN-L)
- 2325-0992
- OpenAlex
- W2995265274
- Cited by
- 102
- References
- 40
- Citations by year
- 2026: 17 · 2025: 23 · 2024: 16 · 2023: 20 · 2022: 18 · 2021: 5 · 2020: 3
- FWCI
- 5.07
- Type
- journal article
- Language
- en
- Open access
- hybrid
- doi.org
- Licence
- Locations
- Journal of Survey Statistics and Methodology (publishedVersion, cc-by)
- MADOC (University of Mannheim) (acceptedVersion, cc-by)
- Research Explorer (The University of Manchester) (submittedVersion, other-oa)
- Funders
- British Academy / Leverhulme Small Research (SG171279)
- German Institute for Employment Research
- German Research Foundation (SFB884-Z1, SFB884-A8)
- Topics
- Physical Sciences › Mathematics › Statistics and Probability › Survey Sampling and Estimation Techniques
- Social Sciences › Sociology and Political Science › Survey Methodology and Nonresponse
- Physical Sciences › Mathematics › Statistics and Probability › Statistical Methods and Bayesian Inference
- Keywords
- Bayesian inference, informative priors, survey cost reduction, variance reduction, mean squared error, survey inference
About these checks
Registry, retraction, Cites and statistics results are computed, not judged, with one exception: a printed reference that no index lists is read once by a model before it counts as a citation error. Claims are extracted by a model and kept only when their quote appears verbatim in the text; each cited source is then checked, with a model’s help, for whether it says what the claim relies on. Those verdicts can be wrong — read the claim’s quote and the cited source before relying on one.
Statistics and arithmetic are recomputed, not judged.
Confidence bands are shown only for fields calibrated on our annotated test set. None is calibrated yet, so no band is shown.
What counts as a claim ›How we measure confidence ›How we check this ›
Are you an author, or do you see a problem with this page? Request a review
How to cite
Cite CoChat for the checks on this page, and the paper for its own findings.
- This page
- CoChat. (2026). Citation check: Integrating Probability and Nonprobability Samples for Survey Inference. https://app.cochat.ai/papers/10.1093/jssam/smz051
- The paper
- Wiśniowski, A., Sakshaug, J. W., Perez Ruiz, D. A., & Blom, A. G. (2020). Integrating Probability and Nonprobability Samples for Survey Inference. Journal of Survey Statistics and Methodology. https://doi.org/10.1093/jssam/smz051
Data sources
Bibliographic data: Semantic Scholar, OpenAlex, Crossref.
Contains information from the Semantic Scholar Academic Graph Datasets, made available under the ODC Attribution License (ODC-BY 1.0).
Semantic Scholar’s data is described in: Kinney, R., et al. (2023). The Semantic Scholar Open Data Platform. arXiv:2301.10140.
