

DLX5/6 GABAergic Expression Affects Social Vocalization: Implications for Human Evolution
Open accessPublished version of a preprint
The DOI matches its Crossref record; 110 of the 114 references it cites were found in a registry or an index; 27 of the 42 sources its claims cite were checked for support.
Abstract
DLX5 and DLX6 are two closely related transcription factors involved in brain development and in GABAergic differentiation. The DLX5/6 locus is regulated by FoxP2, a gene involved in language evolution and has been associated to neurodevelopmental disorders and mental retardation. Targeted inactivation of Dlx5/6 in mouse GABAergic neurons (Dlx5/6VgatCre mice) results in behavioural and metabolic phenotypes notably increasing lifespan by 33%. Here, we show that Dlx5/6VgatCre mice present an hyper-vocalization and hyper-socialization phenotype. We identify an introgressed Neanderthal haplotype (DLX5/6-N-Haplotype) present in 12.6% of European individuals that covers DLX5/6 coding and regulatory sequences. The DLX5/6-N-Haplotype includes the binding site for GTF2I, a gene associated to Williams-Beuren syndrome.
Overview
CoChat Summary
## TL;DR
The paper reports that reducing Dlx5/6 expression in mouse GABAergic neurons increases social ultrasonic vocalizations and social interaction, and links this phenotype to a Neanderthal-derived DLX5/6 haplotype in humans. It also reports that this haplotype is underrepresented in Italian semi-supercentenarians, suggesting a possible connection between DLX5/6 regulation, sociability, and healthy aging.
## Key findings
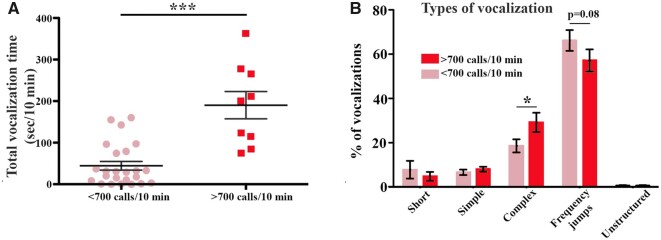
- In resident/intruder tests, 30% (3/10) of Dlx5/6VgatCre/+ mice and 56% (5/9) of Dlx5/6VgatCre mice emitted more than 700 calls/10 min, versus 14/15 (93%) of controls emitting less than 700 calls/10 min; some mutants emitted up to 1,400 calls/10 min.
- High-vocalizing mice spent more than twice the time following or approaching the intruder than low-vocalizing mice, indicating a hyper-sociability phenotype.
- The identified DLX5/6-N-Haplotype is a 37,160 bp haplotype defined by five SNPs; the paper reports it is present in 12.6% of European individuals / 6.3% of EUR alleles and is absent from continental Africa.
- In 81 Italian semi-supercentenarians (105+), the haplotype was underrepresented relative to controls: P = 0.026 versus the ITA control group, and the paper also reports a 50% under-representation compared with other European populations; a GeneATLAS association scan found the most significant phenotype was standing height (P = 8.92E−08 for rs1207733-G).
## Methods
- Mouse experiment: adult female control, Dlx5/6VgatCre/+, and Dlx5/6VgatCre mice were tested in a resident/intruder paradigm after 3 days of isolation; all analyzed animals were 6 months old.
- Vocalization analysis: ultrasonic calls were recorded for 10 min and categorized into short, simple, complex, frequency jumps, and unstructured; genotype comparisons used Wilcoxon tests and χ2 tests with Bonferroni correction.
- Human genetic analyses: the authors used 1000 Genomes data, MSSNG, UK Biobank/GeneATLAS, PheWeb, and 81 Italian semi-supercentenarians; they assessed haplotype structure, linkage disequilibrium, introgression likelihood, Fst, and case/control frequency differences.
## Limitations
- The authors state that the phenotype/genotype association analyses in UK Biobank and other platforms had “fairly high P values” and therefore do not permit a solid correlation.
- The paper reports a nonsignificant association with ASD in the MSSNG database (P = 0.16), so the human trait links are not uniformly supported.
- Evident from the text: the mouse social-vocalization sample sizes are modest (10, 9, and 15 females), and the human longevity analysis is based on a relatively small 81-person semi-supercentenarian cohort.
Model-written summary. Check it against the paper before relying on it.
Integrity signals
Registry
Cites
Statistics
Figures




Verification
Claims the paper makes
20 Valid · 3 Not valid · 10 Not checked · 71 Own results and interpretations
The cited sources that could be checked couldn’t confirm or dispute this claim.
In the paper
“The DLX5/6 locus is regulated by FoxP2”
§ DLX5/6 GABAergic Expression Affects Social Vocalization: Implications for Human Evolution > Abstract DLX5 and DLX6 are two closely related transcription factors involved in brain development and in GABAergic differentiation. The DLX5/6 locus is regulated by FoxP2, a gene involved in language evolution and has been associated with neurodevelopmental disorders and mental retardation. Targeted inactivation of Dlx5/6 in mouse GABAergic neurons (Dlx5/6VgatCre mice) results in behavioral and metabolic phenotypes notably increasing lifespan by 33%. Here, we show that Dlx5/6VgatCre mice present a hyper-vocalization and hyper-socialization phenotype. While only 7% of control mice emitted more than 700 vocalizations/10 min, 30% and 56% of heterozygous or homozygous Dlx5/6VgatCre mice emitted more than 700 and up to 1,400 calls/10 min with a higher proportion of complex and modulated calls. Hyper-vocalizing animals were more sociable: the time spent in dynamic interactions with an unknown visitor was more than doubled compared to low-vocalizing individuals. The characters affected by Dlx5/6 in the mouse (sociability, vocalization, skull, and brain shape…) overlap those affected in the “domestication syndrome”. We therefore explored the possibility that DLX5/6 played a role in human evolution and “self-domestication” comparing DLX5/6 genomic regions from Neanderthal and modern humans. We identified an introgressed Neanderthal haplotype (DLX5/6-N-Haplotype) present in 12.6% of European individuals that covers DLX5/6 coding and regulatory sequences. The DLX5/6-N-Haplotype includes the binding site for GTF2I, a gene associated with Williams–Beuren syndrome, a hyper-sociability and hyper-vocalization neurodevelopmental disorder. The DLX5/6-N-Haplotype is significantly underrepresented in semi-supercentenarians (>105 years of age), a well-established human model of healthy aging and longevity, suggesting their involvement in the coevolution of longevity, sociability, and speech.
What the sources say
- Could not verifycites Vernes, et al. 2006 sourceExperimental — accuracy not yet measured
The section “Transactivation capacities of variant forms of human FOXP2” says that FOXP2’s in vivo downstream targets remain largely unknown and examines repression of an SV40 promoter. Searches for DLX5, DLX6, and the DLX5/6 locus found no passage in our copy addressing whether FOXP2 regulates that locus; page numbers were unavailable. (LLM, conf=0.73)
plainstates a cause- Asserted: passes — The authors put it forward as true.
- Checkable: passes — It can be checked against evidence.
- Load-bearing: passes — The paper’s conclusions depend on it.
- Based: passes — The paper gives a reason why it holds.
- Could not verify
The cited sources support only part of this claim — read each source’s verdict below.
In the paper
“The characters affected by Dlx5/6 in the mouse (sociability, vocalization, skull, and brain shape…) overlap those affected in the “domestication syndrome”.”
§ DLX5/6 GABAergic Expression Affects Social Vocalization: Implications for Human Evolution > Abstract DLX5 and DLX6 are two closely related transcription factors involved in brain development and in GABAergic differentiation. The DLX5/6 locus is regulated by FoxP2, a gene involved in language evolution and has been associated with neurodevelopmental disorders and mental retardation. Targeted inactivation of Dlx5/6 in mouse GABAergic neurons (Dlx5/6VgatCre mice) results in behavioral and metabolic phenotypes notably increasing lifespan by 33%. Here, we show that Dlx5/6VgatCre mice present a hyper-vocalization and hyper-socialization phenotype. While only 7% of control mice emitted more than 700 vocalizations/10 min, 30% and 56% of heterozygous or homozygous Dlx5/6VgatCre mice emitted more than 700 and up to 1,400 calls/10 min with a higher proportion of complex and modulated calls. Hyper-vocalizing animals were more sociable: the time spent in dynamic interactions with an unknown visitor was more than doubled compared to low-vocalizing individuals. The characters affected by Dlx5/6 in the mouse (sociability, vocalization, skull, and brain shape…) overlap those affected in the “domestication syndrome”. We therefore explored the possibility that DLX5/6 played a role in human evolution and “self-domestication” comparing DLX5/6 genomic regions from Neanderthal and modern humans. We identified an introgressed Neanderthal haplotype (DLX5/6-N-Haplotype) present in 12.6% of European individuals that covers DLX5/6 coding and regulatory sequences. The DLX5/6-N-Haplotype includes the binding site for GTF2I, a gene associated with Williams–Beuren syndrome, a hyper-sociability and hyper-vocalization neurodevelopmental disorder. The DLX5/6-N-Haplotype is significantly underrepresented in semi-supercentenarians (>105 years of age), a well-established human model of healthy aging and longevity, suggesting their involvement in the coevolution of longevity, sociability, and speech.
What the sources say
- Partly supportedcites Wilkins, et al. 2014 sourceExperimental — accuracy not yet measured
The paper’s sections on morphological and behavioral components of the domestication syndrome describe craniofacial changes, tameness, and changes in brain size. They do not establish that Dlx5/6 affects these traits in mice or identify vocalization as part of the overlap (searched: Dlx5/6, vocalization, sociability). (LLM, conf=0.83)
plainstates an association- Asserted: passes — The authors put it forward as true.
- Checkable: passes — It can be checked against evidence.
- Load-bearing: passes — The paper’s conclusions depend on it.
- Based: passes — The paper gives a reason why it holds.
- Rests on an assumption not shown here.
- Partly supported
The cited sources support only part of this claim — read each source’s verdict below.
In the paper
“Most families carrying mutations limited to the genomic region encompassing only limb-specific enhancers (Birnbaum, et al. 2012) present SHFM1 with no other physical or mental problems, with the exception of one case of mild cognitive defects.”
§ DLX5/6 GABAergic Expression Affects Social Vocalization: Implications for Human Evolution > Results > Association of the DLX5/6 Locus with Human Cognitive Impairment and Speech Defects
What the sources say
- Partly supportedcites Birnbaum, et al. 2012 sourceExperimental — accuracy not yet measured
The Discussion (page unavailable) says that disruption of tissue-specific enhancers could lead to isolated SHFM1-associated phenotypes, and the paper identifies limb enhancers in the locus. It does not report that most families with changes limited to limb-specific enhancers have SHFM1 without other problems, or identify a single exception with mild cognitive defects. (LLM, conf=0.78)
plain- Asserted: passes — The authors put it forward as true.
- Checkable: passes — It can be checked against evidence.
- Load-bearing: passes — The paper’s conclusions depend on it.
- Based: passes — The paper gives a reason why it holds.
- Partly supported
The cited sources support only part of this claim — read each source’s verdict below.
In the paper
“The DLX5/6-N-Haplotype includes enhancers (I56i, I56ii, and MEF2) capable to direct DLX5/6 expression in the brain (Fazel Darbandi, et al. 2016; Assali, et al. 2019).”
§ DLX5/6 GABAergic Expression Affects Social Vocalization: Implications for Human Evolution > Results > Association of the DLX5/6 Locus with Human Cognitive Impairment and Speech Defects
What the sources say
- Partly supportedcites Fazel Darbandi, et al. 2016 sourceExperimental — accuracy not yet measured
The Introduction identifies I56i and I56ii as regulatory elements at the Dlx5/Dlx6 locus with activity in the developing forebrain. Section 4.2 reports that deleting I56ii reduces Dlx5 and Dlx6 expression. Our copy does not establish that a DLX5/6-N-Haplotype includes these elements or a MEF2 enhancer. (LLM, conf=0.86)
- Could not verifycites Assali, et al. 2019 sourceExperimental — accuracy not yet measured
The Introduction describes MEF2 proteins as transcription factors that bind DNA and regulate gene expression, but it does not connect them to DLX5/6. Searches for the DLX5/6-N-haplotype, I56i, I56ii, and DLX5/6 expression found no passage addressing whether those enhancers direct DLX5/6 expression in the brain. (LLM, conf=0.74)
plainstates a cause- Asserted: passes — The authors put it forward as true.
- Checkable: passes — It can be checked against evidence.
- Load-bearing: passes — The paper’s conclusions depend on it.
- Based: passes — The paper gives a reason why it holds.
- Partly supported
Every source the paper cites for this claim was checked and supports it.
In the paper
“the modules including these DLX genes and other key genetic components of GABAergic neurons constitute the major hub for both ASD and schizophrenia (Gandal, et al. 2018).”
§ DLX5/6 GABAergic Expression Affects Social Vocalization: Implications for Human Evolution > Discussion
What the sources say
- Supportedcites Gandal, et al. 2018 source
In “Neuronal Isoform Networks Capture Disease Specificity,” the paper identifies geneM23/isoM19 as an inhibitory-interneuron module downregulated in both ASD and schizophrenia. It lists DLX1, DLX6-AS1, GABA-synthesizing enzymes, and other interneuron markers among its hubs; “Non-coding Modules and lncRNA Regulatory Relationships” calls DLX6-AS1 its most central hub gene. (LLM, conf=0.88)
plainstates an association- Asserted: passes — The authors put it forward as true.
- Checkable: passes — It can be checked against evidence.
- Load-bearing: unclear — It is unclear whether the paper’s conclusions depend on it.
- Based: passes — The paper gives a reason why it holds.
- Supported
55 more claims · 5 with their cited sources checked
Create a free account to see all 104 claims and every source verdict.
- It may state two separate claims as one. 34
- Probably not a substantial claim. 12
- The quote only partly states this claim. 4
Self-check
Percentages, sums and reported differences re-computed from the paper’s own numbers.
Each contradiction between two passages listed here was confirmed by an independent check.
Rated minor: it would not touch a result — a value no result rests on, a p-value that stays on the same side of the significance level, or a conflict that is clerical, resolved elsewhere in the paper, or outside its own findings.
In the paper
§ DLX5/6 GABAergic Expression Affects Social Vocalization: Implications for Human Evolution > Materials and Methods > Identification of DLX5/6-Neanderthal Haplotype Introgression
“we identified an haplotype of 37,160 bp (GRCh 38–7: 96,991,129–97,022,094)”
§ DLX5/6 GABAergic Expression Affects Social Vocalization: Implications for Human Evolution > Materials and Methods > Identification of DLX5/6-Neanderthal Haplotype Introgression
“we analyzed individuals from the 1000 Genomes data set (The 1000 Genomes Project Consortium phase 3, 2015) and looked for Neandertal-like alleles in a window of 200 kb up and downstream from DLX5, using continental African populations as outgroup. Among these SNPs, we identified an haplotype of 37,160 bp (GRCh 38–7: 96,991,129–97,022,094)”
Citations
Cites
PLINK: a tool set for whole-genome association and population-based linkage analyses.
Purcell, S., Neale, B., Todd-Brown, K., Thomas, L., Ferreira, M. A. R., Bender, D., Maller, J., Sklar, P., de Bakker, P. I. W., Daly, M. J., et al. (2007) · The American Journal of Human Genetics · doi:10.1086/519795 · Cited by 34,089
Silhouettes: A graphical aid to the interpretation and validation of cluster analysis
Rousseeuw, P. J. (1987) · Journal of Computational and Applied Mathematics · doi:10.1016/0377-0427(87)90125-7 · Cited by 21,392
ape 5.0: an environment for modern phylogenetics and evolutionary analyses in R
Paradis, E., & Schliep, K. (2019) · Bioinformatics · doi:10.1093/bioinformatics/bty633 · Cited by 9,108
Shrestha, S., & Offer, S. M. (2016) · Medical Epigenetics · doi:10.1159/000444713 · Cited by 8,914
Analysis of Gene Diversity in Subdivided Populations
Nei, M. (1973) · Proceedings of the National Academy of Sciences · doi:10.1073/pnas.70.12.3321 · Cited by 8,885 · cited 2×
“Haplotypes were used to compute the Fst statistic (Nei 1973) between all the combinations of population pairs.”
MethodTHE GENETICAL STRUCTURE OF POPULATIONS
WRIGHT, S. (1949) · Annals of Eugenics · doi:10.1111/j.1469-1809.1949.tb02451.x · Cited by 6,753
Pleiotropy, natural selection, and the evolution of senescence.
Williams, G. C. (1957) · Evolution · doi:10.1111/j.1558-5646.1957.tb02911.x · Cited by 4,279
The complete genome sequence of a Neanderthal from the Altai Mountains
Prüfer, K., Racimo, F., Patterson, N., Jay, F., Sankararaman, S., Sawyer, S., Heinze, A., Renaud, G., Sudmant, P. H., de Filippo, C., et al. (2014) · Nature · doi:10.1038/nature12886 · Cited by 2,254
A high-coverage genome sequence from an archaic denisovan individual
Meyer, M., Kircher, M., Gansauge, M.-T., Li, H., Racimo, F., Mallick, S., Schraiber, J. G., Jay, F., Prüfer, K., de Filippo, C., et al. (2012) · Science · doi:10.1126/science.1224344 · Cited by 1,967
Zhou, W., Nielsen, J. B., Fritsche, L. G., Dey, R., Gabrielsen, M. E., Wolford, B. N., LeFaive, J., VandeHaar, P., Gagliano, S. A., Gifford, A., et al. (2018) · Nature Genetics · doi:10.1038/s41588-018-0184-y · Cited by 1,544
Research works printed but not linked: 1
- Vacante, 2012, BMC Surg, S36
Cited by
Bao, Z., Fang, K.-H., Miao, Z., Li, C., Yang, C., Yu, Q., Zhang, C., Miao, Z., Liu, Y., & Ji, J. (2021) · Oxidative Medicine and Cellular Longevity · doi:10.1155/2021/6338722 · Cited by 54
“And it is also associated with inherited dyspraxia and poor control of the facial musculature [35].”
BackgroundDLX genes and proteins in mammalian forebrain development
Rubenstein, J. L. R., Nord, A. S., & Ekker, M. (2024) · Development · doi:10.1242/dev.202684 · Cited by 34
Aouci, R., Soudany, M. E., Maakoul, Z., Fontaine, A., Kurihara, H., Levi, G., & Narboux‐Nême, N. (2022) · Cells · doi:10.3390/cells11111739 · Cited by 15
Self-citationBapteste, E. P., Huneman, P., Keller, L., Teulière, J., Lopez, P., Teeling, E. C., Lindner, A. B., Baudisch, A., Ludington, W. B., & Franceschi, C. (2023) · Ageing Research Reviews · doi:10.1016/j.arr.2023.101982 · Cited by 10
Self-citationAdams, J. W., Vinokur, A., de Souza, J. S., Austria, C., Guerra, B. S., Herai, R. H., Wahlin, K. J., & Muotri, A. R. (2024) · Cell Reports · doi:10.1016/j.celrep.2024.113867 · Cited by 9
“Previous studies in animal models have argued that the loss of GTF2I may indirectly affect GABAergic cells 48,49 and neuronal interactions with oligodendrocytes, 29 suggesting that including a wider array of human neural cell types will be an important objective for future studies.”
ResultNarboux‐Nême, N., Aouci, R., Fontaine, A., Vion, A., Levi, G., & Belz, L. (2024) · Cells · doi:10.3390/cells13151262 · Cited by 10
“Targeted inactivation of Dlx5/6 in mouse GABAergic neurons alters behaviour, vocal socialisation and metabolism with a reduction in anxiety-like and obsessive-compulsive-like behaviours [41,46].”
BackgroundMethodInfluentialSelf-citationStay social, stay young: a bioanthropological outlook on the processes linking sociality and ageing
Iannuzzi, V., Narboux‐Nême, N., Lehoczki, A., Levi, G., & Giuliani, C. (2024) · GeroScience · doi:10.1007/s11357-024-01416-5 · Cited by 19
“Interestingly, the DLX5/6 -N-Haplotype is significantly underrepresented in semi-supercen-tenarians (> 105 years of age), a well-established human model of healthy ageing and longevity, suggesting its potential involvement in the co-evolution of longevity, sociability, and speech [200].”
Self-citationSun, Y., Tang, Y., Qi, Q., Pang, J., Chen, Y., Wang, H., Liang, J., & Tang, W. (2025) · International Journal of Molecular Sciences · doi:10.3390/ijms26073373 · Cited by 4
Campeau, S., McNulty, C. J., Stanley, J. T., Gerber, A. N., Sasse, S. K., & Dowell, R. D. (2023) · Frontiers in Neuroscience · doi:10.3389/fnins.2023.1173699 · Cited by 4
Bermejo‐Fenoll, A., Panchón-Ruíz, A., & WALKER, M. J. (2022) · Archaeological and Anthropological Sciences · doi:10.1007/s12520-022-01575-6 · Cited by 2
“2016); and analysis of the gene FOXP2 (Lieberman 2006; Konopka et al.”
BackgroundMom genes and dad genes: genomic imprinting in the regulation of social behaviors
O’Leary, E. M., & Bonthuis, P. J. (2025) · Epigenomics · doi:10.1080/17501911.2025.2491294 · Cited by 1
Chen, P., Long, J., Hua, T., Zheng, Z., Xiao, Y., Chen, L., Kang, Y., Wu, W., & Zhang, S. (2024) · Journal of Translational Medicine · doi:10.1186/s12967-024-05125-7 · Cited by 1
“The DLX gene provides insight into vertebrate genomics and craniofacial evolution [37, 38], so it was speculated that the craniofacial dysplasia observed in this ATS patients might be related to abnormalities in DLX 5 and 6.”
BackgroundWang, J. (2022) · International Conference on Communication and Electronics Systems (ICCES) · doi:10.1109/icces54183.2022.9835817
TrkB-dependent antidepressants action involves Dlx5/6 inhibition in cortical GABAergic neurons.Preprint
Narboux‐Nême, N., Aouci, R., Fontaine, A., Vion, A., Levi, G., & Belz, L. (2024) · Research Square · doi:10.21203/rs.3.rs-4188176/v1
Self-citationSánchez-Garrido, F., Bouzerand, V., Kaiser, M., Chaumeton, C., Fontaine, A., Zikmund, T., Kaiser, J., & Heude, É. (2024) · bioRxiv (Cold Spring Harbor Laboratory) · doi:10.1101/2024.12.13.628362
Pleiotropic function of Dlx5/6 in the development of mammalian vocal and auditory organs
Sánchez-Garrido, F., Bouzerand, V., Kaiser, M., Chaumeton, C., Fontaine, A., Zikmund, T., Kaiser, J., & Heude, É. (2025) · PLoS ONE · doi:10.1371/journal.pone.0337426
“Interestingly, the DLX5/6 locus shows methylation motifs that changes linearly with age in mouse and human tissues including the brain [56].”
InfluentialInference of Autism Risk Genes Through Comparative Sociogenomics and Molecular Network Analysis
Chiodi, A., Mosca, E., Cupaioli, F. A., & Mezzelani, A. (2026) · Genes · doi:10.3390/genes17040368 · Cited by 1
“…genes involved in sociability in animal species, including humans, were considered, specifically Spider [39]; Birds [28,40–43]; Cat [44,45]; Dog [46–50]; Dolphin [51]; Domesticated mammals [52]; Domesticated animals [53]; Dromedary [54]; Fox [55–57]; Horse [58]; Mouse [59]; and Homo s.s. [60–63].”
Aouci, R. (2024) · theses.fr (ABES) · doi:10.70675/93bae735zda72z4d5fz90d7zdc1fd3628cee
Self-citationOrigines développementale et évolutive de la région cervicale des tétrapodes
Sánchez-Garrido, F. (2025) · theses.fr (ABES) · doi:10.70675/afc713dczee64z48b8za364zcddc2beb5f83
Belz, L., Aouci, R., Allain, B., Henderson, F. J., Fontaine, A., Desgagne, P., Calzaroni, L., Fabre, V., Pardi, M. B., Levi, G., et al. (2026) · bioRxiv (Cold Spring Harbor Laboratory) · doi:10.64898/2026.07.23.740286
Self-citationEvolution‐guided yeast complementation reveals functional differences in human PSPH variants
Campa‐Álvarez, M., Ascencio, D., Vallebueno‐Estrada, M., González-Orozco, E., Martínez-Guerrero, C. E., Montiel, R., & DeLuna, A. (2026) · FEBS Open Bio · doi:10.1002/2211-5463.70308
Metadata
- Authors
- Levi, G., de Lombares, C., Giuliani, C., Iannuzzi, V., Aouci, R., Garagnani, P., Franceschi, C., Grimaud-Hervé, D., & Narboux-Nême, N.
- Affiliations
- Centre National de la Recherche Scientifique (FR)
- University of Bologna (IT)
- Karolinska Institutet (SE)
- N. I. Lobachevsky State University of Nizhny Novgorod (RU)
- Physiologie Moléculaire et Adaptation, CNRS UMR7221, Département AVIV, Muséum National d'Histoire Naturelle, Paris, France
- ORCID
- Venue
- Molecular Biology and Evolution
- Publisher
- Oxford University Press (OUP)
- Published
- 2021-06-16
- Volume
- 38
- Issue
- 11
- Pages
- 4748-4764
- ISSN
- 0737-4038 (ISSN-L)
- 1537-1719
- PMC
- PMC8557472
- OpenAlex
- W3171099679
- Cited by
- 23
- References
- 114
- Citations by year
- 2026: 3 · 2025: 4 · 2024: 10 · 2023: 2 · 2022: 3 · 2021: 1
- FWCI
- 1.93
- Type
- journal article
- Language
- en
- Open access
- gold
- doi.org
- Licence
- Locations
- Molecular Biology and Evolution (publishedVersion, cc-by-nc)
- bioRxiv (Cold Spring Harbor Laboratory) (submittedVersion)
- Europe PMC (PubMed Central) (publishedVersion, other-oa)
- PubMed Central (publishedVersion, cc-by-nc)
- PubMed (publishedVersion)
- Archivio istituzionale della ricerca (Alma Mater Studiorum Università di Bologna) (submittedVersion, cc-by-nc)
- HAL (submittedVersion)
- Funders
- ANR (ANR-17-CE14-0024, ANR-17-CE37-0007)
- Fondation-NRJ (216612)
- French Ministry of Research
- Topics
- Life Sciences › Biochemistry, Genetics and Molecular Biology › Genetics › Genetics and Neurodevelopmental Disorders
- Life Sciences › Agricultural and Biological Sciences › Ecology, Evolution, Behavior and Systematics › Animal Vocal Communication and Behavior
- Social Sciences › Cultural Studies › Language and cultural evolution
- Keywords
- GABAergic neurons, social vocalizations, sociability, domestication syndrome, self-domestication, Neanderthal introgression, GTF2I, Williams syndrome, longevity, human evolution, speech evolution, FOXP2, lifespan
- MeSH terms
- Animals, Genes, Homeobox, Humans, Transcription Factors, Vocalization, Animal, Homeodomain Proteins, Transcription Factors, TFII, Mice, Neanderthals
About these checks
Registry, retraction, Cites and statistics results are computed, not judged, with one exception: a printed reference that no index lists is read once by a model before it counts as a citation error. Claims are extracted by a model and kept only when their quote appears verbatim in the text; each cited source is then checked, with a model’s help, for whether it says what the claim relies on. Those verdicts can be wrong — read the claim’s quote and the cited source before relying on one.
The claim verdicts this report counts are experimental: their accuracy is not yet measured.
A language model drew the claims from the paper on 2026-10-11, under version 3 of the claim definition (model deepseek-v4.1-flash, prompt extract-v3).
A second model labelled each claim on 2026-10-11 (model jev-1.13-20260917, definition revision gold-guideline-v0.2).
Cited sources are checked with a language model’s help (gpt-6-sol).
Statistics and arithmetic are recomputed, not judged.
Confidence bands are shown only for fields calibrated on our annotated test set. None is calibrated yet, so no band is shown.
What counts as a claim ›How we measure confidence ›How we check this ›
Are you an author, or do you see a problem with this page? Request a review
Data sources
Bibliographic data: Semantic Scholar, OpenAlex, Crossref.
Contains information from the Semantic Scholar Academic Graph Datasets, made available under the ODC Attribution License (ODC-BY 1.0).
Semantic Scholar’s data is described in: Kinney, R., et al. (2023). The Semantic Scholar Open Data Platform. arXiv:2301.10140.
