Cited by 16

The DOI matches its Crossref record; 17 of the 17 references it cites were found in a registry or an index.

CoolMPS for robust sequencing of single-nuclear RNAs captured by droplet-based method

Hahn, Oliver, Fehlmann, Tobias, Zhang, Hui, Munson, Christy N, Vest, Ryan T, Borcherding, Adam, Liu, Sophie, Villarosa, Christian, Drmanac, Snezana, Drmanac, Rade, Keller, Andreas, Wyss-Coray, Tony·2021·Nucleic Acids Research

Abstract

Massively-parallel single-cell and single-nucleus RNA sequencing (scRNA-seq, snRNA-seq) requires extensive sequencing to achieve proper per-cell coverage, making sequencing resources and availability of sequencers critical factors for conducting deep transcriptional profiling. CoolMPS is a novel sequencing-by-synthesis approach that relies on nucleotide labeling by re-usable antibodies, but whether it is applicable to snRNA-seq has not been tested. Here, we use a low-cost and off-the-shelf protocol to chemically convert libraries generated with the widely-used Chromium 10X technology to be sequenceable with CoolMPS technology. To assess the quality and performance of converted libraries sequenced with CoolMPS, we generated a snRNA-seq dataset from the hippocampus of young and old mice. Native libraries were sequenced on an Illumina Novaseq and libraries that were converted to be compatible with CoolMPS were sequenced on a DNBSEQ-400RS. CoolMPS-derived data faithfully replicated key characteristics of the native library dataset, including correct estimation of ambient RNA-contamination, detection of captured cells, cell clustering results, spatial marker gene expression, inter- and intra-replicate differences and gene expression changes during aging. In conclusion, our results show that CoolMPS provides a viable alternative to standard sequencing of RNA from droplet-based libraries.

Overview

The claims and statistics of this paper haven’t been checked yet.

Run the check — free, no account needed. It reads the open-access text and checks the sources it cites.

A few free checks a day · papers already verified open instantly · results are public

Integrity signals

Registry

Crossref · 10.1093/nar/gkaa1127

Cites

17 of 17 references verified0 citation errors · 0 not checkable

Statistics

Figures

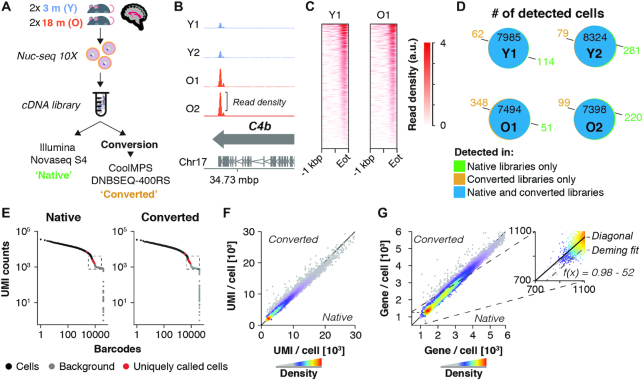
Figure 1. Performance of native and CoolMPS-compatible snRNA-seq libraries. (A) Experiment outline. Four 10 × 3′ snRNA-seq libraries were generated, derived from hippocampi of two young (3 months) and two old mice (18 months). Libraries were sequenced directly using an Illumina Novaseq or chemically converted and sequenced using CoolMPS technology on a DNBSEQ-400RS. Each library was down-sampled to contain 200 mio. paired-end reads per sample and library type. (B) Distribution of aggregated reads from the converted libraries dataset over C4b gene locus, separated by sample. Arrows indicate gene orientation; merged mRNA structure is depicted below. (C) Aligned read distribution of aggregated reads from the converted libraries dataset over the last kilobase pair of all expressed genes (n = 11 132 genes with rpkm > 1 in two or more samples). (D) Venn diagrams depict the number of cells detected in each dataset, split by samples (Y1, Y2, O1, O2). Cells of the same sample exhibiting identical cell barcodes in both datasets are considered identical cells detected by both Illumina and CoolMPS sequencing. Number of cells detected only in the native or converted libraries are colored in green and ochre, respectively. (E) Knee plot of sample Y1, showing UMI counts per cell barcode. Black points represent cells, with cells called only in one library type colored in red. The regions at the cutoff between called cells and empty droplets (labelled ‘background’; marked by the dashed box) are visualized at larger scale in Supplementary Figure S1b. (F, G) Scatterplot showing the cell-wise number of (F) detected UMIs and (G) genes by either library type. Insert shows the zoomed region with Deming regression line, showing a mild offset from the diagonal. Abbreviations: Y1, Y2, young male replicates 1 and 2; O1, O2, old male replicates 1 and 2; Eot, end of transcript; a.u., arbitrary unit; mbp/kbp/bp, megabase pair/kilobase pair/base pair.
Figure 1. Performance of native and CoolMPS-compatible snRNA-seq libraries. (A) Experiment outline. Four 10 × 3′ snRNA-seq libraries were generated, derived from hippocampi of two young (3 months) and two old mice (18 months). Libraries were sequenced directly using an Illumina Novaseq or chemically converted and sequenced using CoolMPS technology on a DNBSEQ-400RS. Each library was down-sampled to contain 200 mio. paired-end reads per sample and library type. (B) Distribution of aggregated reads from the converted libraries dataset over C4b gene locus, separated by sample. Arrows indicate gene orientation; merged mRNA structure is depicted below. (C) Aligned read distribution of aggregated reads from the converted libraries dataset over the last kilobase pair of all expressed genes (n = 11 132 genes with rpkm > 1 in two or more samples). (D) Venn diagrams depict the number of cells detected in each dataset, split by samples (Y1, Y2, O1, O2). Cells of the same sample exhibiting identical cell barcodes in both datasets are considered identical cells detected by both Illumina and CoolMPS sequencing. Number of cells detected only in the native or converted libraries are colored in green and ochre, respectively. (E) Knee plot of sample Y1, showing UMI counts per cell barcode. Black points represent cells, with cells called only in one library type colored in red. The regions at the cutoff between called cells and empty droplets (labelled ‘background’; marked by the dashed box) are visualized at larger scale in Supplementary Figure S1b. (F, G) Scatterplot showing the cell-wise number of (F) detected UMIs and (G) genes by either library type. Insert shows the zoomed region with Deming regression line, showing a mild offset from the diagonal. Abbreviations: Y1, Y2, young male replicates 1 and 2; O1, O2, old male replicates 1 and 2; Eot, end of transcript; a.u., arbitrary unit; mbp/kbp/bp, megabase pair/kilobase pair/base pair.CC BY · PubMed Central
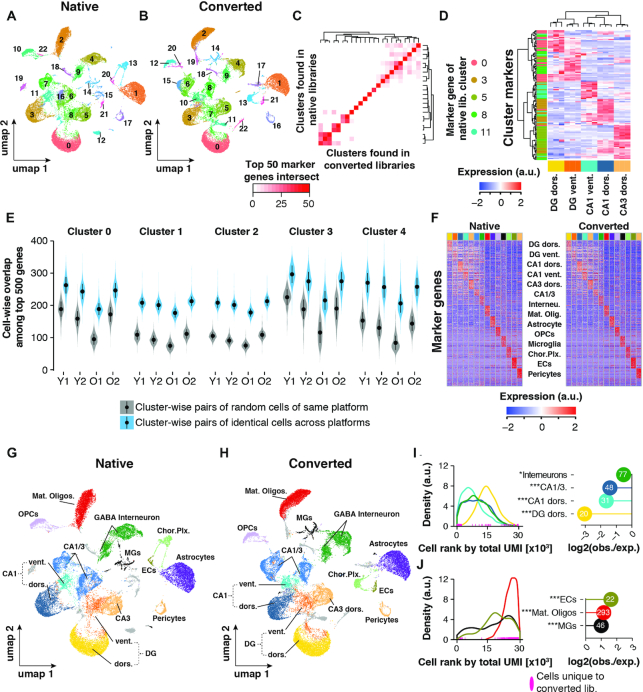
Figure 2. Cell clustering performance across libraries. (A, B) UMAP representation of cells and clustering results of (A) n = 29 945 cells (native libraries) and (B) n = 30 360 (converted libraries), respectively. (C) Heatmap depicting the number of common top 50 genes per cluster as detected in either sequencing run. (D) Identification of spatial origin of five neuronal clusters. We performed hierarchical clustering of the top 30 marker genes (rows) of clusters 0, 3, 5, 8 and 11 as identified in the native dataset. For those marker genes, expression is plotted as measured in a publicly available RNA-seq data of anatomically distinct neurons (columns; n = 3 replicates per neuronal population). Cells within the heatmap are colored to represent row-wise z-transformed expression of given gene across all anatomically distinct neurons. Marker genes are annotated by the row-side color bar, with each marker gene colored by cluster. Expression data was derived from (Cembrowski et al. 2016). (E) Cluster and sample-wise distribution of common top 500 expressed genes between two cells. Cluster number corresponds to the clusters found in the native dataset in (A). Gray violins represent overlaps from cells of the same cluster (biological cell replicates); blue violins represent overlaps from cells with the same barcode, sequenced in both datasets (technical replicates). Means ± SEM. (F) Relative expression of top 30 cell marker genes as found in native library dataset. Each column represents n = 50 of randomly selected cells per cell type. (G, H) UMAP representation of cells with annotated cell types in (G) native and (H) converted library dataset, respectively. (I, J) Analysis of depletion (I) and enrichment (J) of cells found only in the CoolMPS-compatible dataset among neuronal and non-neuronal cell populations. Left-hand panels: Distribution of cell types among all cells, ranked by their total UMI count in descending order (converted libraries only; cell with the highest total UMI count has rank 0). Rank of cells for given cell types that were found only in the CoolMPS-compatible dataset are indicated along the x-axes. Right-hand panels: Y-axis indicates for each cell type the observed-over-expected values for cells that were found only in the CoolMPS-compatible dataset. Absolute number of cells found only in the CoolMPS-compatible dataset are indicated in the bubble. Cell types exhibiting no statistical enrichment or depletion for CoolMPS-unique cells are not shown. ***Padj < 0.001, **Padj < 0.01, *Padj < 0.05, two-sided Fisher's exact test, adjusted for multiple testing. Abbreviations: Y1, Y2, Young male replicates 1 and 2; O1, O2, Old male replicates 1 and 2; DG dors., granule neurons of dorsal dentate gyrus; DG vent., granule neurons of ventral dentate gyrus; CA1 dors., pyramidal neurons of dorsal CA1; CA1 vent., pyramidal neurons of ventral CA1; CA3 dors., pyramidal neurons of dorsal CA3; CA1/CA3 Neur., pyramidal neurons that could not be clearly allocated to CA1 and CA3; GABA interneuron, Gabaergic interneurons; Mat. Oligos, mature oligodendrocytes; OPCs, oligodendrocyte precursors; MGs, microglia; Chor. Plx., choroid plexus cells; ECs, brain endothelial cells; a.u., arbitrary unit; obs./exp., observed over expected.
Figure 2. Cell clustering performance across libraries. (A, B) UMAP representation of cells and clustering results of (A) n = 29 945 cells (native libraries) and (B) n = 30 360 (converted libraries), respectively. (C) Heatmap depicting the number of common top 50 genes per cluster as detected in either sequencing run. (D) Identification of spatial origin of five neuronal clusters. We performed hierarchical clustering of the top 30 marker genes (rows) of clusters 0, 3, 5, 8 and 11 as identified in the native dataset. For those marker genes, expression is plotted as measured in a publicly available RNA-seq data of anatomically distinct neurons (columns; n = 3 replicates per neuronal population). Cells within the heatmap are colored to represent row-wise z-transformed expression of given gene across all anatomically distinct neurons. Marker genes are annotated by the row-side color bar, with each marker gene colored by cluster. Expression data was derived from (Cembrowski et al. 2016). (E) Cluster and sample-wise distribution of common top 500 expressed genes between two cells. Cluster number corresponds to the clusters found in the native dataset in (A). Gray violins represent overlaps from cells of the same cluster (biological cell replicates); blue violins represent overlaps from cells with the same barcode, sequenced in both datasets (technical replicates). Means ± SEM. (F) Relative expression of top 30 cell marker genes as found in native library dataset. Each column represents n = 50 of randomly selected cells per cell type. (G, H) UMAP representation of cells with annotated cell types in (G) native and (H) converted library dataset, respectively. (I, J) Analysis of depletion (I) and enrichment (J) of cells found only in the CoolMPS-compatible dataset among neuronal and non-neuronal cell populations. Left-hand panels: Distribution of cell types among all cells, ranked by their total UMI count in descending order (converted libraries only; cell with the highest total UMI count has rank 0). Rank of cells for given cell types that were found only in the CoolMPS-compatible dataset are indicated along the x-axes. Right-hand panels: Y-axis indicates for each cell type the observed-over-expected values for cells that were found only in the CoolMPS-compatible dataset. Absolute number of cells found only in the CoolMPS-compatible dataset are indicated in the bubble. Cell types exhibiting no statistical enrichment or depletion for CoolMPS-unique cells are not shown. ***Padj < 0.001, **Padj < 0.01, *Padj < 0.05, two-sided Fisher's exact test, adjusted for multiple testing. Abbreviations: Y1, Y2, Young male replicates 1 and 2; O1, O2, Old male replicates 1 and 2; DG dors., granule neurons of dorsal dentate gyrus; DG vent., granule neurons of ventral dentate gyrus; CA1 dors., pyramidal neurons of dorsal CA1; CA1 vent., pyramidal neurons of ventral CA1; CA3 dors., pyramidal neurons of dorsal CA3; CA1/CA3 Neur., pyramidal neurons that could not be clearly allocated to CA1 and CA3; GABA interneuron, Gabaergic interneurons; Mat. Oligos, mature oligodendrocytes; OPCs, oligodendrocyte precursors; MGs, microglia; Chor. Plx., choroid plexus cells; ECs, brain endothelial cells; a.u., arbitrary unit; obs./exp., observed over expected.CC BY · PubMed Central
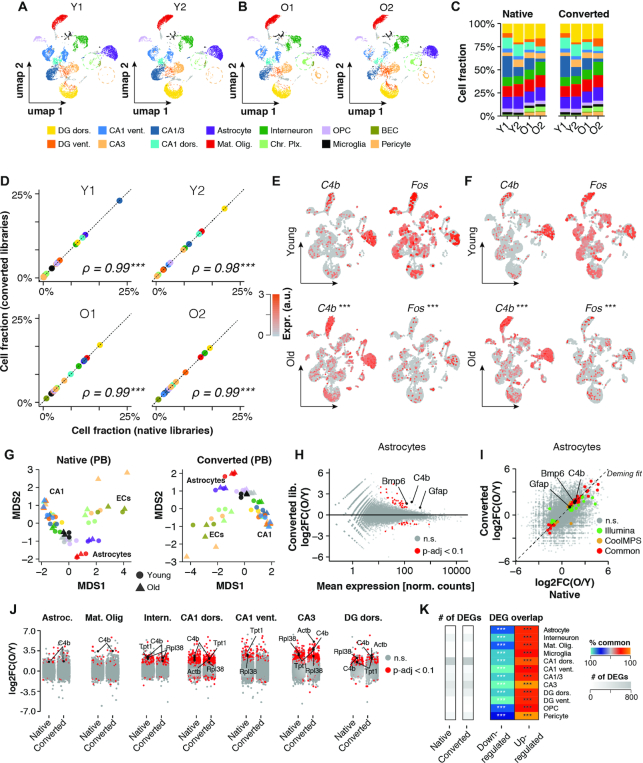
Figure 3. Inter- and intra-replicate differences are unaffected by conversion reaction. (A, B) UMAP representation of cells (CoolMPS-compatible dataset) with annotated cell types split by replicates across (A) young and (B) old. Circles highlight differential abundance of choroid plexus-derived cells and Pericytes. (C) Relative cell composition across replicates and datasets. (D) Sample-wise correlation of cell fractions as detected in the native and converted libraries dataset. ***P < 0.001, **P < 0.01, *P < 0.05, Spearman rank correlation test. (E, F) Expression levels of C4b and Fos per cell colored on UMAP as detected in (E) the native dataset and (F) the CoolMPS-compatible dataset, respectively. Expression of both genes changes significantly with age across all cells. ***Padj < 0.001, **Padj < 0.01, *Padj < 0.05, Two-sided Wilcoxon rank-sum test, adjusted for multiple testing. (G) Pseudobulk-level Multidimensional Scaling (MDS) plot for both datasets. Each point represents one cell population in a given sample. Points are colored by cell population and shaped by age. (H) Pseudobulk-level MA-plot for Astrocyte population (CoolMPS-compatible dataset). Genes showing differential expression (Padj < 0.1) between old and young are marked in red. *Padj < 0.1, two-sided Wald test, adjusted for multiple testing. (I) Cross-platform correlation of pseudobulk-level, gene-wise log2-transformed expression ratios between young and old samples. Detected DEGs (Padj < 0.1) common and distinct to either dataset are colored. (J) Distribution of pseudobulk-level gene-wise expression changes between old and young animals, resolved by cell population. Genes showing differential expression (Padj < 0.1) between old and young in given cell type are marked in red. (K) Total number of detected DEGs per cell population using either the native or converted libraries (grey heatmap) and per-cell population overlap of common DEGs relative to total DEGs, split by up- and down-regulated genes. % overlap is indicated by color scale. ***Padj < 0.001, **Padj < 0.01, *Padj < 0.05, two-sided Fisher's exact test, adjusted for multiple testing. Abbreviations: Y1, Y2, young male replicates 1 and 2; O1, O2, old male replicates 1 and 2; DG dors., granule neurons of dorsal dentate gyrus; DG vent., granule neurons of ventral dentate gyrus; CA1 dors., pyramidal neurons of dorsal CA1; CA1 vent., pyramidal neurons of ventral CA1; CA3 dors., pyramidal neurons of dorsal CA3; CA1/CA3 Neur., pyramidal neurons that could not be clearly allocated to CA1 and CA3; GABA interneuron, GABAergic interneurons; Mat. Oligos, mature oligodendrocytes; OPCs, oligodendrocyte precursors; MGs, microglia; Chor. Plx., choroid plexus cells; ECs, brain endothelial cells; Astroc., astrocytes; n.s., not statistically significant; a.u., arbitrary unit; obs./exp., observed over expected.
Figure 3. Inter- and intra-replicate differences are unaffected by conversion reaction. (A, B) UMAP representation of cells (CoolMPS-compatible dataset) with annotated cell types split by replicates across (A) young and (B) old. Circles highlight differential abundance of choroid plexus-derived cells and Pericytes. (C) Relative cell composition across replicates and datasets. (D) Sample-wise correlation of cell fractions as detected in the native and converted libraries dataset. ***P < 0.001, **P < 0.01, *P < 0.05, Spearman rank correlation test. (E, F) Expression levels of C4b and Fos per cell colored on UMAP as detected in (E) the native dataset and (F) the CoolMPS-compatible dataset, respectively. Expression of both genes changes significantly with age across all cells. ***Padj < 0.001, **Padj < 0.01, *Padj < 0.05, Two-sided Wilcoxon rank-sum test, adjusted for multiple testing. (G) Pseudobulk-level Multidimensional Scaling (MDS) plot for both datasets. Each point represents one cell population in a given sample. Points are colored by cell population and shaped by age. (H) Pseudobulk-level MA-plot for Astrocyte population (CoolMPS-compatible dataset). Genes showing differential expression (Padj < 0.1) between old and young are marked in red. *Padj < 0.1, two-sided Wald test, adjusted for multiple testing. (I) Cross-platform correlation of pseudobulk-level, gene-wise log2-transformed expression ratios between young and old samples. Detected DEGs (Padj < 0.1) common and distinct to either dataset are colored. (J) Distribution of pseudobulk-level gene-wise expression changes between old and young animals, resolved by cell population. Genes showing differential expression (Padj < 0.1) between old and young in given cell type are marked in red. (K) Total number of detected DEGs per cell population using either the native or converted libraries (grey heatmap) and per-cell population overlap of common DEGs relative to total DEGs, split by up- and down-regulated genes. % overlap is indicated by color scale. ***Padj < 0.001, **Padj < 0.01, *Padj < 0.05, two-sided Fisher's exact test, adjusted for multiple testing. Abbreviations: Y1, Y2, young male replicates 1 and 2; O1, O2, old male replicates 1 and 2; DG dors., granule neurons of dorsal dentate gyrus; DG vent., granule neurons of ventral dentate gyrus; CA1 dors., pyramidal neurons of dorsal CA1; CA1 vent., pyramidal neurons of ventral CA1; CA3 dors., pyramidal neurons of dorsal CA3; CA1/CA3 Neur., pyramidal neurons that could not be clearly allocated to CA1 and CA3; GABA interneuron, GABAergic interneurons; Mat. Oligos, mature oligodendrocytes; OPCs, oligodendrocyte precursors; MGs, microglia; Chor. Plx., choroid plexus cells; ECs, brain endothelial cells; Astroc., astrocytes; n.s., not statistically significant; a.u., arbitrary unit; obs./exp., observed over expected.CC BY · PubMed Central
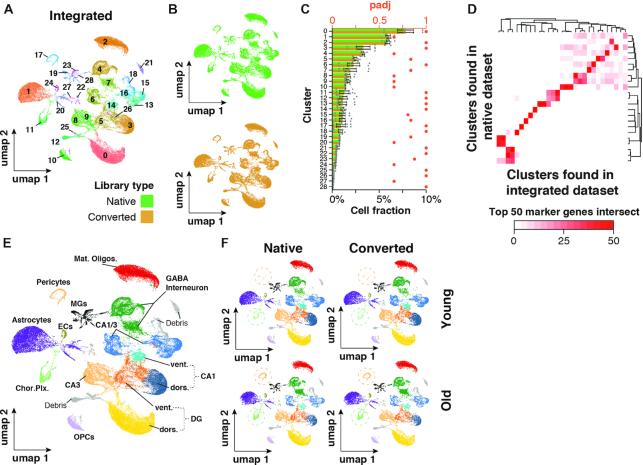
Figure 4. Integrated native and CooMPS-compatible snRNA-seq datasets show no separation by library type. (A, B) UMAP representation of cells and clustering results of n = 60,0720 cells integrated from both datasets. Cells are colored by (A) cluster or (B) library type. Cells were split by library type to improve visibility. (C) Relative abundance of each cluster normalized to total cells. Relative abundances are split by library type to gauge conversion-dependent composition of clusters. n = 4 per dataset. Means ± SEM. ***Padj < 0.001, **Padj < 0.01, *Padj < 0.05, two-sided Wilcoxon rank-sum test, adjusted for multiple testing. Adjusted P-values for paired, two-sided Wilcoxon test probing differential abundance per cluster are shown in red. (D) Heatmap depicting the number of common top 50 genes per cluster as detected in either integrated or native dataset. (E, F) UMAP representation of cell populations from integration dataset when (A) collapsed or (B) split by dataset and age. Circles highlight differential abundance of choroid plexus-derived cells and Pericytes. Abbreviations: DG dors., granule neurons of dorsal dentate gyrus; DG vent., granule neurons of ventral dentate gyrus; CA1 dors., pyramidal neurons of dorsal CA1; CA1 vent., pyramidal neurons of ventral CA1; CA3 dors., pyramidal neurons of dorsal CA3; CA1/CA3 Neur., pyramidal neurons that could not be clearly allocated to CA1 and CA3; GABA interneuron, gabaergic interneurons; Mat. oligos, mature oligodendrocytes; OPCs, oligodendrocyte precursors; MGs, microglia; Chor. Plx., choroid plexus cells; ECs, brain endothelial cells; a.u., arbitrary unit; obs./exp., observed over expected; Padj, adjusted P-value.
Figure 4. Integrated native and CooMPS-compatible snRNA-seq datasets show no separation by library type. (A, B) UMAP representation of cells and clustering results of n = 60,0720 cells integrated from both datasets. Cells are colored by (A) cluster or (B) library type. Cells were split by library type to improve visibility. (C) Relative abundance of each cluster normalized to total cells. Relative abundances are split by library type to gauge conversion-dependent composition of clusters. n = 4 per dataset. Means ± SEM. ***Padj < 0.001, **Padj < 0.01, *Padj < 0.05, two-sided Wilcoxon rank-sum test, adjusted for multiple testing. Adjusted P-values for paired, two-sided Wilcoxon test probing differential abundance per cluster are shown in red. (D) Heatmap depicting the number of common top 50 genes per cluster as detected in either integrated or native dataset. (E, F) UMAP representation of cell populations from integration dataset when (A) collapsed or (B) split by dataset and age. Circles highlight differential abundance of choroid plexus-derived cells and Pericytes. Abbreviations: DG dors., granule neurons of dorsal dentate gyrus; DG vent., granule neurons of ventral dentate gyrus; CA1 dors., pyramidal neurons of dorsal CA1; CA1 vent., pyramidal neurons of ventral CA1; CA3 dors., pyramidal neurons of dorsal CA3; CA1/CA3 Neur., pyramidal neurons that could not be clearly allocated to CA1 and CA3; GABA interneuron, gabaergic interneurons; Mat. oligos, mature oligodendrocytes; OPCs, oligodendrocyte precursors; MGs, microglia; Chor. Plx., choroid plexus cells; ECs, brain endothelial cells; a.u., arbitrary unit; obs./exp., observed over expected; Padj, adjusted P-value.CC BY · PubMed Central

Verification

Claims the paper makes

The claims and statistics of this paper haven’t been checked yet.

Run the check — free, no account needed. It reads the open-access text and checks the sources it cites.

A few free checks a day · papers already verified open instantly · results are public

Claims other papers make about this one

Each is checked against this paper’s own text: does it say what the citing paper says it does?

Self-check

Percentages, sums and reported differences re-computed from the paper’s own numbers.

The self-check needs the paper’s full text.

Citations

Cites

Research works printed but not linked: 23

  1. Levy, 2016, Advancements in next-generation sequencing, Annu. Rev. Genomics Hum. Genet., 17, 95, 10.1146/annurev-genom-083115-022413 · DOI
  2. Wang, 2020, Changing technologies of RNA sequencing and their applications in clinical oncology, Front. Oncol., 10, 447, 10.3389/fonc.2020.00447 · DOI
  3. Zheng, 2017, Massively parallel digital transcriptional profiling of single cells, Nat. Commun., 8, 14049, 10.1038/ncomms14049 · DOI · Paper page
  4. Mathys, 2019, Single-cell transcriptomic analysis of Alzheimer's disease, Nature, 570, 332, 10.1038/s41586-019-1195-2 · DOI · Paper page
  5. Natarajan, 2019, Comparative analysis of sequencing technologies for single-cell transcriptomics, Genome Biol, 20, 70, 10.1186/s13059-019-1676-5 · DOI
  6. Senabouth, 2020, Comparative performance of the BGI and Illumina sequencing technology for single-cell RNA-sequencing, NAR Genom Bioinform, 2, lqaa034, 10.1093/nargab/lqaa034 · DOI
  7. Ding, 2020, Systematic comparison of single-cell and single-nucleus RNA-sequencing methods, Nat. Biotechnol., 38, 737, 10.1038/s41587-020-0465-8 · DOI · Paper page
  8. Keren-Shaul, 2017, A unique microglia type associated with restricting development of Alzheimer's disease, Cell, 169, 1276, 10.1016/j.cell.2017.05.018 · DOI · Paper page
  9. Zhou, 2020, Human and mouse single-nucleus transcriptomics reveal TREM2-dependent and TREM2-independent cellular responses in Alzheimer's disease, Nat. Med., 26, 131, 10.1038/s41591-019-0695-9 · DOI · Paper page
  10. Habib, 2020, Disease-associated astrocytes in Alzheimer's disease and aging, Nat. Neurosci., 23, 701, 10.1038/s41593-020-0624-8 · DOI · Paper page
  11. Ximerakis, 2019, Single-cell transcriptomic profiling of the aging mouse brain, Nat. Neurosci., 22, 1696, 10.1038/s41593-019-0491-3 · DOI · Paper page
  12. Cembrowski, 2016, Hipposeq: a comprehensive RNA-seq database of gene expression in hippocampal principal neurons, Elife, 5, e14997, 10.7554/eLife.14997 · DOI
  13. Parekh, 2018, zUMIs - a fast and flexible pipeline to process RNA sequencing data with UMIs, Gigascience, 7, giy059, 10.1093/gigascience/giy059 · DOI
  14. Crowell, 2019, On the discovery of population-specific state transitions from multi-sample multi-condition single-cell RNA sequencing data, 10.1101/713412 · DOI
  15. Love, 2014, Moderated estimation of fold change and dispersion for RNA-seq data with DESeq2, Genome Biol, 15, 550, 10.1186/s13059-014-0550-8 · DOI · Paper page
  16. Stuart, 2019, Comprehensive Integration of Single-Cell Data, Cell, 177, 1888, 10.1016/j.cell.2019.05.031 · DOI · Paper page
  17. Lun, 2019, EmptyDrops: distinguishing cells from empty droplets in droplet-based single-cell RNA sequencing data, Genome Biol., 20, 63, 10.1186/s13059-019-1662-y · DOI
  18. Wegiel, 2002, Vascular fibrosis and calcification in the hippocampus in aging, Alzheimer disease, and Down syndrome, Acta Neuropathol, 103, 333, 10.1007/s00401-001-0471-y · DOI
  19. Stankiewicz, 2015, The effect of acute and chronic social stress on the hippocampal transcriptome in mice, PLoS One, 10, e0142195, 10.1371/journal.pone.0142195 · DOI
  20. Kitraki, 1993, Aging-related changes in IGF-II and c-fos gene expression in the rat brain, Int. J. Dev. Neurosci., 11, 1, 10.1016/0736-5748(93)90029-D · DOI
  21. Schaum, 2019, Ageing hallmarks exhibit organ-specific temporal signatures, Nature, 583, 596, 10.1038/s41586-020-2499-y · DOI · Paper page
  22. 1000 Genomes Project Consortium, 2015, A global reference for human genetic variation, Nature, 526, 68, 10.1038/nature15393 · DOI · Paper page
  23. Chhangawala, 2015, The impact of read length on quantification of differentially expressed genes and splice junction detection, Genome Biol., 16, 131, 10.1186/s13059-015-0697-y · DOI

Cited by

Sorted by citations

See all 16

Metadata

Authors
Hahn, O., Fehlmann, T., Zhang, H., Munson, C. N., Vest, R. T., Borcherding, A., Liu, S., Villarosa, C., Drmanac, S., Drmanac, R., Keller, A., & Wyss-Coray, T.
Affiliations
  • Department of Neurology and Neurological Sciences, Stanford University School of Medicine, Stanford, CA, USA
  • Chair for Clinical Bioinformatics, Saarland University, Saarbrücken, Germany
  • MGI, 2904 Orchard Pkwy, San Jose, CA, USA
Venue
Nucleic Acids Research
Published
2020-12-02
Volume
49
Issue
2
Pages
e11-e11
ISSN
  • 0305-1048
  • 1362-4962
Cited by
16
References
17
Language
en
Funders
Nan Fung Life Sciences

About these checks

Registry, retraction, Cites and statistics results are computed, not judged, with one exception: a printed reference that no index lists is read once by a model before it counts as a citation error. Claims are extracted by a model and kept only when their quote appears verbatim in the text; each cited source is then checked, with a model’s help, for whether it says what the claim relies on. Those verdicts can be wrong — read the claim’s quote and the cited source before relying on one.

Statistics and arithmetic are recomputed, not judged.

Confidence bands are shown only for fields calibrated on our annotated test set. None is calibrated yet, so no band is shown.

What counts as a claim ›How we measure confidence ›How we check this ›

Are you an author, or do you see a problem with this page? Request a review