Cited by 20

The DOI matches its Crossref record; 5 of the 5 references it cites were found in a registry or an index.

NBS1 interacts with Notch signaling in neuronal homeostasis

Zhou, Zhong-Wei, Kirtay, Murat, Schneble, Nadine, Yakoub, George, Ding, Mingmei, Rüdiger, Tina, Siniuk, Kanstantsin, Lu, Ruiqing, Jiang, Yi-Nan, Li, Tang-Liang, Kaether, Christoph, Barzilai, Ari, Wang, Zhao-Qi·2020·Nucleic Acids Research

Abstract

NBS1 is a critical component of the MRN (MRE11/RAD50/NBS1) complex, which regulates ATM- and ATR-mediated DNA damage response (DDR) pathways. Mutations in NBS1 cause the human genomic instability syndrome Nijmegen Breakage Syndrome (NBS), of which neuronal deficits, including microcephaly and intellectual disability, are classical hallmarks. Given its function in the DDR to ensure proper proliferation and prevent death of replicating cells, NBS1 is essential for life. Here we show that, unexpectedly, Nbs1 deletion is dispensable for postmitotic neurons, but compromises their arborization and migration due to dysregulated Notch signaling. We find that Nbs1 interacts with NICD-RBPJ, the effector of Notch signaling, and inhibits Notch activity. Genetic ablation or pharmaceutical inhibition of Notch signaling rescues the maturation and migration defects of Nbs1-deficient neurons in vitro and in vivo. Upregulation of Notch by Nbs1 deletion is independent of the key DDR downstream effector p53 and inactivation of each MRN component produces a different pattern of Notch activity and distinct neuronal defects. These data indicate that neuronal defects and aberrant Notch activity in Nbs1-deficient cells are unlikely to be a direct consequence of loss of MRN-mediated DDR function. This study discloses a novel function of NBS1 in crosstalk with the Notch pathway in neuron development.

Overview

The claims and statistics of this paper haven’t been checked yet.

Run the check — free, no account needed. It reads the open-access text and checks the sources it cites.

A few free checks a day · papers already verified open instantly · results are public

Integrity signals

Registry

Crossref · 10.1093/nar/gkaa716

Cites

5 of 5 references verified0 citation errors · 0 not checkable

Statistics

Figures

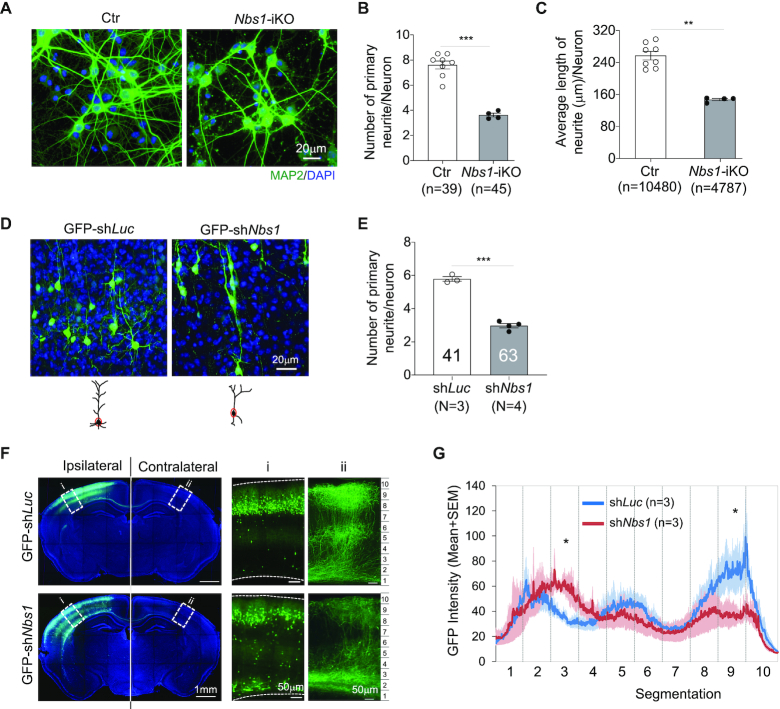
Figure 1. The deletion of Nbs1 inhibits neurite outgrowth. (A) In vitro cultured neurons (8dpo) of control (Ctr) or Nbs1 inducible deletion (Nbs1-iKO) genotypes (see Supplementary Figure S2a) were stained with the dendritic marker MAP2. Nbs1-iKO: Nbs1-CER (Nbs1f/f-CreERT2), with 4-OHT treatment. Controls include all genotypes without 4-OHT treatment or Nb1+/+ or Nbs1f/+ with 4-OHT treatment. (B, C) The number (B) and the average length (C) of neurites per neuron were quantified from the indicated number of neurons (n) from four animals of each genotype. n, the number of neurons analyzed. Data are mean ± SEM. Welch's t-test (for B) or Mann–Whitney test (for C) was used for statistical analysis. **P < 0.01, ***P < 0.001. (D) GFP+ cells after IUE at E15.5 (see Supplementary Figure S3a) in layers II/III of the cortex of postnatal days 26 (P26) mice are shown. (E) The number of primary neurites per neuron was quantified from three to four animals of each treatment. N: number of animals analyzed. The number of neurons analyzed is depicted within the bar. Data are mean ± SEM. Welch's t-test was used for statistical analysis. ***P < 0.001. (F) The whole cross sections of P16 brains after IUE at E15.5 were imaged by confocal microscopy and the GFP signal in selected areas (i, ii) are shown enlarged on the right. (G) The average GFP intensity in control (shLuc) and Nbs1 knockdown (shNbs1) brain in area (ii) of the contralateral cortex were quantified. Three to five sections from each of three animals were analyzed for each condition. Data are presented as Mean ± SEM. The contralateral cortex region was equally divided into ten segments for statistical analysis by two-way ANOVA with Holm-Sidak's multiple comparison test. *P < 0.05.
Figure 1. The deletion of Nbs1 inhibits neurite outgrowth. (A) In vitro cultured neurons (8dpo) of control (Ctr) or Nbs1 inducible deletion (Nbs1-iKO) genotypes (see Supplementary Figure S2a) were stained with the dendritic marker MAP2. Nbs1-iKO: Nbs1-CER (Nbs1f/f-CreERT2), with 4-OHT treatment. Controls include all genotypes without 4-OHT treatment or Nb1+/+ or Nbs1f/+ with 4-OHT treatment. (B, C) The number (B) and the average length (C) of neurites per neuron were quantified from the indicated number of neurons (n) from four animals of each genotype. n, the number of neurons analyzed. Data are mean ± SEM. Welch's t-test (for B) or Mann–Whitney test (for C) was used for statistical analysis. **P < 0.01, ***P < 0.001. (D) GFP+ cells after IUE at E15.5 (see Supplementary Figure S3a) in layers II/III of the cortex of postnatal days 26 (P26) mice are shown. (E) The number of primary neurites per neuron was quantified from three to four animals of each treatment. N: number of animals analyzed. The number of neurons analyzed is depicted within the bar. Data are mean ± SEM. Welch's t-test was used for statistical analysis. ***P < 0.001. (F) The whole cross sections of P16 brains after IUE at E15.5 were imaged by confocal microscopy and the GFP signal in selected areas (i, ii) are shown enlarged on the right. (G) The average GFP intensity in control (shLuc) and Nbs1 knockdown (shNbs1) brain in area (ii) of the contralateral cortex were quantified. Three to five sections from each of three animals were analyzed for each condition. Data are presented as Mean ± SEM. The contralateral cortex region was equally divided into ten segments for statistical analysis by two-way ANOVA with Holm-Sidak's multiple comparison test. *P < 0.05.CC BY-NC · PubMed Central
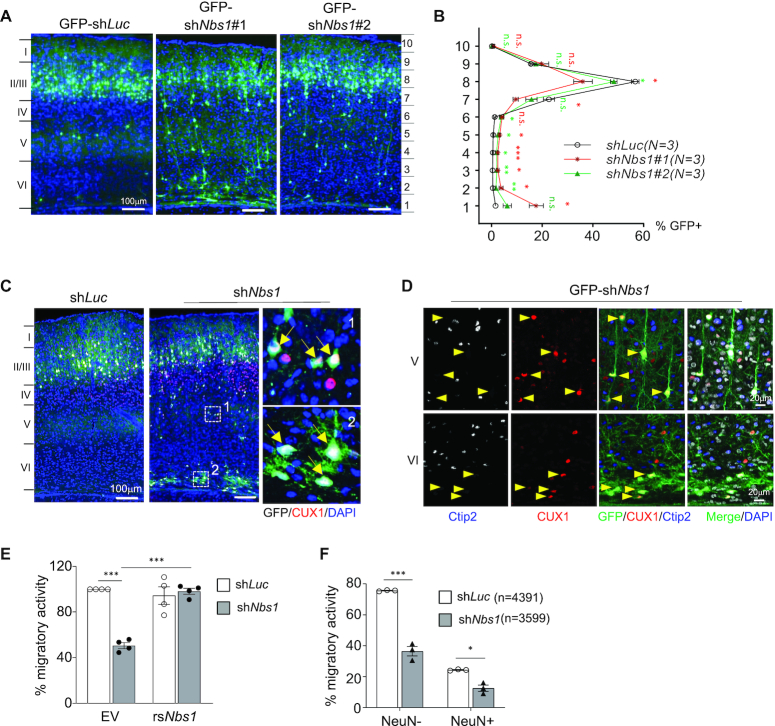
Figure 2. Nbs1 deficiency inhibits neuronal migration. (A) Brain sections of P16 mice electroporated with indicating GFP-shRNA vectors at E15.5 are shown. GFP-shLuc targeting luciferase is control and GFP-shNbs1#1 or shNbs1#2 targets Nbs1. (B) The brain cortex from (A) was equally divided into ten segments and the percentage of GFP+ cells from each segment quantified based on three to five sections from each of three (N) animals of each condition (right). Data are Mean ± SEM. Two-way ANOVA with Holm-Sidak's multiple comparison test was used for statistical analysis. *P < 0.05; **P < 0.01; ***P < 0.001; n.s. = not significant. (C) Cortical sections were imaged after staining with CUX1, a marker for recently born neurons. The right panels are enlargements of the indicated areas of shNbs1 images. Arrows indicate GFP+CUX1+ cells. (D) The layers V and VI of the cortex (C) are shown after staining with CUX1 and early-born neuronal marker Ctip2. Arrowheads indicate GFP+CUX1+Ctip2– cells. (E) In vitro transwell migration of Neuo2A cells after co-transfection with shLuc or shNbs1 together with GFP-empty vector (EV) or GFP-shNbs1-resistant Nbs1 (rsNbs1) vector. The migratory activity was analyzed 24 h after plating on the membrane. Data are Mean ± SEM of minimum three independent experiments. Statistical analysis was performed using Two-way ANOVA followed by Tukey's post-hoc test. ***P < 0.001. (F) Transwell migration assay of primary neurons from E17.5 cortex of embryos that were electroporated with indicated shRNA expression vectors at E15.5. The migratory activity was calculated as GFP+, or GFP and NeuN double-positive (GFP+NeuN+) cells among the number of DAPI positive cells counted (n). Data are mean ± SEM of at least three embryos. Statistical analysis was performed using two-way ANOVA followed by Tukey's post-hoc test. *P < 0.05, **P < 0.01, ***P < 0.001.
Figure 2. Nbs1 deficiency inhibits neuronal migration. (A) Brain sections of P16 mice electroporated with indicating GFP-shRNA vectors at E15.5 are shown. GFP-shLuc targeting luciferase is control and GFP-shNbs1#1 or shNbs1#2 targets Nbs1. (B) The brain cortex from (A) was equally divided into ten segments and the percentage of GFP+ cells from each segment quantified based on three to five sections from each of three (N) animals of each condition (right). Data are Mean ± SEM. Two-way ANOVA with Holm-Sidak's multiple comparison test was used for statistical analysis. *P < 0.05; **P < 0.01; ***P < 0.001; n.s. = not significant. (C) Cortical sections were imaged after staining with CUX1, a marker for recently born neurons. The right panels are enlargements of the indicated areas of shNbs1 images. Arrows indicate GFP+CUX1+ cells. (D) The layers V and VI of the cortex (C) are shown after staining with CUX1 and early-born neuronal marker Ctip2. Arrowheads indicate GFP+CUX1+Ctip2– cells. (E) In vitro transwell migration of Neuo2A cells after co-transfection with shLuc or shNbs1 together with GFP-empty vector (EV) or GFP-shNbs1-resistant Nbs1 (rsNbs1) vector. The migratory activity was analyzed 24 h after plating on the membrane. Data are Mean ± SEM of minimum three independent experiments. Statistical analysis was performed using Two-way ANOVA followed by Tukey's post-hoc test. ***P < 0.001. (F) Transwell migration assay of primary neurons from E17.5 cortex of embryos that were electroporated with indicated shRNA expression vectors at E15.5. The migratory activity was calculated as GFP+, or GFP and NeuN double-positive (GFP+NeuN+) cells among the number of DAPI positive cells counted (n). Data are mean ± SEM of at least three embryos. Statistical analysis was performed using two-way ANOVA followed by Tukey's post-hoc test. *P < 0.05, **P < 0.01, ***P < 0.001.CC BY-NC · PubMed Central
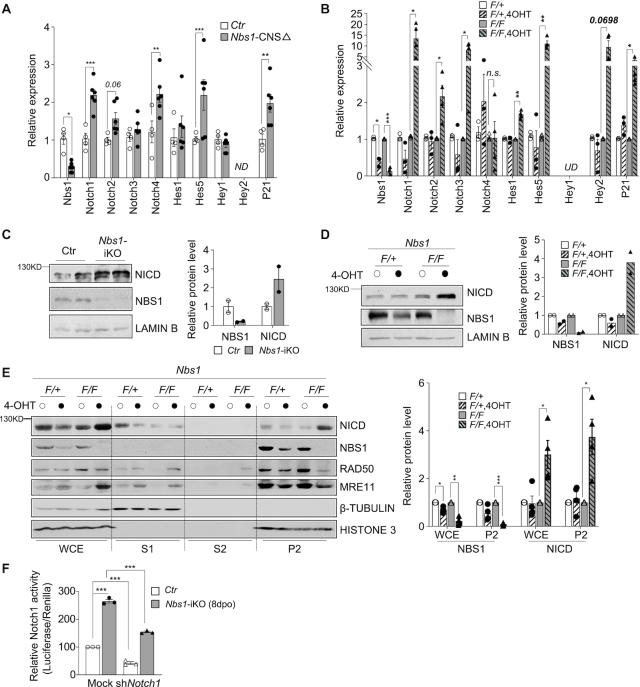
Figure 3. The deletion of Nbs1 elevates Notch signaling. (A, B) Real-Time-quantitative-PCR (qPCR) analyses of Notch receptors and their target genes after Nbs1 deletion. (A) RNA was isolated from cerebellar neurons of P26 Nbs1-CNSΔ and control mice. Data are Mean ± SEM from two repeat experiments of 2–3 animals of each genotype. (B) RNA was from one Nbs1+/f-CreERT2 (+/F) and two independent Nbs1f/f-CreERT2 (F/F) MEF cell lines after treatment with or without 4OHT for 4 days and analyzed at 8dpo. Data are mean ± SEM of 2–3 independent experiments. Two-way ANOVA followed by uncorrected Fisher's LSD test was used for statistical analysis. *P < 0.05; **P < 0.01; ***P < 0.001; n.s.: not significant; UD: undetectable, ND: not detected. (C, D) Western blot analysis of Notch protein in primary neurons (C) or in 8dpo MEFs (D) with the indicated antibodies. The Notch1 antibody detects NICD at ∼110 kDa. Lamin B is a loading control. Data are mean ± SD of the relative protein level after quantifying two animals of each genotype (C), or two repeats of two independent cell lines of each genotype (D). (E) Western blot analysis of cell fractionations prepared from Nbs1-iKO MEFs (8dpo) using the indicated antibodies. The Notch1 antibody detects NICD (∼110 kDa). Histone 3 and β-Tubulin were used to control the nuclear and cytoplasmic fractions, respectively. WCE: whole-cell extract; S1: soluble cytoplasmic fraction; S2: soluble nuclear fraction; P2: chromatin-bound fraction. +/F: Nbs1+/f-CreERT2, heterozygous of Nbs1 alleles; F/F: Nbs1f/f-CreERT2, homozygous of Nbs1 floxed alleles. The mean ± SEM of the relative protein level is from four independent experiments (right panel). Two-way ANOVA followed by uncorrected Fisher's LSD test was used for statistical analysis. *P < 0.05; **P < 0.01; ***P < 0.001. (F) Notch activity in Nbs1-deleted MEF cells. Control or Nbs1-iKO MEFs were co-transfected with the luciferase reporters together with empty vector (EV) or shNotch1 at 7dpo. Dual-luciferase assay was carried out 24 h after transfection. Data are mean ± SEM of three independent experiments. Two-way ANOVA followed by Tukey's post-hoc test was used for statistical analysis. ***P < 0.001.
Figure 3. The deletion of Nbs1 elevates Notch signaling. (A, B) Real-Time-quantitative-PCR (qPCR) analyses of Notch receptors and their target genes after Nbs1 deletion. (A) RNA was isolated from cerebellar neurons of P26 Nbs1-CNSΔ and control mice. Data are Mean ± SEM from two repeat experiments of 2–3 animals of each genotype. (B) RNA was from one Nbs1+/f-CreERT2 (+/F) and two independent Nbs1f/f-CreERT2 (F/F) MEF cell lines after treatment with or without 4OHT for 4 days and analyzed at 8dpo. Data are mean ± SEM of 2–3 independent experiments. Two-way ANOVA followed by uncorrected Fisher's LSD test was used for statistical analysis. *P < 0.05; **P < 0.01; ***P < 0.001; n.s.: not significant; UD: undetectable, ND: not detected. (C, D) Western blot analysis of Notch protein in primary neurons (C) or in 8dpo MEFs (D) with the indicated antibodies. The Notch1 antibody detects NICD at ∼110 kDa. Lamin B is a loading control. Data are mean ± SD of the relative protein level after quantifying two animals of each genotype (C), or two repeats of two independent cell lines of each genotype (D). (E) Western blot analysis of cell fractionations prepared from Nbs1-iKO MEFs (8dpo) using the indicated antibodies. The Notch1 antibody detects NICD (∼110 kDa). Histone 3 and β-Tubulin were used to control the nuclear and cytoplasmic fractions, respectively. WCE: whole-cell extract; S1: soluble cytoplasmic fraction; S2: soluble nuclear fraction; P2: chromatin-bound fraction. +/F: Nbs1+/f-CreERT2, heterozygous of Nbs1 alleles; F/F: Nbs1f/f-CreERT2, homozygous of Nbs1 floxed alleles. The mean ± SEM of the relative protein level is from four independent experiments (right panel). Two-way ANOVA followed by uncorrected Fisher's LSD test was used for statistical analysis. *P < 0.05; **P < 0.01; ***P < 0.001. (F) Notch activity in Nbs1-deleted MEF cells. Control or Nbs1-iKO MEFs were co-transfected with the luciferase reporters together with empty vector (EV) or shNotch1 at 7dpo. Dual-luciferase assay was carried out 24 h after transfection. Data are mean ± SEM of three independent experiments. Two-way ANOVA followed by Tukey's post-hoc test was used for statistical analysis. ***P < 0.001.CC BY-NC · PubMed Central
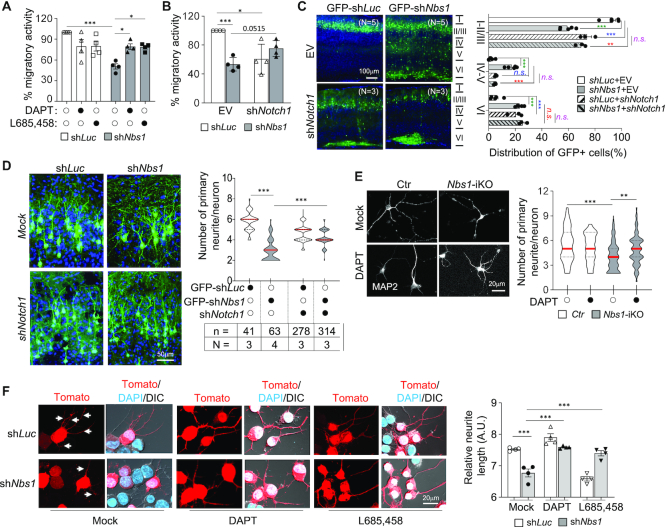
Figure 4. Inhibition of Notch signaling rescues the migration and neurite defects of Nbs1-deficient neural cells. (A, B) Blockage of Notch signaling by inhibitors (10μM of DAPT or L685, 458) (A) or shRNA targeting Notch1 (B) improves migration deficiency of N2A cells caused by shNbs1 knockdown. The migratory activity was analyzed 24 h after drug treatment or shRNA transfection. Data are Mean ± SEM from four independent experiments. Two-way ANOVA followed by Tukey's post-hoc test was used for statistical analysis. *P < 0.05; **P < 0.01; ***P < 0.001. (C) Rescue of the neuronal migration in vivo. Brain cortical sections from P16 mice after IUE with indicated plasmids at E15.5 were imaged by confocal microscopy. The distribution of GFP+ cells in indicated regions of the cortex was quantified (right). The mean ± SEM of the percentage of GFP+ cells in indicated regions from three to five animals is shown (right panel). N: number of mice analyzed. Two-way ANOVA followed by Tukey's post-hoc test was used for statistical analysis within marked corresponding layer group. *P < 0.05; ** or ##P < 0.01; *** or ### or $$$P < 0.001; n.s.: not significant. (D) Rescue of the neurite outgrowth in vivo. Brain cortical sections from P26 mice after IUE with indicated plasmids at E15.5 were imaged and GFP+ neurons in layers II/III of the cortex are presented (up penal). The mean ± SEM were quantified from indicated animals of each treatment. N: number of mice analyzed; n: number of neurons analyzed. One-way ANOVA followed by Dunnett's multiple comparisons test was used for statistical analysis. *P < 0.05; **P < 0.01; ***P < 0.001. (E) Inhibition of Notch signaling by DAPT ameliorates the arborization defects of Nbs1-iKO neurons. Primary neurons were isolated from two Nbs1+/f-CreERT2 (+/F) and two Nbs1f/f-CreERT2 (F/F) E15.5 embryonic brains and cultured with 4-OHT for four days. Cells were then treated with or without 10 μM of DAPT for another 4 days before analysis at 8dpo. The number of primary neurites (marked by MAP2) per neuron from 41∼131 neurons (from at least two animals) are shown (right panel). The Mean ± SEM is shown. One-way ANOVA followed by Dunnett's multiple comparisons test was used for statistical analysis. *P < 0.05; **P < 0.01; ***P < 0.001. (F) Inhibition of Notch activity corrects neurite outgrowth defects of shNbs1 knockdown N2A. N2A cells were transfected with Tomato-tagged shRNA against luciferase (shLuc) or Nbs1 (shNbs1). Cells were induced to neuronal differentiation by 2.5 mM cAMP in the presence or absence of Notch inhibitors (10 μM of DAPT or L685, 458) 12 h after transfection. Cells were imaged 24 h after differentiation induction and represented imaged (left). Quantification of the total length of neurites and the areas of cell clusters was acquired by the IncuCyte3 system. Arrows mark the neurites. Data are presented as mean ± SEM of the relative neurite length (dividing total length by areas of cell cluster) from four experiments (right panel). Two-way ANOVA followed by Tukey's post-hoc test was used for statistical analysis. ***P < 0.001.
Figure 4. Inhibition of Notch signaling rescues the migration and neurite defects of Nbs1-deficient neural cells. (A, B) Blockage of Notch signaling by inhibitors (10μM of DAPT or L685, 458) (A) or shRNA targeting Notch1 (B) improves migration deficiency of N2A cells caused by shNbs1 knockdown. The migratory activity was analyzed 24 h after drug treatment or shRNA transfection. Data are Mean ± SEM from four independent experiments. Two-way ANOVA followed by Tukey's post-hoc test was used for statistical analysis. *P < 0.05; **P < 0.01; ***P < 0.001. (C) Rescue of the neuronal migration in vivo. Brain cortical sections from P16 mice after IUE with indicated plasmids at E15.5 were imaged by confocal microscopy. The distribution of GFP+ cells in indicated regions of the cortex was quantified (right). The mean ± SEM of the percentage of GFP+ cells in indicated regions from three to five animals is shown (right panel). N: number of mice analyzed. Two-way ANOVA followed by Tukey's post-hoc test was used for statistical analysis within marked corresponding layer group. *P < 0.05; ** or ##P < 0.01; *** or ### or $$$P < 0.001; n.s.: not significant. (D) Rescue of the neurite outgrowth in vivo. Brain cortical sections from P26 mice after IUE with indicated plasmids at E15.5 were imaged and GFP+ neurons in layers II/III of the cortex are presented (up penal). The mean ± SEM were quantified from indicated animals of each treatment. N: number of mice analyzed; n: number of neurons analyzed. One-way ANOVA followed by Dunnett's multiple comparisons test was used for statistical analysis. *P < 0.05; **P < 0.01; ***P < 0.001. (E) Inhibition of Notch signaling by DAPT ameliorates the arborization defects of Nbs1-iKO neurons. Primary neurons were isolated from two Nbs1+/f-CreERT2 (+/F) and two Nbs1f/f-CreERT2 (F/F) E15.5 embryonic brains and cultured with 4-OHT for four days. Cells were then treated with or without 10 μM of DAPT for another 4 days before analysis at 8dpo. The number of primary neurites (marked by MAP2) per neuron from 41∼131 neurons (from at least two animals) are shown (right panel). The Mean ± SEM is shown. One-way ANOVA followed by Dunnett's multiple comparisons test was used for statistical analysis. *P < 0.05; **P < 0.01; ***P < 0.001. (F) Inhibition of Notch activity corrects neurite outgrowth defects of shNbs1 knockdown N2A. N2A cells were transfected with Tomato-tagged shRNA against luciferase (shLuc) or Nbs1 (shNbs1). Cells were induced to neuronal differentiation by 2.5 mM cAMP in the presence or absence of Notch inhibitors (10 μM of DAPT or L685, 458) 12 h after transfection. Cells were imaged 24 h after differentiation induction and represented imaged (left). Quantification of the total length of neurites and the areas of cell clusters was acquired by the IncuCyte3 system. Arrows mark the neurites. Data are presented as mean ± SEM of the relative neurite length (dividing total length by areas of cell cluster) from four experiments (right panel). Two-way ANOVA followed by Tukey's post-hoc test was used for statistical analysis. ***P < 0.001.CC BY-NC · PubMed Central
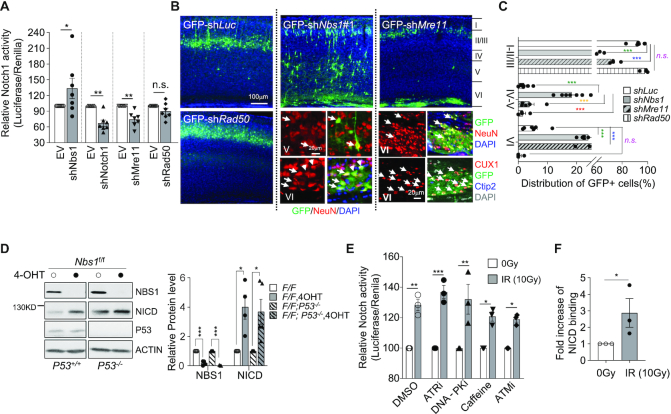
Figure 5. Distinct effects of MRN and DNA damage on Notch activity and neuronal development. (A) The effect of the MRN complex on Notch activity. The luciferase reporters were co-transfected with empty (EV) or indicated shRNA expression vectors into wild-type MEF cells. Dual-luciferase assay was carried out 24 h after transfection. Data are mean ± SEM of the relative activity from seven independent experiments. One-way ANOVA with Holm–Sidak's multiple comparison test was used for statistical analysis. *P < 0.05; **P < 0.01; n.s.: not significant. (B) Neuron migration after knockdown of the MRN complex. Cortical sections of P16 mice after IUE at E15.5 with indicated shRNA expression vectors are shown. High magnification of immunostained sections with neuron markers (NeuN, CUX1, Ctip2) are shown under respective images. Arrows mark the GFP+NeuN+ or GFP+CUX1+ cells. (C) The percentage of GFP+ cells in the indicated regions from 4∼7 sections of three animals of each treatment is shown (right panel). Layers of the cortex are marked I to VI in (B). Data are presented as mean ± SEM. Two-way ANOVA followed by Tukey's post-hoc test was used for statistical analysis within marked corresponding layer group. *P < 0.05; **P < 0.01; ***P < 0.001; n.s.: not significant. (D) Western blot analysis of Nbs1-iKO MEFs at 8dpo, (see Supplementary Figure S2a) in the p53+/+ or p53−/− background using the indicated antibodies. The Notch1 antibody detects NICD (∼110 kDa). Actin serves as a loading control. The mean ± SEM of the relative protein level from four independent experiments is shown (right panel). Two-way ANOVA followed by uncorrected Fisher's LSD test was used for statistical analysis. *P < 0.05; **P < 0.01; ***P < 0.001. (E) Notch activity analysis was carried out using MEF cells transfected with the luciferase reporter, 24 h before treatment with different kinase inhibitor (1.6 μM ATRi, 1.0 μM DNA-PKi, 5 mM caffeine, 10 μM ATMi). Cells were exposed to 10 Gy of IR 1 h after drug incubation. Dual-luciferase assay was carried out 1 h after IR treatment. Data are mean ± SEM of the relative activity from three independent experiments. One-way ANOVA with Holm-Sidak's multiple comparison test was used for statistical analysis. *P < 0.05; **P < 0.01; ***P < 0.001. (F) ChIP quantitative real-time PCR detection of binding of NICD to the Hes5 promoter after MEF cells were treated with 10 Gy of IR. The Notch1 antibody was used for the ChIP assay and rabbit IgG was used as a negative control. All data shown as fold increase of binding activity after normalization first to the input, then the ratio of NICD to IgG in IR untreated control samples, were used to calculate the fold change. The mean ± SEM of fold changes from three experiments is shown. Welch's t-test was used for statistical analysis. *P < 0.05.
Figure 5. Distinct effects of MRN and DNA damage on Notch activity and neuronal development. (A) The effect of the MRN complex on Notch activity. The luciferase reporters were co-transfected with empty (EV) or indicated shRNA expression vectors into wild-type MEF cells. Dual-luciferase assay was carried out 24 h after transfection. Data are mean ± SEM of the relative activity from seven independent experiments. One-way ANOVA with Holm–Sidak's multiple comparison test was used for statistical analysis. *P < 0.05; **P < 0.01; n.s.: not significant. (B) Neuron migration after knockdown of the MRN complex. Cortical sections of P16 mice after IUE at E15.5 with indicated shRNA expression vectors are shown. High magnification of immunostained sections with neuron markers (NeuN, CUX1, Ctip2) are shown under respective images. Arrows mark the GFP+NeuN+ or GFP+CUX1+ cells. (C) The percentage of GFP+ cells in the indicated regions from 4∼7 sections of three animals of each treatment is shown (right panel). Layers of the cortex are marked I to VI in (B). Data are presented as mean ± SEM. Two-way ANOVA followed by Tukey's post-hoc test was used for statistical analysis within marked corresponding layer group. *P < 0.05; **P < 0.01; ***P < 0.001; n.s.: not significant. (D) Western blot analysis of Nbs1-iKO MEFs at 8dpo, (see Supplementary Figure S2a) in the p53+/+ or p53−/− background using the indicated antibodies. The Notch1 antibody detects NICD (∼110 kDa). Actin serves as a loading control. The mean ± SEM of the relative protein level from four independent experiments is shown (right panel). Two-way ANOVA followed by uncorrected Fisher's LSD test was used for statistical analysis. *P < 0.05; **P < 0.01; ***P < 0.001. (E) Notch activity analysis was carried out using MEF cells transfected with the luciferase reporter, 24 h before treatment with different kinase inhibitor (1.6 μM ATRi, 1.0 μM DNA-PKi, 5 mM caffeine, 10 μM ATMi). Cells were exposed to 10 Gy of IR 1 h after drug incubation. Dual-luciferase assay was carried out 1 h after IR treatment. Data are mean ± SEM of the relative activity from three independent experiments. One-way ANOVA with Holm-Sidak's multiple comparison test was used for statistical analysis. *P < 0.05; **P < 0.01; ***P < 0.001. (F) ChIP quantitative real-time PCR detection of binding of NICD to the Hes5 promoter after MEF cells were treated with 10 Gy of IR. The Notch1 antibody was used for the ChIP assay and rabbit IgG was used as a negative control. All data shown as fold increase of binding activity after normalization first to the input, then the ratio of NICD to IgG in IR untreated control samples, were used to calculate the fold change. The mean ± SEM of fold changes from three experiments is shown. Welch's t-test was used for statistical analysis. *P < 0.05.CC BY-NC · PubMed Central
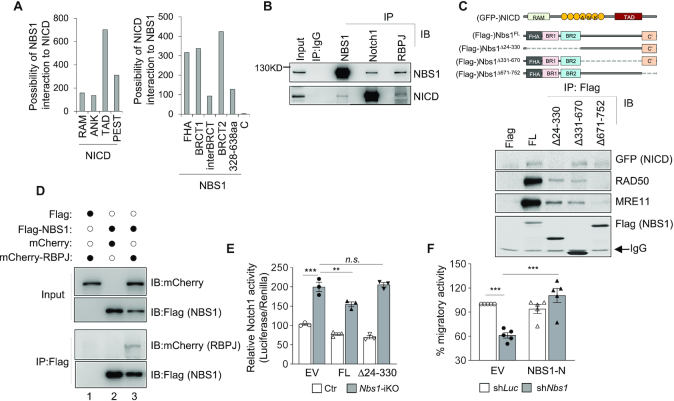
Figure 6. NBS1 interacts with NICD-RBPJ and suppresses NICD activity. (A) Prediction of inter-relationship between NBS1 and NICD. Co-evolution analysis was carried out by using amino acid sequences of NBS1 and NICD of Notch1 from different species. The potential of functional interaction between NBS1 and different domains of NICD (left panel), or between NICD and different domains of NBS1 (right panel) were scored. FHA: forkhead-associated domain; BRCT: BRCA1 C-Terminus domain; RAM: RBPJ-associated molecule domain; ANK: ankyrin repeats domain; TAD: transactivation domain; PEST: proline (P), glutamic acid (E), serine (S), and threonine (T) rich domain; BRCT: BRCA1 C-terminal domain; C’: C-terminus. (B) Co-immunoprecipitation (Co-IP) analysis of endogenous interaction between Nbs1 and NICD or RBPJ in HeLa cells. Antibodies used for IP and Immunoblotting (IB) are indicated. The Notch1 antibody detects NICD (∼110 kDa). Representative images of four experiments are shown. (C) Identification of the binding domains between Nbs1 and NICD by Co-IP. Schematic structures of functional domains of Nbs1 and NICD (upper panel) are shown. HEK293 cells were co-transfected with Flag-tagged full length or truncated mutants of Nbs1 together with GFP-tagged NICD. IP (IP:Flag) samples were used for immunoblot analysis with indicated antibodies (lower panel). FL: full length; Δ24–330: deletion of N-terminal amino acids 24–330; Δ331–670: deletion of mid-part amino acids 331–670; Δ671–752: deletion of C-terminal amino acids 671–752. Representative images from four experiments are shown. (D) mCherry-tagged RBPJ was co-transfected with Flag-Nbs1 or GFP-NICD into U2OS cells and a Co-IP assay was performed using indicated antibodies. Representative images from two experiments are shown. (E) Notch activity assay of wildtype (Ctr) or Nbs1-iKO MEF cells (7dpo) after co-transfection with the luciferase reporter and the GFP-tagged empty vector (EV) or the full length Nbs1FL (FL) or N-terminal deletion mutant Nbs1Δ24–330 (Δ24–330) vector. Reporter activity was measured 24 hr after transfection. Data are from three independent experiments. Data are Mean ± SEM of relative Notch activity from three independent experiments. Two-way ANOVA followed by Tukey's post-hoc test was used for statistical analysis. **P < 0.01; ***P < 0.001, n.s.: not significant. (F) Transwell migration assay of N2A cells after co-transfection with Tomato-tagged shRNA targeting luciferase (shLuc) or Nbs1 (shNbs1), together with GFP-empty vector (EV) or a GFP-shNbs1-resistant Nbs1-N terminus (Nbs1-N) plasmid. The migratory activity was analyzed 24 hr after plating cells on the membrane. Data are mean ± SEM of the relative migration activity from five independent experiments. Two-way ANOVA followed by Tukey's post-hoc test was used for statistical analysis. **P < 0.01; ***P < 0.001.
Figure 6. NBS1 interacts with NICD-RBPJ and suppresses NICD activity. (A) Prediction of inter-relationship between NBS1 and NICD. Co-evolution analysis was carried out by using amino acid sequences of NBS1 and NICD of Notch1 from different species. The potential of functional interaction between NBS1 and different domains of NICD (left panel), or between NICD and different domains of NBS1 (right panel) were scored. FHA: forkhead-associated domain; BRCT: BRCA1 C-Terminus domain; RAM: RBPJ-associated molecule domain; ANK: ankyrin repeats domain; TAD: transactivation domain; PEST: proline (P), glutamic acid (E), serine (S), and threonine (T) rich domain; BRCT: BRCA1 C-terminal domain; C’: C-terminus. (B) Co-immunoprecipitation (Co-IP) analysis of endogenous interaction between Nbs1 and NICD or RBPJ in HeLa cells. Antibodies used for IP and Immunoblotting (IB) are indicated. The Notch1 antibody detects NICD (∼110 kDa). Representative images of four experiments are shown. (C) Identification of the binding domains between Nbs1 and NICD by Co-IP. Schematic structures of functional domains of Nbs1 and NICD (upper panel) are shown. HEK293 cells were co-transfected with Flag-tagged full length or truncated mutants of Nbs1 together with GFP-tagged NICD. IP (IP:Flag) samples were used for immunoblot analysis with indicated antibodies (lower panel). FL: full length; Δ24–330: deletion of N-terminal amino acids 24–330; Δ331–670: deletion of mid-part amino acids 331–670; Δ671–752: deletion of C-terminal amino acids 671–752. Representative images from four experiments are shown. (D) mCherry-tagged RBPJ was co-transfected with Flag-Nbs1 or GFP-NICD into U2OS cells and a Co-IP assay was performed using indicated antibodies. Representative images from two experiments are shown. (E) Notch activity assay of wildtype (Ctr) or Nbs1-iKO MEF cells (7dpo) after co-transfection with the luciferase reporter and the GFP-tagged empty vector (EV) or the full length Nbs1FL (FL) or N-terminal deletion mutant Nbs1Δ24–330 (Δ24–330) vector. Reporter activity was measured 24 hr after transfection. Data are from three independent experiments. Data are Mean ± SEM of relative Notch activity from three independent experiments. Two-way ANOVA followed by Tukey's post-hoc test was used for statistical analysis. **P < 0.01; ***P < 0.001, n.s.: not significant. (F) Transwell migration assay of N2A cells after co-transfection with Tomato-tagged shRNA targeting luciferase (shLuc) or Nbs1 (shNbs1), together with GFP-empty vector (EV) or a GFP-shNbs1-resistant Nbs1-N terminus (Nbs1-N) plasmid. The migratory activity was analyzed 24 hr after plating cells on the membrane. Data are mean ± SEM of the relative migration activity from five independent experiments. Two-way ANOVA followed by Tukey's post-hoc test was used for statistical analysis. **P < 0.01; ***P < 0.001.CC BY-NC · PubMed Central

Verification

Claims the paper makes

The claims and statistics of this paper haven’t been checked yet.

Run the check — free, no account needed. It reads the open-access text and checks the sources it cites.

A few free checks a day · papers already verified open instantly · results are public

Claims other papers make about this one

Each is checked against this paper’s own text: does it say what the citing paper says it does?

Self-check

Percentages, sums and reported differences re-computed from the paper’s own numbers.

The self-check needs the paper’s full text.

Citations

Cites

Research works printed but not linked: 64

  1. Bruhn, 2014, The essential function of the MRN complex in the resolution of endogenous replication intermediates, Cell Rep., 6, 182, 10.1016/j.celrep.2013.12.018 · DOI
  2. Lee, 2004, Direct activation of the ATM protein kinase by the Mre11/Rad50/Nbs1 complex, Science, 304, 93, 10.1126/science.1091496 · DOI · Paper page
  3. Trujillo, 1998, Nuclease activities in a complex of human recombination and DNA repair factors Rad50, Mre11, and p95, J. Biol. Chem., 273, 21447, 10.1074/jbc.273.34.21447 · DOI
  4. Paull, 1998, The 3′ to 5′ exonuclease activity of Mre 11 facilitates repair of DNA double-strand breaks, Mol. Cell, 1, 969, 10.1016/S1097-2765(00)80097-0 · DOI
  5. Falck, 2005, Conserved modes of recruitment of ATM, ATR and DNA-PKcs to sites of DNA damage, Nature, 434, 605, 10.1038/nature03442 · DOI
  6. Berkovich, 2007, Roles of ATM and NBS1 in chromatin structure modulation and DNA double-strand break repair, Nat. Cell Biol., 9, 683, 10.1038/ncb1599 · DOI · Paper page
  7. Jazayeri, 2008, Mre11-Rad50-Nbs1-dependent processing of DNA breaks generates oligonucleotides that stimulate ATM activity, EMBO J., 27, 1953, 10.1038/emboj.2008.128 · DOI
  8. Kobayashi, 2013, NBS1 directly activates ATR independently of MRE11 and TOPBP1, Genes Cells, 18, 238, 10.1111/gtc.12031 · DOI
  9. Lee, 2013, The Mre11-Rad50-Nbs1 (MRN) complex has a specific role in the activation of Chk1 in response to stalled replication forks, Mol. Biol. Cell, 24, 1343, 10.1091/mbc.e13-01-0025 · DOI
  10. Shiotani, 2013, Two distinct modes of ATR activation orchestrated by Rad17 and Nbs1, Cell Rep., 3, 1651, 10.1016/j.celrep.2013.04.018 · DOI
  11. Xiao, 1997, Conditional gene targeted deletion by Cre recombinase demonstrates the requirement for the double-strand break repair Mre11 protein in murine embryonic stem cells, Nucleic Acids Res., 25, 2985, 10.1093/nar/25.15.2985 · DOI
  12. Dumon-Jones, 2003, Nbn heterozygosity renders mice susceptible to tumor formation and ionizing radiation-induced tumorigenesis, Cancer Res., 63, 7263
  13. Luo, 1999, Disruption of mRad50 causes embryonic stem cell lethality, abnormal embryonic development, and sensitivity to ionizing radiation, Proc. Natl. Acad. Sci. U.S.A., 96, 7376, 10.1073/pnas.96.13.7376 · DOI
  14. McKinnon, 2017, Genome integrity and disease prevention in the nervous system, Genes Dev., 31, 1180, 10.1101/gad.301325.117 · DOI
  15. Jackson, 2009, The DNA-damage response in human biology and disease, Nature, 461, 1071, 10.1038/nature08467 · DOI · Paper page
  16. Stiles, 2010, The basics of brain development, Neuropsychol. Rev., 20, 327, 10.1007/s11065-010-9148-4 · DOI · Paper page
  17. Kennedy, 2007, Self-organization and pattern formation in primate cortical networks, Novartis Found. Symp., 288, 178, 10.1002/9780470994030.ch13 · DOI
  18. Gupta, 2002, Life is a journey: a genetic look at neocortical development, Nat. Rev. Genet., 3, 342, 10.1038/nrg799 · DOI
  19. Rass, 2007, Defective DNA repair and neurodegenerative disease, Cell, 130, 991, 10.1016/j.cell.2007.08.043 · DOI · Paper page
  20. Frappart, 2005, An essential function for NBS1 in the prevention of ataxia and cerebellar defects, Nat. Med., 11, 538, 10.1038/nm1228 · DOI
  21. Zhou, 2012, Differential function of NBS1 and ATR in neurogenesis, DNA Repair (Amst.), 11, 210, 10.1016/j.dnarep.2011.10.021 · DOI
  22. Assaf, 2008, MRI evidence of white matter damage in a mouse model of Nijmegen breakage syndrome, Exp. Neurol., 209, 181, 10.1016/j.expneurol.2007.09.021 · DOI
  23. Dar, 2011, Investigation of the functional link between ATM and NBS1 in the DNA damage response in the mouse cerebellum, J. Biol. Chem., 286, 15361, 10.1074/jbc.M110.204172 · DOI
  24. Galron, 2011, Astrocyte dysfunction associated with cerebellar attrition in a Nijmegen breakage syndrome animal model, J. Mol. Neurosci., 45, 202, 10.1007/s12031-011-9494-6 · DOI
  25. Chrzanowska, 2012, Nijmegen breakage syndrome (NBS), Orphanet. J. Rare. Dis., 7, 13, 10.1186/1750-1172-7-13 · DOI
  26. Molyneaux, 2015, DeCoN: genome-wide analysis of in vivo transcriptional dynamics during pyramidal neuron fate selection in neocortex, Neuron, 85, 275, 10.1016/j.neuron.2014.12.024 · DOI
  27. Telley, 2019, Temporal patterning of apical progenitors and their daughter neurons in the developing neocortex, Science, 364, eaav2522, 10.1126/science.aav2522 · DOI · Paper page
  28. Zhou, 2010, PRMT5 regulates Golgi apparatus structure through methylation of the golgin GM130, Cell Res., 20, 1023, 10.1038/cr.2010.56 · DOI
  29. Kim, 2013, TopHat2: accurate alignment of transcriptomes in the presence of insertions, deletions and gene fusions, Genome Biol., 14, R36, 10.1186/gb-2013-14-4-r36 · DOI · Paper page
  30. Trapnell, 2012, Differential gene and transcript expression analysis of RNA-seq experiments with TopHat and Cufflinks, Nat. Protoc., 7, 562, 10.1038/nprot.2012.016 · DOI
  31. Livak, 2001, Analysis of relative gene expression data using real-time quantitative PCR and the 2(-Delta Delta C(T)) Method, Methods, 25, 402, 10.1006/meth.2001.1262 · DOI · Paper page
  32. Gruber, 2011, MCPH1 regulates the neuroprogenitor division mode by coupling the centrosomal cycle with mitotic entry through the Chk1-Cdc25 pathway, Nat. Cell Biol., 13, 1325, 10.1038/ncb2342 · DOI
  33. Huenniger, 2010, Notch1 signaling is mediated by importins alpha 3, 4, and 7, Cell. Mol. Life Sci., 67, 3187, 10.1007/s00018-010-0378-7 · DOI
  34. Fares, 2006, CAPS: coevolution analysis using protein sequences, Bioinformatics, 22, 2821, 10.1093/bioinformatics/btl493 · DOI
  35. Pool, 2008, NeuriteTracer: a novel ImageJ plugin for automated quantification of neurite outgrowth, J. Neurosci. Methods, 168, 134, 10.1016/j.jneumeth.2007.08.029 · DOI
  36. Finlay, 1995, Linked regularities in the development and evolution of mammalian brains, Science, 268, 1578, 10.1126/science.7777856 · DOI · Paper page
  37. Louvi, 2006, Notch signalling in vertebrate neural development, Nat. Rev. Neurosci., 7, 93, 10.1038/nrn1847 · DOI
  38. Bray, 2016, Notch signalling in context, Nat. Rev. Mol. Cell Biol., 17, 722, 10.1038/nrm.2016.94 · DOI · Paper page
  39. Giniger, 2012, Notch signaling and neural connectivity, Curr. Opin. Genet. Dev., 22, 339, 10.1016/j.gde.2012.04.003 · DOI
  40. Khodosevich, 2011, Signaling in migrating neurons: from molecules to networks, Front Neurosci., 5, 28, 10.3389/fnins.2011.00028 · DOI
  41. Ables, 2011, Not(ch) just development: Notch signalling in the adult brain, Nat. Rev. Neurosci., 12, 269, 10.1038/nrn3024 · DOI
  42. Yugawa, 2007, Regulation of Notch1 gene expression by p53 in epithelial cells, Mol. Cell. Biol., 27, 3732, 10.1128/MCB.02119-06 · DOI
  43. Lagadec, 2013, Radiation-induced Notch signaling in breast cancer stem cells, Int. J. Radiat. Oncol. Biol. Phys., 87, 609, 10.1016/j.ijrobp.2013.06.2064 · DOI
  44. Santini, 2014, ATM kinase activity modulates ITCH E3-ubiquitin ligase activity, Oncogene, 33, 1113, 10.1038/onc.2013.52 · DOI
  45. Kim, 2007, Tip60 histone acetyltransferase acts as a negative regulator of Notch1 signaling by means of acetylation, Mol. Cell. Biol., 27, 6506, 10.1128/MCB.01515-06 · DOI
  46. Yashiro-Ohtani, 2009, Pre-TCR signaling inactivates Notch1 transcription by antagonizing E2A, Genes Dev., 23, 1665, 10.1101/gad.1793709 · DOI
  47. Nedjic, 2010, RNA-binding proteins come out of the shadows, Nat. Immunol., 11, 697, 10.1038/ni0810-697 · DOI
  48. Kanner, 2018, Astrocytes restore connectivity and synchronization in dysfunctional cerebellar networks, Proc. Natl. Acad. Sci. U.S.A, 115, 8025, 10.1073/pnas.1718582115 · DOI
  49. Ciccia, 2010, The DNA damage response: making it safe to play with knives, Mol. Cell, 40, 179, 10.1016/j.molcel.2010.09.019 · DOI · Paper page
  50. Zhou, 2012, Differential function of NBS1 and ATR in neurogenesis, DNA Repair (Amst.), 11, 210, 10.1016/j.dnarep.2011.10.021 · DOI
  51. Adelman, 2009, Rad50 is dispensable for the maintenance and viability of postmitotic tissues, Mol. Cell. Biol., 29, 483, 10.1128/MCB.01525-08 · DOI
  52. Li, 2012, A distinct response to endogenous DNA damage in the development of Nbs1-deficient cortical neurons, Cell Res., 22, 859, 10.1038/cr.2012.3 · DOI
  53. Liu, 2015, The intracellular domains of Notch1 and Notch2 are functionally equivalent during development and carcinogenesis, Development, 142, 2452, 10.1242/dev.125492 · DOI
  54. Kopan, 2009, The canonical Notch signaling pathway: unfolding the activation mechanism, Cell, 137, 216, 10.1016/j.cell.2009.03.045 · DOI
  55. Yoon, 2005, Notch signaling in the mammalian central nervous system: insights from mouse mutants, Nat. Neurosci., 8, 709, 10.1038/nn1475 · DOI
  56. Berezovska, 1999, Notch1 inhibits neurite outgrowth in postmitotic primary neurons, Neuroscience, 93, 433, 10.1016/S0306-4522(99)00157-8 · DOI
  57. Jang, 2011, Acetyltransferase p300 regulates NBS1-mediated DNA damage response, FEBS Lett., 585, 47, 10.1016/j.febslet.2010.11.034 · DOI
  58. Oswald, 2005, RBP-Jkappa/SHARP recruits CtIP/CtBP corepressors to silence Notch target genes, Mol. Cell. Biol., 25, 10379, 10.1128/MCB.25.23.10379-10390.2005 · DOI
  59. Sato, 2012, An overview of notch signaling in adult tissue renewal and maintenance, Curr Alzheimer Res., 9, 227, 10.2174/156720512799361600 · DOI
  60. Barazzuol, 2017, A coordinated DNA damage response promotes adult quiescent neural stem cell activation, PLoS Biol., 15, e2001264, 10.1371/journal.pbio.2001264 · DOI
  61. Su, 2015, DNA damage and repair regulate neuronal gene expression, Cell Res., 25, 993, 10.1038/cr.2015.85 · DOI
  62. Arumugam, 2018, Notch signaling and neuronal death in stroke, Prog. Neurobiol., 165–167, 103, 10.1016/j.pneurobio.2018.03.002 · DOI
  63. Vermezovic, 2015, Notch is a direct negative regulator of the DNA-damage response, Nat. Struct. Mol. Biol., 22, 417, 10.1038/nsmb.3013 · DOI
  64. Adamowicz, 2016, NOTCH1 inhibits activation of ATM by impairing the formation of an ATM-FOXO3a-KAT5/Tip60 complex, Cell Rep., 16, 2068, 10.1016/j.celrep.2016.07.038 · DOI

Cited by

Sorted by citations

See all 20

Metadata

Authors
Zhou, Z.-W., Kirtay, M., Schneble, N., Yakoub, G., Ding, M., Rüdiger, T., Siniuk, K., Lu, R., Jiang, Y.-N., Li, T.-L., Kaether, C., Barzilai, A., & Wang, Z.-Q.
Affiliations
  • Leibniz Institute on Aging – Fritz Lipmann Institute (FLI), Jena, Germany
  • School of Medicine (Shenzhen), Sun Yat-Sen University, Guangzhou, China
  • Department of Neurobiology, George S. Wise Faculty of Life Sciences and Sagol School of Neuroscience, Tel Aviv University, Tel Aviv, Israel
Venue
Nucleic Acids Research
Published
2020-10-03
Volume
48
Issue
19
Pages
10924-10939
ISSN
  • 0305-1048
  • 1362-4962
Cited by
20
References
5
Language
en
Funders
  • DFG (WA2627/1-1, WA2627/5-1)
  • Leibniz Association (SAW2014, SAW2015)
  • German-Israel Foundation (I-1307-418.13/2015)
  • Natural Science Foundation of Guangdong Province (2019A1515010881)

About these checks

Registry, retraction, Cites and statistics results are computed, not judged, with one exception: a printed reference that no index lists is read once by a model before it counts as a citation error. Claims are extracted by a model and kept only when their quote appears verbatim in the text; each cited source is then checked, with a model’s help, for whether it says what the claim relies on. Those verdicts can be wrong — read the claim’s quote and the cited source before relying on one.

Statistics and arithmetic are recomputed, not judged.

Confidence bands are shown only for fields calibrated on our annotated test set. None is calibrated yet, so no band is shown.

What counts as a claim ›How we measure confidence ›How we check this ›

Are you an author, or do you see a problem with this page? Request a review