Cited by 208Single-cell and spatial transcriptomicsGene expression and cancer classificationGenomics and Chromatin Dynamics

The DOI matches its Crossref record; 29 of the 29 references it cites were found in a registry or an index.

SpaGE: Spatial Gene Enhancement using scRNA-seq

Open access

Published version of a preprint

Abstract

Single-cell technologies are emerging fast due to their ability to unravel the heterogeneity of biological systems. While scRNA-seq is a powerful tool that measures whole-transcriptome expression of single cells, it lacks their spatial localization. Novel spatial transcriptomics methods do retain cells spatial information but some methods can only measure tens to hundreds of transcripts. To resolve this discrepancy, we developed SpaGE, a method that integrates spatial and scRNA-seq datasets to predict whole-transcriptome expressions in their spatial configuration. Using five dataset-pairs, SpaGE outperformed previously published methods and showed scalability to large datasets. Moreover, SpaGE predicted new spatial gene patterns that are confirmed independently using in situ hybridization data from the Allen Mouse Brain Atlas.

Overview

The claims and statistics of this paper haven’t been checked yet.

Run the check — free, no account needed. It reads the open-access text and checks the sources it cites.

A few free checks a day · papers already verified open instantly · results are public

Integrity signals

Registry

Crossref · 10.1093/nar/gkaa740

Cites

29 of 29 references verified0 citation errors · 0 not checkable

Statistics

Figures

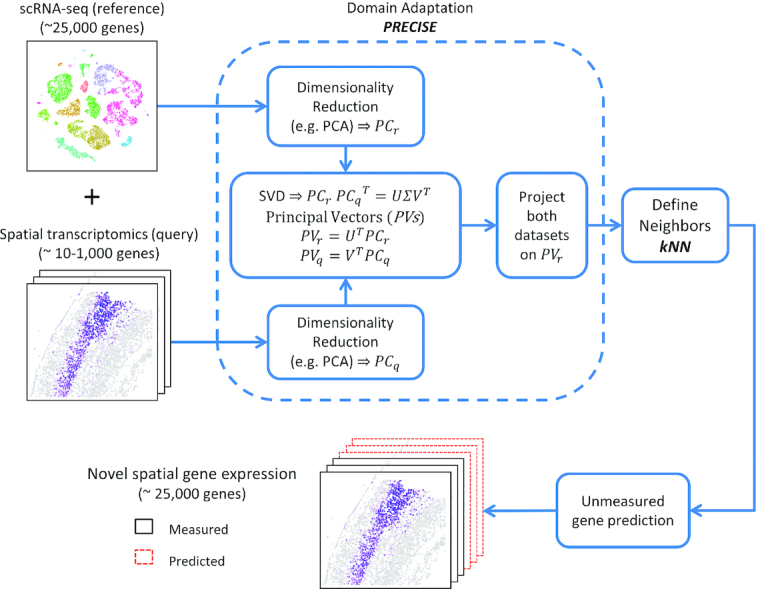
Figure 1. SpaGE pipeline. SpaGE takes as input two datasets, a scRNA-seq dataset and a spatial transcriptomics dataset measured from the same tissue. SpaGE uses gene combinations of equal significance in both datasets to predict spatial locations of unmeasured genes. Using PRECISE, SpaGE finds directions that are important for both datasets, by making use of a geometrical alignment of the independent PCs to produce the PVs. SpaGE aligns both datasets by projecting on the PVs of the reference dataset. Using the aligned datasets, SpaGE applies kNN prediction to define new gene expression patterns for spatially unmeasured genes, predicted from the dissociated scRNA-seq data. Each spatial cell can be enhanced by having the expression of the whole transcriptome.
Figure 1. SpaGE pipeline. SpaGE takes as input two datasets, a scRNA-seq dataset and a spatial transcriptomics dataset measured from the same tissue. SpaGE uses gene combinations of equal significance in both datasets to predict spatial locations of unmeasured genes. Using PRECISE, SpaGE finds directions that are important for both datasets, by making use of a geometrical alignment of the independent PCs to produce the PVs. SpaGE aligns both datasets by projecting on the PVs of the reference dataset. Using the aligned datasets, SpaGE applies kNN prediction to define new gene expression patterns for spatially unmeasured genes, predicted from the dissociated scRNA-seq data. Each spatial cell can be enhanced by having the expression of the whole transcriptome.CC BY-NC · PubMed Central
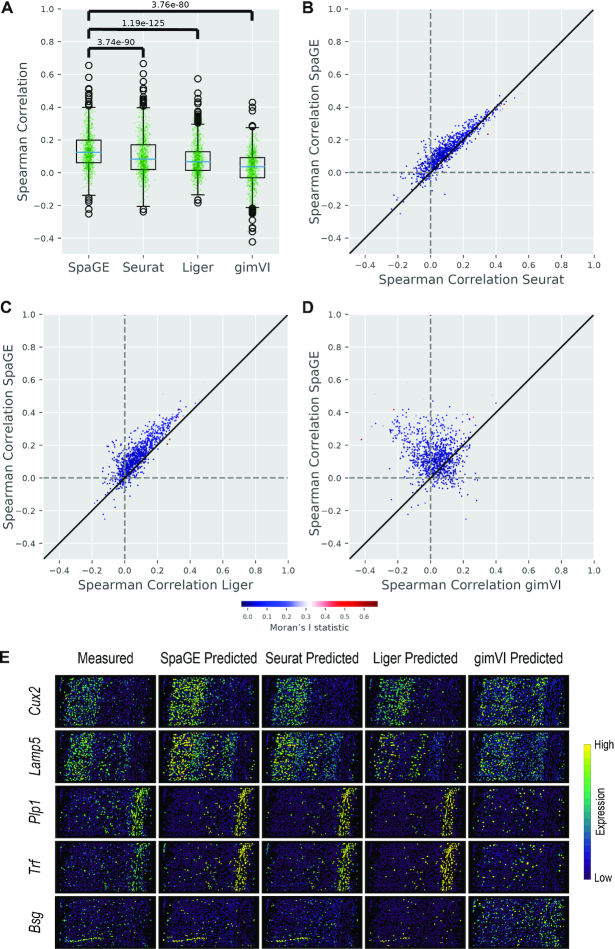
Figure 2. Prediction performance comparison for the STARmap_AllenVISp dataset pair. (A) Boxplots showing the Spearman correlations for the leave-one-gene-out cross validation experiment for each method. The blue lines show the median correlation across all genes with a better performance for SpaGE. The green dots show the correlation values for individual genes. The P-values show the significant difference between all correlation values of SpaGE and each other method, using a paired Wilcoxon rank-sum test. (B−D) Detailed performance comparison between SpaGE and (B) Seurat, (C) Liger, (D) gimVI. These scatter plots show the correlation value of each gene across two methods. The solid black line is the y = x line, the dashed lines show the zero correlation. Points are colored according to the Moran's I statistic of each gene. All scatter plots show that the majority of the genes are skewed above the y = x line, showing an overall better performance of SpaGE over other methods. (E) Predicted expression of known spatially patterned genes in the STARmap dataset. Each row corresponds to a single gene having a clear spatial pattern. First column from the left shows the measured spatial gene expression in the STARmap dataset, while other columns show the corresponding predicted expression pattern by SpaGE, Seurat, Liger and gimVI, using the leave-one-gene-out cross validation experiment. Prediction is performed using the AllenVISp dataset.
Figure 2. Prediction performance comparison for the STARmap_AllenVISp dataset pair. (A) Boxplots showing the Spearman correlations for the leave-one-gene-out cross validation experiment for each method. The blue lines show the median correlation across all genes with a better performance for SpaGE. The green dots show the correlation values for individual genes. The P-values show the significant difference between all correlation values of SpaGE and each other method, using a paired Wilcoxon rank-sum test. (B−D) Detailed performance comparison between SpaGE and (B) Seurat, (C) Liger, (D) gimVI. These scatter plots show the correlation value of each gene across two methods. The solid black line is the y = x line, the dashed lines show the zero correlation. Points are colored according to the Moran's I statistic of each gene. All scatter plots show that the majority of the genes are skewed above the y = x line, showing an overall better performance of SpaGE over other methods. (E) Predicted expression of known spatially patterned genes in the STARmap dataset. Each row corresponds to a single gene having a clear spatial pattern. First column from the left shows the measured spatial gene expression in the STARmap dataset, while other columns show the corresponding predicted expression pattern by SpaGE, Seurat, Liger and gimVI, using the leave-one-gene-out cross validation experiment. Prediction is performed using the AllenVISp dataset.CC BY-NC · PubMed Central
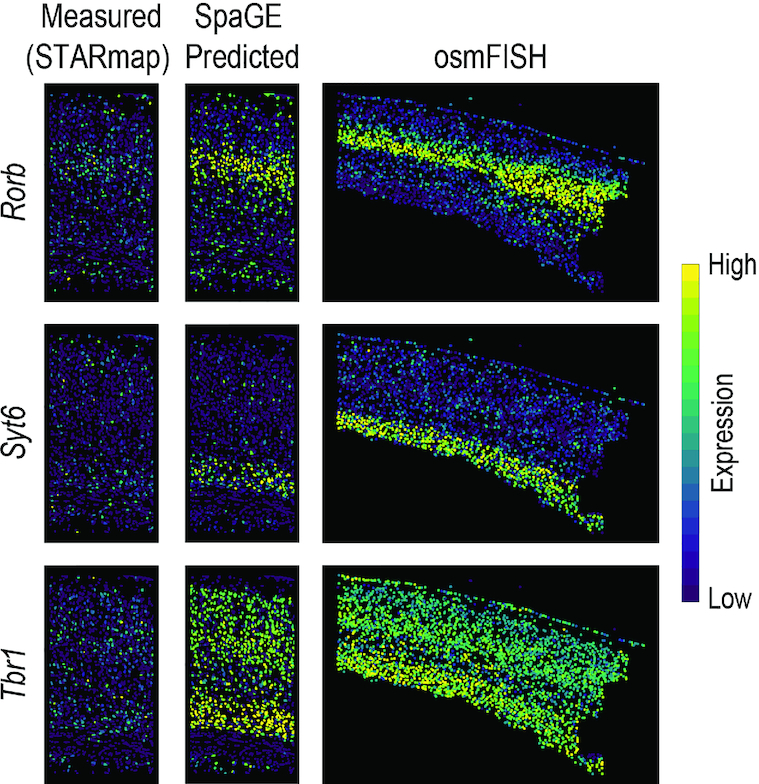
Figure 3. SpaGE accurately predicted the expression of Rorb, Syt6 and Tbr1 in agreement with the osmFISH data. These three genes (shown in rows) were wrongly measured in the original STARmap data (shown in the left column). Using the STARmap_AllenVISp dataset pair, SpaGE was able to reconstruct the correct spatial gene expression patterns (middle column). These predicted patterns are in agreement with the measured gene expression patterns measure by the osmFISH dataset (right column), a highly sensitive single-molecule technology.
Figure 3. SpaGE accurately predicted the expression of Rorb, Syt6 and Tbr1 in agreement with the osmFISH data. These three genes (shown in rows) were wrongly measured in the original STARmap data (shown in the left column). Using the STARmap_AllenVISp dataset pair, SpaGE was able to reconstruct the correct spatial gene expression patterns (middle column). These predicted patterns are in agreement with the measured gene expression patterns measure by the osmFISH dataset (right column), a highly sensitive single-molecule technology.CC BY-NC · PubMed Central
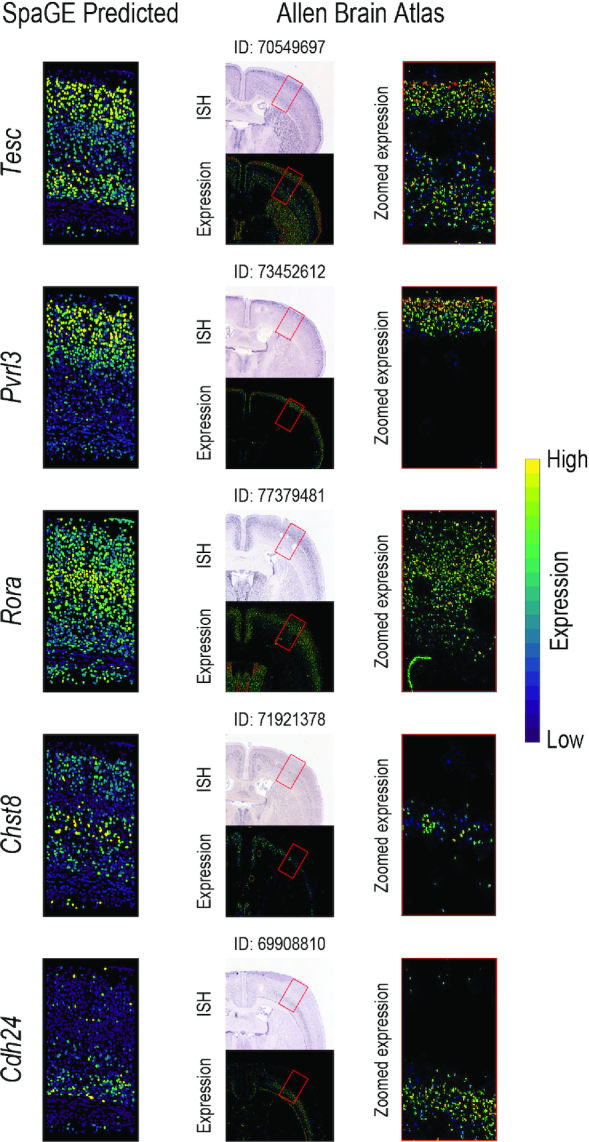
Figure 4. Novel gene expression patterns for five genes not originally measured by the STARmap dataset, validated using the Allen Brain Atlas in-situ hybridization ISH. The left column shows the predicted spatial patterns using SpaGE for these five genes (shown in rows). The middle column shows the Allen Brain Atlas ISH data for each gene, stating the image ID on top of each tissue section. The red rectangle highlights the corresponding brain region measured by the STARmap dataset. The right column shows a zoomed-in view of the region highlighted using this red rectangle, showing an agreement with the expression patterns predicted by SpaGE.
Figure 4. Novel gene expression patterns for five genes not originally measured by the STARmap dataset, validated using the Allen Brain Atlas in-situ hybridization ISH. The left column shows the predicted spatial patterns using SpaGE for these five genes (shown in rows). The middle column shows the Allen Brain Atlas ISH data for each gene, stating the image ID on top of each tissue section. The red rectangle highlights the corresponding brain region measured by the STARmap dataset. The right column shows a zoomed-in view of the region highlighted using this red rectangle, showing an agreement with the expression patterns predicted by SpaGE.CC BY-NC · PubMed Central
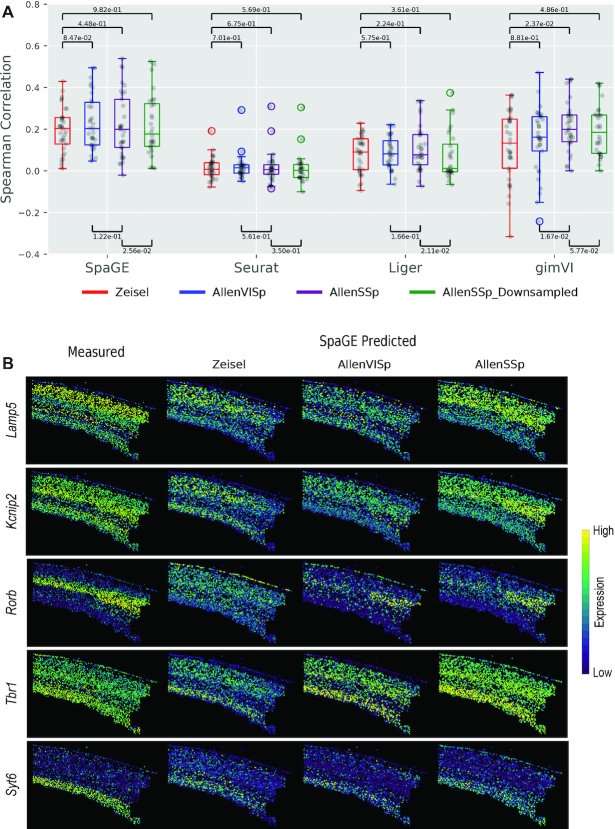
Figure 5. Prediction performance comparison for the osmFISH dataset using different reference scRNA-seq datasets. (A) Boxplots showing the Spearman correlations for the leave-one-gene-out cross validation experiment for each method using four different scRNA-seq datasets, Zeisel, AllenVISp, AllenSSp and AllenSSp_Downsampled. The median correlations shows a better performance for SpaGE in all dataset pairs. The black dots show the correlation values for individual genes. The P-values are obtained using a paired Wilcoxon rank-sum test. SpaGE showed a performance improvement when using the AllenVISp over the Zeisel data. Although the median correlation is the same, the overall correlation range did improve. Also, gimVI clearly benefits from using the AllenVISp and the AllenSSp datasets over the Zeisel dataset. All methods have decreased performance when using the AllenSSp_Downsampled data compared to the original AllenSSp data. (B) Predicted expression of known spatially patterned genes in the osmFISH dataset using different reference scRNA-seq datasets. Each row corresponds to a single gene having a clear spatial pattern. First column from the left shows the measured spatial gene expression in the osmFISH dataset, while the second, third and fourth columns show the corresponding predicted expression pattern by SpaGE using Zeisel, AllenVISp and AllenSSp datasets, respectively. Changing from Zeisel to AllenVISp (deeply sequenced data) improved the prediction, while matching the brain region using the AllenSSp improved the prediction further.
Figure 5. Prediction performance comparison for the osmFISH dataset using different reference scRNA-seq datasets. (A) Boxplots showing the Spearman correlations for the leave-one-gene-out cross validation experiment for each method using four different scRNA-seq datasets, Zeisel, AllenVISp, AllenSSp and AllenSSp_Downsampled. The median correlations shows a better performance for SpaGE in all dataset pairs. The black dots show the correlation values for individual genes. The P-values are obtained using a paired Wilcoxon rank-sum test. SpaGE showed a performance improvement when using the AllenVISp over the Zeisel data. Although the median correlation is the same, the overall correlation range did improve. Also, gimVI clearly benefits from using the AllenVISp and the AllenSSp datasets over the Zeisel dataset. All methods have decreased performance when using the AllenSSp_Downsampled data compared to the original AllenSSp data. (B) Predicted expression of known spatially patterned genes in the osmFISH dataset using different reference scRNA-seq datasets. Each row corresponds to a single gene having a clear spatial pattern. First column from the left shows the measured spatial gene expression in the osmFISH dataset, while the second, third and fourth columns show the corresponding predicted expression pattern by SpaGE using Zeisel, AllenVISp and AllenSSp datasets, respectively. Changing from Zeisel to AllenVISp (deeply sequenced data) improved the prediction, while matching the brain region using the AllenSSp improved the prediction further.CC BY-NC · PubMed Central
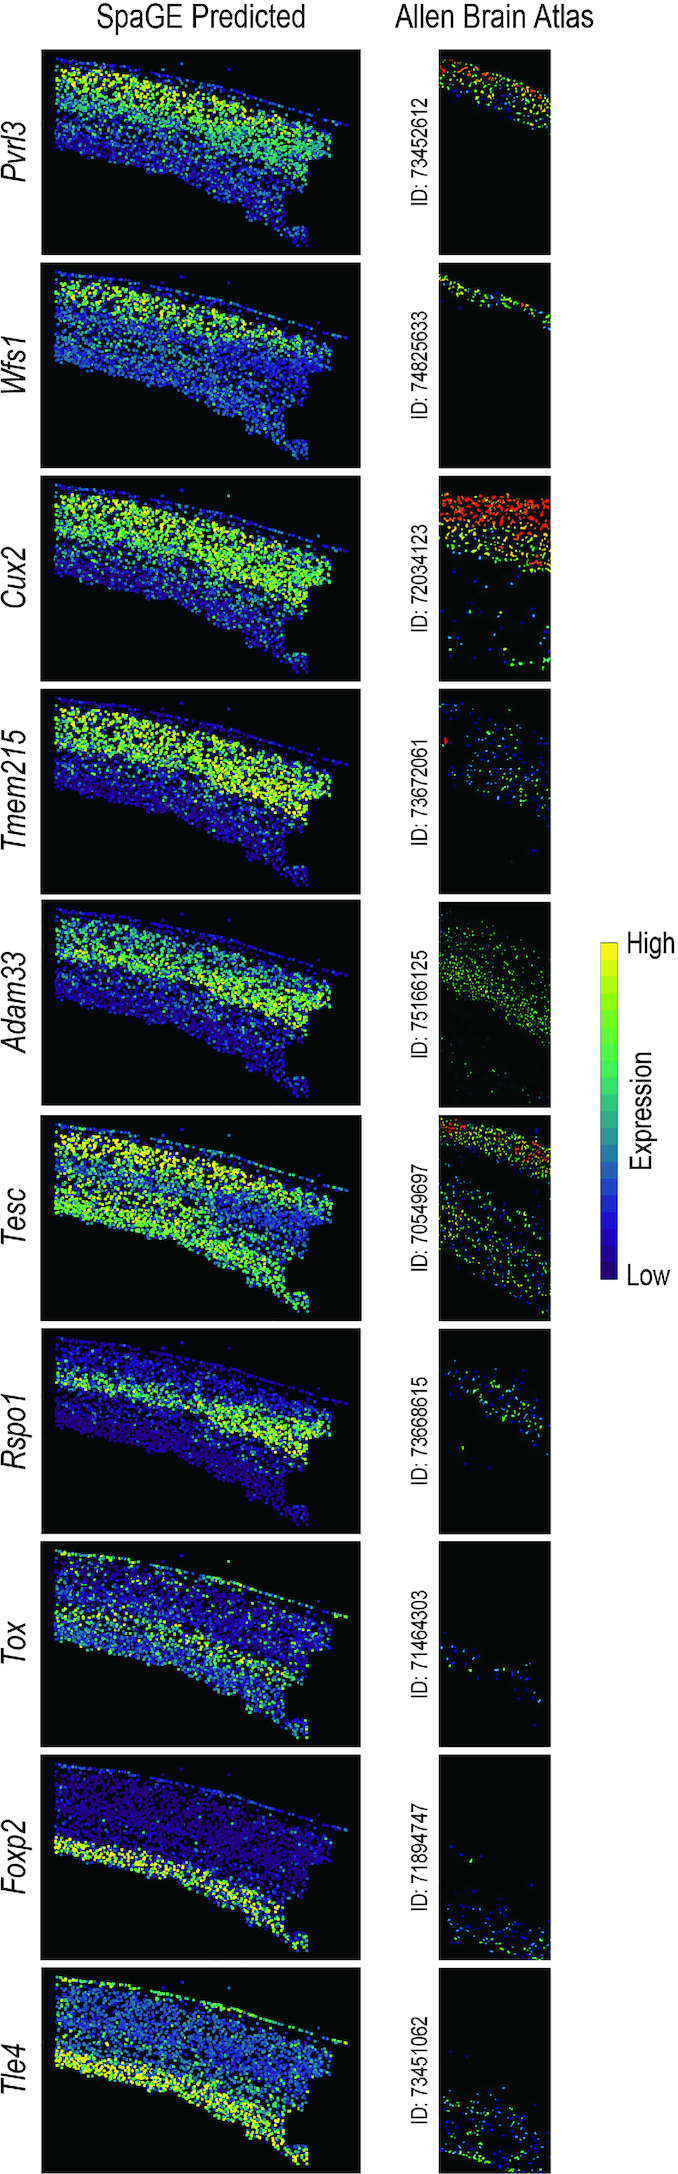
Figure 6. Novel gene expression patterns for 10 genes not originally measured by the osmFISH dataset, validated using the Allen Brain Atlas in-situ hybridization ISH. The left column shows the predicted spatial patterns using SpaGE for these 10 genes (shown in rows). The right column shows the Allen Brain Atlas ISH expression for each gene, stating the image ID next to the tissue section, showing an agreement with the expression patterns predicted by SpaGE. These genes show clear expression to specific cortical layers (Pvrl3 and Wfs1: layer 2/3; Cux2, Tmem215 and Adam33: layer 2/3 and layer 4; Rspo1: layer 4; Tesc: layer 2/3 and layer 6; Tox: layer 5; Foxp2 and Tle4: layer 6).
Figure 6. Novel gene expression patterns for 10 genes not originally measured by the osmFISH dataset, validated using the Allen Brain Atlas in-situ hybridization ISH. The left column shows the predicted spatial patterns using SpaGE for these 10 genes (shown in rows). The right column shows the Allen Brain Atlas ISH expression for each gene, stating the image ID next to the tissue section, showing an agreement with the expression patterns predicted by SpaGE. These genes show clear expression to specific cortical layers (Pvrl3 and Wfs1: layer 2/3; Cux2, Tmem215 and Adam33: layer 2/3 and layer 4; Rspo1: layer 4; Tesc: layer 2/3 and layer 6; Tox: layer 5; Foxp2 and Tle4: layer 6).CC BY-NC · PubMed Central
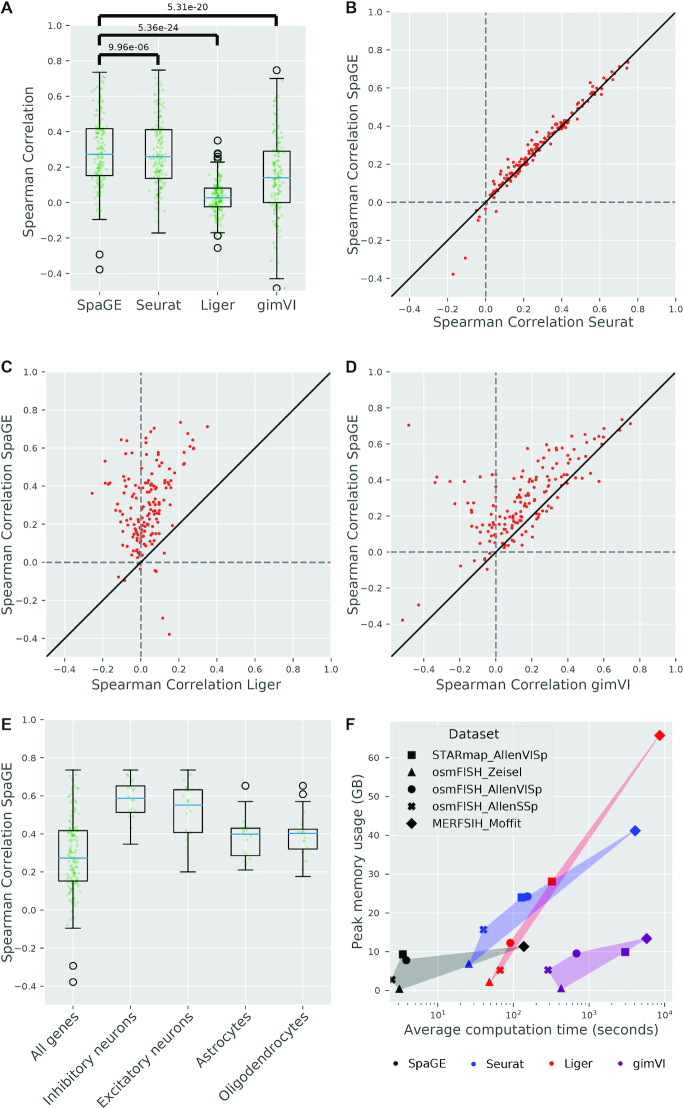
Figure 7. Prediction performance comparison for the MERFISH_Moffit dataset pair. (A) Boxplots showing the Spearman correlations for the leave-one-gene-out cross validation experiment for each method. The blue lines show the median correlation across all genes with a better performance for SpaGE. The green dots show the correlation values for individual genes. The P-values show the significant difference between all correlation values of SpaGE and each other method, using a paired Wilcoxon rank-sum test. (B–D) Detailed performance comparison between SpaGE and (B) Seurat, (C) Liger, (D) gimVI. These scatter plots show the correlation value of each gene across two methods. The solid black line is the y = x line, the dashed lines show the zero correlation. All scatter plots show that the majority of the genes are skewed above the y = x line, showing an overall better performance of SpaGE over other methods. (E) Boxplots showing the prediction performance of SpaGE for cell type marker genes compared to the overall performance across all genes. (F) scatter plot showing the average computation time (log-scaled) per gene versus the peak memory usage. Methods are represented with different colors and dataset pairs are represented with different symbols. Points of the same method are highlighted for clarity.
Figure 7. Prediction performance comparison for the MERFISH_Moffit dataset pair. (A) Boxplots showing the Spearman correlations for the leave-one-gene-out cross validation experiment for each method. The blue lines show the median correlation across all genes with a better performance for SpaGE. The green dots show the correlation values for individual genes. The P-values show the significant difference between all correlation values of SpaGE and each other method, using a paired Wilcoxon rank-sum test. (B–D) Detailed performance comparison between SpaGE and (B) Seurat, (C) Liger, (D) gimVI. These scatter plots show the correlation value of each gene across two methods. The solid black line is the y = x line, the dashed lines show the zero correlation. All scatter plots show that the majority of the genes are skewed above the y = x line, showing an overall better performance of SpaGE over other methods. (E) Boxplots showing the prediction performance of SpaGE for cell type marker genes compared to the overall performance across all genes. (F) scatter plot showing the average computation time (log-scaled) per gene versus the peak memory usage. Methods are represented with different colors and dataset pairs are represented with different symbols. Points of the same method are highlighted for clarity.CC BY-NC · PubMed Central
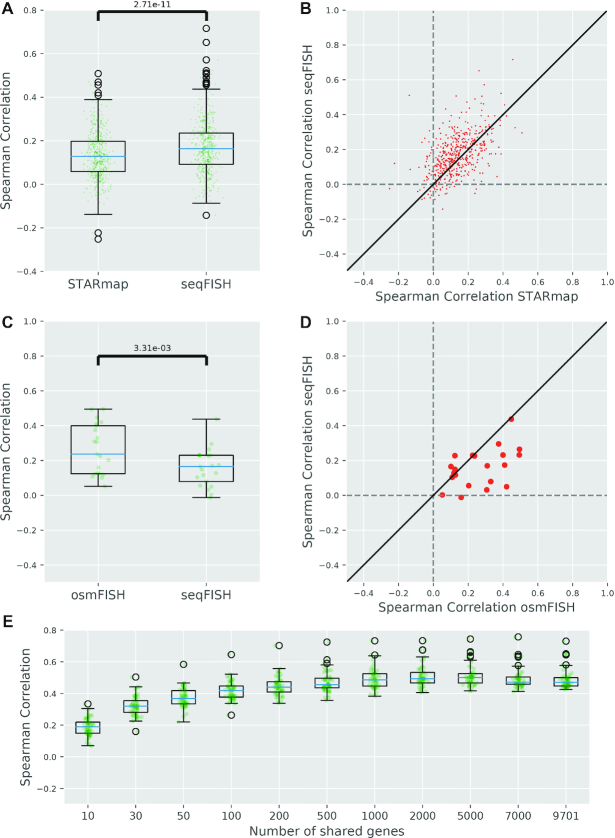
Figure 8. Prediction performance of SpaGE for the seqFISH_AllenVISp dataset pair. (A,C) Boxplots comparing the prediction performance of SpaGE for the shared genes between the seqFISH and the (A) STARmap, (C) osmFISH datasets, using the same AllenVISp dataset as reference during prediction. The blue lines show the median correlation across all genes. The green dots show the correlation values for individual genes. The P-value is obtained using a paired Wilcoxon rank-sum test. (B, D) Detailed performance comparison between seqFISH and (B) STARmap, (D) osmFISH. These scatter plots show the correlation value of each gene across two datasets. The solid black line is the y = x line, the dashed lines show the zero correlation. (E) Boxplots showing the prediction performance of a test set of 50 genes, in terms of Spearman Rank correlations, using downsampled sets of 10, 30, 50, 100, 200, 500, 1000, 2000, 5000 and 7000 shared genes compared to using all 9,701 genes in the seqFISH_AllenVISp dataset pair.
Figure 8. Prediction performance of SpaGE for the seqFISH_AllenVISp dataset pair. (A,C) Boxplots comparing the prediction performance of SpaGE for the shared genes between the seqFISH and the (A) STARmap, (C) osmFISH datasets, using the same AllenVISp dataset as reference during prediction. The blue lines show the median correlation across all genes. The green dots show the correlation values for individual genes. The P-value is obtained using a paired Wilcoxon rank-sum test. (B, D) Detailed performance comparison between seqFISH and (B) STARmap, (D) osmFISH. These scatter plots show the correlation value of each gene across two datasets. The solid black line is the y = x line, the dashed lines show the zero correlation. (E) Boxplots showing the prediction performance of a test set of 50 genes, in terms of Spearman Rank correlations, using downsampled sets of 10, 30, 50, 100, 200, 500, 1000, 2000, 5000 and 7000 shared genes compared to using all 9,701 genes in the seqFISH_AllenVISp dataset pair.CC BY-NC · PubMed Central

Verification

Claims the paper makes

The claims and statistics of this paper haven’t been checked yet.

Run the check — free, no account needed. It reads the open-access text and checks the sources it cites.

A few free checks a day · papers already verified open instantly · results are public

Claims other papers make about this one

Each is checked against this paper’s own text: does it say what the citing paper says it does?

Self-check

Percentages, sums and reported differences re-computed from the paper’s own numbers.

The self-check needs the paper’s full text.

Citations

Cites

Show all 29 references

Cited by

Sorted by citations

See all 208

Metadata

Authors
Abdelaal, T., Mourragui, S., Mahfouz, A., & Reinders, M. J. T.
Affiliations
  • Leiden University Medical Center (NL)
  • The Netherlands Cancer Institute (NL)
Corresponding author
Reinders, Marcel J T
Venue
Nucleic Acids Research
Published
2020-09-21
Volume
48
Issue
18
Pages
e107-e107
ISSN
  • 0305-1048 (ISSN-L)
  • 1362-4962
OpenAlex
W3087138957
Cited by
207
References
29
Citations by year
2026: 27 · 2025: 44 · 2024: 55 · 2023: 33 · 2022: 30 · 2021: 17 · 2020: 1
FWCI
6.56
Type
journal article
Language
en
Open access
Locations
  • Nucleic Acids Research (publishedVersion, cc-by-nc)
  • bioRxiv (Cold Spring Harbor Laboratory) (acceptedVersion, cc-by-nc)
  • PubMed Central (publishedVersion, cc-by-nc)
  • PubMed (publishedVersion)
  • Data Archiving and Networked Services (DANS) (submittedVersion, other-oa)
  • Data Archiving and Networked Services (DANS) (submittedVersion, cc-by-nc)
  • Leiden Repository (Leiden University) (submittedVersion, cc-by-nc)
  • Research Repository (Delft University of Technology) (submittedVersion, cc-by-nc)
Funders
  • European Commission (675743)
  • H2020 (861190)
  • NWO TTW (17126)
  • ZonMw (40-00812-98-16012)
  • PPP allowance
Topics
  • Life Sciences › Biochemistry, Genetics and Molecular Biology › Molecular Biology › Single-cell and spatial transcriptomics
  • Life Sciences › Biochemistry, Genetics and Molecular Biology › Molecular Biology › Gene expression and cancer classification
  • Life Sciences › Biochemistry, Genetics and Molecular Biology › Molecular Biology › Genomics and Chromatin Dynamics
Keywords
spatial transcriptomics, single-cell RNA sequencing, spatial gene expression prediction, Allen Mouse Brain Atlas
MeSH terms
RNA-Seq, Animals, Software, Databases, Genetic, Mice, Single-Cell Analysis, Transcriptome, Datasets as Topic

About these checks

Registry, retraction, Cites and statistics results are computed, not judged, with one exception: a printed reference that no index lists is read once by a model before it counts as a citation error. Claims are extracted by a model and kept only when their quote appears verbatim in the text; each cited source is then checked, with a model’s help, for whether it says what the claim relies on. Those verdicts can be wrong — read the claim’s quote and the cited source before relying on one.

Statistics and arithmetic are recomputed, not judged.

Confidence bands are shown only for fields calibrated on our annotated test set. None is calibrated yet, so no band is shown.

What counts as a claim ›How we measure confidence ›How we check this ›

Are you an author, or do you see a problem with this page? Request a review