

The DOI matches its Crossref record; 49 of the 50 references it cites were found in a registry or an index.
Deep sequencing-based expression analysis shows major advances in robustness, resolution and inter-lab portability over five microarray platforms.
Open accessAbstract
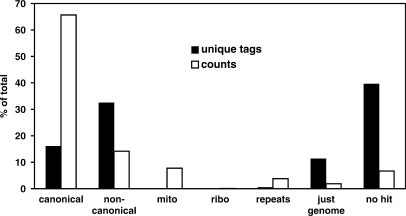
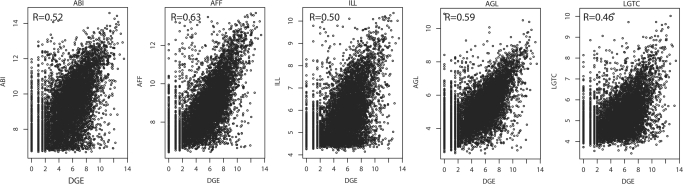
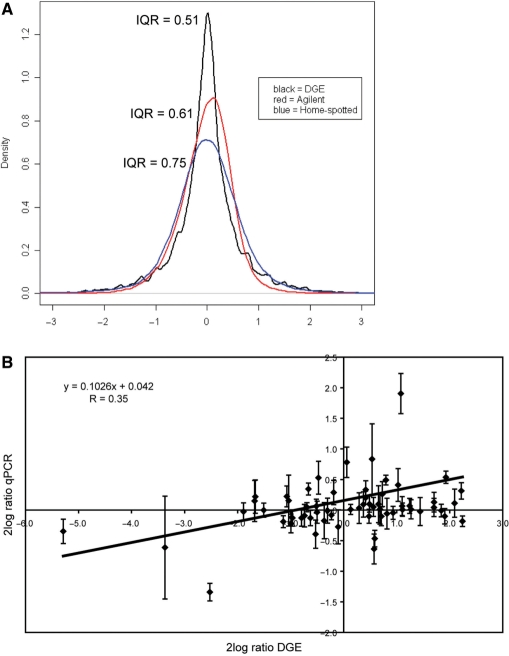
The hippocampal expression profiles of wild-type mice and mice transgenic for deltaC-doublecortin-like kinase were compared with Solexa/Illumina deep sequencing technology and five different microarray platforms. With Illumina's digital gene expression assay, we obtained approximately 2.4 million sequence tags per sample, their abundance spanning four orders of magnitude. Results were highly reproducible, even across laboratories. With a dedicated Bayesian model, we found differential expression of 3179 transcripts with an estimated false-discovery rate of 8.5%. This is a much higher figure than found for microarrays. The overlap in differentially expressed transcripts found with deep sequencing and microarrays was most significant for Affymetrix. The changes in expression observed by deep sequencing were larger than observed by microarrays or quantitative PCR. Relevant processes such as calmodulin-dependent protein kinase activity and vesicle transport along microtubules were found affected by deep sequencing but not by microarrays. While undetectable by microarrays, antisense transcription was found for 51% of all genes and alternative polyadenylation for 47%. We conclude that deep sequencing provides a major advance in robustness, comparability and richness of expression profiling data and is expected to boost collaborative, comparative and integrative genomics studies.
Overview
The claims and statistics of this paper haven’t been checked yet.
Free: it reads the open-access text and checks the first 5 claims that cite a source we can check. Create a free account to check every claim.
Integrity signals
Registry
Cites
Statistics
Figures

Verification
Claims the paper makes
The claims and statistics of this paper haven’t been checked yet.
Free: it reads the open-access text and checks the first 5 claims that cite a source we can check. Create a free account to check every claim.
Claims other papers make about this one
Each is checked against this paper’s own text: does it say what the citing paper says it does?
The cited source doesn’t support the claim as written.
In the citing paper
“DGE can eliminate background signals caused by cross-hybridization and share a higher consistence with qPCR than other platforms [62].”
From Digital Gene Expression Analysis Based on Integrated De Novo Transcriptome Assembly of Sweet Potato [Ipomoea batatas (L.) Lam.] (2012) · cites this paper as [62]
Checked by a reasoning model — may be wrong.
Experimental — accuracy not yet measuredThe source backs part of the claim, not all of it — or backs it for a different population, condition or comparison.
In the citing paper
“Comparing with other genome-wide microarray expression profiling platforms, deep sequencing-based expression analysis does not need laborious and costly cloning and sequencing steps [62].”
From Digital Gene Expression Analysis Based on Integrated De Novo Transcriptome Assembly of Sweet Potato [Ipomoea batatas (L.) Lam.] (2012) · cites this paper as [62]
Experimental — accuracy not yet measuredThe cited source says what the claim attributes to it.
In the citing paper
“The transcriptome differences of the seven tissues (including roots at different developmental stages) were characterized using Illumina DGE technology, which is essentially an improved version of MPSS [61], [62].”
From Digital Gene Expression Analysis Based on Integrated De Novo Transcriptome Assembly of Sweet Potato [Ipomoea batatas (L.) Lam.] (2012) · cites this paper as [62]
The cited source says what the claim attributes to it.
In the citing paper
“Differences in mRNA abundance values determined using different methods (qRT-PCR and microarrays) have been described previously444546.”
From Human cellular CYBA UTR sequences increase mRNA translation without affecting the half-life of recombinant RNA transcripts (2016) · cites this paper as [45]
Self-check
Percentages, sums and reported differences re-computed from the paper’s own numbers.
The self-check needs the paper’s full text.
Citations
Cites
Mapping and quantifying mammalian transcriptomes by RNA-Seq
Mortazavi, A., Williams, B. A., McCue, K., Schaeffer, L., & Wold, B. (2008) · Nature Methods · doi:10.1038/nmeth.1226 · Cited by 13,696 · cited 1×
“larger group of samples: We demonstrate that 2 million tags are required to reliably detect low abundant genes with DGE, whereas RNASeq requires at least 20 million tags per sample to obtain reasonable coverage of most transcripts (29,36).”
BackgroundGenome sequencing in microfabricated high-density picolitre reactors
Margulies, M., Egholm, M., Altman, W. E., Attiya, S., Bader, J. S., Bemben, L. A., Berka, J., Braverman, M. S., Chen, Y.-J., Chen, Z., et al. (2005) · Nature · doi:10.1038/nature03959 · Cited by 7,693
limma: Linear Models for Microarray Data
Smyth, G. K. (2005) · Statistics for Biology and Health · doi:10.1007/0-387-29362-0_23 · Cited by 5,796
Bioinformatics and Computational Biology Solutions Using R and Bioconductor
(2005) · Statistics for Biology and Health · doi:10.1007/0-387-29362-0 · Cited by 3,289
RNA-seq: An assessment of technical reproducibility and comparison with gene expression arrays
Marioni, J. C., Mason, C. E., Mane, S. M., Stephens, M., & Gilad, Y. (2008) · Genome Research · doi:10.1101/gr.079558.108 · Cited by 2,771 · cited 1×
“In most previously published reports analyzing differential gene expression in count-based data, the statistical tests applied did not account for within-group variation (28,34).”
MethodThe Transcriptional Landscape of the Yeast Genome Defined by RNA Sequencing
Nagalakshmi, U., Wang, Z., Waern, K., Shou, C., Raha, D., Gerstein, M., & Snyder, M. (2008) · Science · doi:10.1126/science.1158441 · Cited by 2,479
MAQC Consortium, Shi, L., Shi, L., Reid, L. H., Jones, W. D., Shippy, R., Warrington, J. A., Baker, S. C., Collins, P. J., de Longueville, F., et al. (2006) · Nature Biotechnology · doi:10.1038/nbt1239 · Cited by 2,126 · cited 1×
“In samples with larger differences in gene expression, like the samples analyzed by the MAQC consortium (46), the correlation is likely higher.”
MethodAntisense Transcription in the Mammalian Transcriptome
Katayama, S., Tomaru, Y., Kasukawa, T., Waki, K., Nakanishi, M., Nakamura, M., Nishida, H., Yap, C. C., Suzuki, M., Kawai, J., et al. (2005) · Science · doi:10.1126/science.1112009 · Cited by 1,661
Accurate Multiplex Polony Sequencing of an Evolved Bacterial Genome
Shendure, J., Porreca, G. J., Reppas, N. B., Lin, X., McCutcheon, J. P., Rosenbaum, A. M., Wang, M. D., Zhang, K., Mitra, R. D., & Church, G. M. (2005) · Science · doi:10.1126/science.1117389 · Cited by 1,402
Gene expression analysis by massively parallel signature sequencing (MPSS) on microbead arrays.
Brenner, S., Johnson, M., Bridgham, J., Golda, G., Lloyd, D. H., Johnson, D., Luo, S., McCurdy, S., Foy, M., Ewan, M., et al. (2000) · Nature Biotechnology · doi:10.1038/76469 · Cited by 1,360
Sultan, M., Schulz, M. H., Richard, H., Magen, A., Klingenhoff, A., Scherf, M., Seifert, M., Borodina, T., Soldatov, A., Parkhomchuk, D., et al. (2008) · Science · doi:10.1126/science.1160342 · Cited by 1,293
Substantial biases in ultra-short read data sets from high-throughput DNA sequencing
Dohm, J. C., Lottaz, C., Borodina, T., & Himmelbauer, H. (2008) · Nucleic Acids Research · doi:10.1093/nar/gkn425 · Cited by 1,088 · cited 1×
“Thus, the GC bias in DGE seems to be limited, but needs further investigation, also in the light of a recently published study where considerable overrepresentation of GC-rich sequences was observed in Solexa/Illumina-based resequencing experiments (49).”
BackgroundA global test for groups of genes: testing association with a clinical outcome
Goeman, J. J., van de Geer, S. A., de Kort, F., & van Houwelingen, H. C. (2004) · Bioinformatics · doi:10.1093/bioinformatics/btg382 · Cited by 1,069
Stem cell transcriptome profiling via massive-scale mRNA sequencing
Cloonan, N., Forrest, A. R. R., Kolle, G., Gardiner, B. B. A., Faulkner, G. J., Brown, M. K., Taylor, D. F., Steptoe, A. L., Wani, S., Bethel, G., et al. (2008) · Nature Methods · doi:10.1038/nmeth.1223 · Cited by 1,035 · cited 1×
“In an earlier deep sequencing report (27), in analogy to microarray data analysis, quantile normalization and a moderated t-statistic as implemented in the R package Limma were used to find differentially expressed genes.”
MethodDynamic repertoire of a eukaryotic transcriptome surveyed at single-nucleotide resolution
Wilhelm, B. T., Marguerat, S., Watt, S., Schubert, F., Wood, V., Goodhead, I., Penkett, C. J., Rogers, J., & Bähler, J. (2008) · Nature · doi:10.1038/nature07002 · Cited by 974 · cited 1×
“larger group of samples: We demonstrate that 2 million tags are required to reliably detect low abundant genes with DGE, whereas RNASeq requires at least 20 million tags per sample to obtain reasonable coverage of most transcripts (29,36).”
BackgroundMultiple-laboratory comparison of microarray platforms
Irizarry, R. A., Warren, D., Spencer, F., Kim, I. F., Biswal, S., Frank, B. C., Gabrielson, E., Garcia, J. G. N., Geoghegan, J., Germino, G., et al. (2005) · Nature Methods · doi:10.1038/nmeth756 · Cited by 862 · cited 3×
“Our results demonstrate many advantages of DGE over expression microarray technology: (i) DGE gives an unbiased view of the transcriptome, not limited by predictions of expressed transcripts used to determine array content; (ii) DGE detects high levels of differential polyadenylation and antisense transcription, which…”
BackgroundInfluentialBentley, D. R. (2006) · Current Opinion in Genetics & Development · doi:10.1016/j.gde.2006.10.009 · Cited by 803
Analysis of human transcriptomes
Velculescu, V. E., Madden, S. L., Zhang, L., Lash, A. E., Yu, J., Rago, C., Lal, A., Wang, C. J., Beaudry, G. A., Ciriello, K. M., et al. (1999) · Nature Genetics · doi:10.1038/70487 · Cited by 774
Patterns of Variant Polyadenylation Signal Usage in Human Genes
Beaudoing, E., Freier, S., Wyatt, J. R., Claverie, J.-M., & Gautheret, D. (2000) · Genome Research · doi:10.1101/gr.10.7.1001 · Cited by 673 · cited 1×
“The observed 47% alternative polyadenylation is much higher than the 29% estimated previously based on EST sequences (14).”
BackgroundWidespread occurrence of antisense transcription in the human genome
Yelin, R., Dahary, D., Sorek, R., Levanon, E. Y., Goldstein, O., Shoshan, A., Diber, A., Biton, S., Tamir, Y., Khosravi, R., et al. (2003) · Nature Biotechnology · doi:10.1038/nbt808 · Cited by 648
Evaluation of DNA microarray results with quantitative gene expression platforms
Canales, R. D., Luo, Y., Willey, J. C., Austermiller, B., Barbacioru, C. C., Boysen, C., Hunkapiller, K., Jensen, R. V., Knight, C. R., Lee, K. Y., et al. (2006) · Nature Biotechnology · doi:10.1038/nbt1236 · Cited by 615 · cited 1×
“This is probably due to the absence of background signal and saturation effects, which are major causes of ratio compression on microarrays (39).”
BackgroundDeuel, T. A. S., Liu, J. S., Corbo, J. C., Yoo, S.-Y., Rorke-Adams, L. B., & Walsh, C. A. (2006) · Neuron · doi:10.1016/j.neuron.2005.10.038 · Cited by 286
Gene expression profiling by massively parallel sequencing
Torres, T. T., Metta, M., Ottenwälder, B., & Schlötterer, C. (2008) · Genome Research · doi:10.1101/gr.6984908 · Cited by 248
Direct Comparison of GeneChip and SAGE on the Quantitative Accuracy in Transcript Profiling Analysis
Ishii, M., Hashimoto, S.-I., Tsutsumi, S., Wada, Y., Matsushima, K., Kodama, T., & Aburatani, H. (2000) · Genomics · doi:10.1006/geno.2000.6284 · Cited by 209
Lin, P. T., Gleeson, J. G., Corbo, J. C., Flanagan, L., & Walsh, C. A. (2000) · The Journal of Neuroscience · doi:10.1523/jneurosci.20-24-09152.2000 · Cited by 203 · cited 1×
“Some are microtubuleassociated proteins (23) that may regulate microtubuleguided transport of SNARE-protein containing synaptic vesicles (24), while the DCLK-short variant has Ca/ calmodulin-dependent protein kinase (CaMK) properties (8,25).”
BackgroundPolony Multiplex Analysis of Gene Expression (PMAGE) in Mouse Hypertrophic Cardiomyopathy
Kim, J. B., Porreca, G. J., Song, L., Greenway, S. C., Gorham, J. M., Church, G. M., Seidman, C. E., & Seidman, J. G. (2007) · Science · doi:10.1126/science.1137325 · Cited by 202 · cited 2×
“In most previously published reports analyzing differential gene expression in count-based data, the statistical tests applied did not account for within-group variation (28,34).”
MethodAntisense artifacts in transcriptome microarray experiments are resolved by actinomycin D
Perocchi, F., Xu, Z., Clauder-Münster, S., & Steinmetz, L. M. (2007) · Nucleic Acids Research · doi:10.1093/nar/gkm683 · Cited by 193 · cited 1×
“antisense tags are generally not more prominent in highly abundant transcripts), almost excludes the possibility that the antisense tags are found due to reverse transcriptase artifacts, as suggested previously (20).”
BackgroundTag-based approaches for transcriptome research and genome annotation
Harbers, M., & Carninci, P. (2005) · Nature Methods · doi:10.1038/nmeth768 · Cited by 184
Grigoriadis, A. E., Mackay, A. G., Reis-Filho, J. S., Steele, D., Iseli, C., Stevenson, B. J., Jongeneel, C. V., Valgeirsson, H., Fenwick, K., Iravani, M., et al. (2006) · Breast Cancer Research · doi:10.1186/bcr1604 · Cited by 155 · cited 1×
“Our finding that DGE results were more consistent with Affymetrix results than with other microarray platforms is consistent with an earlier study (31,42), in which MPSS results correlated better with Affymetrix than with other arrays.”
ResultNielsen, K. L., Høgh, A. L., & Emmersen, J. (2006) · Nucleic Acids Research · doi:10.1093/nar/gkl714 · Cited by 117 · cited 1×
“The sequencing depth of the Solexa/Illumina DGE technology compares favorably to the earlier MPSS system from Lynx Therapeutics [7 10(5) sequences per run (7)] and Roche [454 sequencer, 3 10(5) sequences per run (33)], and is comparable to the polony multiplex analysis of gene expression (34).”
MethodEvaluation of Affymetrix Gene Chip sensitivity in rat hippocampal tissue using SAGE analysis*
Evans, S. J., Datson, N. A., Kabbaj, M., Thompson, R. C., Vreugdenhil, E., de Kloet, E. R., Watson, S. J., & Akil, H. (2002) · European Journal of Neuroscience · doi:10.1046/j.1460-9568.2002.02097.x · Cited by 116
Self-citationJongeneel, C. V., Iseli, C., Stevenson, B. J., Riggins, G. J., Lal, A., Mackay, A. G., Harris, R. A., O’Hare, M. J., Neville, A. M., Simpson, A. J. G., et al. (2003) · Proceedings of the National Academy of Sciences · doi:10.1073/pnas.0831040100 · Cited by 114 · cited 2×
“The technology is also referred to as Digital Gene Expression tag profiling (DGE), and is essentially an improved version of the earlier Massively Parallel Signature Sequencing (MPSS) technology(3,7).”
MethodStatistical evaluation of SAGE libraries: consequences for experimental design
Ruijter, J. M., van Kampen, A. H. C., & Baas, F. (2002) · Physiological Genomics · doi:10.1152/physiolgenomics.00042.2002 · Cited by 112 · cited 1×
“A Fisher or similar 2 2 contingency table statistical test has previously been used to identify tags with significantly different abundance in two pooled SAGE libraries (21).”
MethodPauws, E. (2001) · Nucleic Acids Research · doi:10.1093/nar/29.8.1690 · Cited by 110 · cited 1×
“In addition, a small fraction may be explained by alternative cleavage site selection from the same polyadenylation site (13).”
BackgroundLiu, F., Jenssen, T.-K., Trimarchi, J. M., Punzo, C., Cepko, C. L., Lucila Ohno-machado, A., Hovig, E. J., & Kuo, W. P. (2007) · BMC Genomics · doi:10.1186/1471-2164-8-153 · Cited by 83 · cited 11×
“For the Affymetrix data, intensities of the 11 perfectly matched probes were summarized into a single value.”
ResultInfluentialEvaluation of the similarity of gene expression data estimated with SAGE and Affymetrix GeneChips
van Ruissen, F., Ruijter, J. M., Schaaf, G., Asgharnegad, L., Zwijnenburg, D. A., Kool, M., & Baas, F. (2005) · BMC Genomics · doi:10.1186/1471-2164-6-91 · Cited by 72
Vêncio, R. Z. N., Brentani, H., Patrão, D. F. D. C., & Pereira, C. A. D. B. (2004) · BMC Bioinformatics · doi:10.1186/1471-2105-5-119 · Cited by 64 · cited 1×
“(10) proposed a Bayesian method for the analysis of replicated SAGE data that takes into account stochastic effects for the low abundant genes as well as differences in library”
MethodCan subtle changes in gene expression be consistently detected with different microarray platforms?
Pedotti, P., Hoen, P. A. C. ’., Vreugdenhil, E., Schenk, G. J., Vossen, R. H. A. M., Ariyürek, Y., de Hollander, M., Kuiper, R., van Ommen, G. B., den Dunnen, J. T., et al. (2008) · BMC Genomics · doi:10.1186/1471-2164-9-124 · Cited by 60 · cited 7×
“The microarray analysis of the exact samples as used for DGE is described in our previous paper (9).”
BackgroundMethodInfluentialSelf-citationSequence biases in large scale gene expression profiling data
Siddiqui, A. S., Delaney, A. D., Schnerch, A., Griffith, O. L., Jones, S. J. M., & Marra, M. A. (2006) · Nucleic Acids Research · doi:10.1093/nar/gkl404 · Cited by 57 · cited 3×
“The correlation in detected transcripts was higher than previously found for SAGE or MPSS versus Affymetrix (30,31), mainly due to the higher number of tags sequenced with DGE.”
BackgroundA comparison of gene expression profiles produced by SAGE, long SAGE, and oligonucleotide chips
Lu, J., Lal, A., Merriman, B., Nelson, S., & Riggins, G. (2004) · Genomics · doi:10.1016/j.ygeno.2004.06.014 · Cited by 55
A large quantity of novel human antisense transcripts detected by LongSAGE
Ge, X., Wu, Q., Jung, Y.-C., Chen, J., & Wang, S. M. (2006) · Bioinformatics · doi:10.1093/bioinformatics/btl429 · Cited by 53
Sun, M., Hurst, L. D., Carmichael, G., & Chen, J. (2006) · Genome Research · doi:10.1101/gr.5210006 · Cited by 53
Expression profiling of antisense transcripts on DNA arrays
Werner, A., Schmutzler, G., Carlile, M., Miles, C. G., & Peters, H. (2006) · Physiological Genomics · doi:10.1152/physiolgenomics.00127.2006 · Cited by 46
Functional differences between two DCLK splice variants
Engels, B., Schouten, T. G., van Dullemen, J., Gosens, I., & Vreugdenhil, E. (2003) · Molecular Brain Research · doi:10.1016/j.molbrainres.2003.10.006 · Cited by 43 · cited 2×
“This splice variant, dC-doublecortin-like kinase (DCLK)-short, makes the kinase constitutively active (8), and causes subtle behavioral phenotypes (Schenk et al.”
BackgroundSelf-citationCatalytic and Regulatory Domains of Doublecortin Kinase-1
Shang, L., Kwon, Y., Nandy, S. K., Lawrence, D. S., & Edelman, A. M. (2003) · Biochemistry · doi:10.1021/bi026913i · Cited by 35
Modeling Sage data with a truncated gamma-Poisson model
Thygesen, H. H., & Zwinderman, A. H. (2006) · BMC Bioinformatics · doi:10.1186/1471-2105-7-157 · Cited by 33 · cited 1×
“Apart from the explanations mentioned above, this is likely attributable to the fact that DGE measures absolute expression levels and DGE data are Poisson distributed (47), while qPCR and microarrays provide relative expression levels, which are log normal distributed.”
BackgroundSelf-citationFeldker, D. E. M., Datson, N. A., Veenema, A. H., Proutski, V., Lathouwers, D., de Kloet, E. R., & Vreugdenhil, E. (2003) · Journal of Neuroscience Research · doi:10.1002/jnr.10800 · Cited by 33 · cited 1×
“As noted before (26), many of the genes with most significant changes in expression are low-abundant genes and would not have been identified in a typical SAGE experiment.”
BackgroundSelf-citationFeldker, D. E. M., de Kloet, E. R., Kruk, M. R., & Datson, N. A. (2003) · Behavior Genetics · doi:10.1023/a:1025726801047 · Cited by 19
The Context Organization of Functional Regions in Yeast Genes with High-Level Expression
Kochetov, A. V., Sarai, A., Vorob'ev, D. G., & Kolchanov, N. A. (2002) · Molecular Biology · doi:10.1023/a:1021638127137 · Cited by 7 · cited 2×
“This supports an earlier observation that highly expressed genes contain more T-rich 30-UTRs than lowly expressed genes (48).”
Background
Research works printed but not linked: 1
- Snedecor, 1989, Square root transformation for counts, 287
Cited by
A scaling normalization method for differential expression analysis of RNA-seq data
Robinson, M. D., & Oshlack, A. (2010) · Genome Biology · doi:10.1186/gb-2010-11-3-r25 · Cited by 7,876
Gene ontology analysis for RNA-seq: accounting for selection bias
Young, M. D., Wakefield, M. J., Smyth, G. K., & Oshlack, A. (2010) · Genome Biology · doi:10.1186/gb-2010-11-2-r14 · Cited by 7,107
McCarthy, D. J., Chen, Y., & Smyth, G. K. (2012) · Nucleic Acids Research · doi:10.1093/nar/gks042 · Cited by 5,195
Correlation of mRNA and protein in complex biological samples
Maier, T., Güell, M., & Serrano, L. (2009) · FEBS Letters · doi:10.1016/j.febslet.2009.10.036 · Cited by 1,802
“A comparison with five array platforms demonstrates a better resolution, reproducibility and robustness of a deep sequencing based method [75].”
Bullard, J. H., Purdom, E., Hansen, K. D., & Dudoit, S. (2010) · BMC Bioinformatics · doi:10.1186/1471-2105-11-94 · Cited by 1,680
“literature include t-statistics with square root-transformed standard errors and Bayesian statistics based on the Beta-Binomial distribution (Hoen et al., 2008).”
Method
Metadata
- Authors
- 't Hoen, P. A. C., Ariyurek, Y., Thygesen, H. H., Vreugdenhil, E., Vossen, R. H. A. M., de Menezes, R. X., Boer, J. M., van Ommen, G.-J. B., & den Dunnen, J. T.
- Affiliations
- Leiden University (NL)
- Venue
- Nucleic Acids Research
- Publisher
- Oxford University Press (OUP)
- Published
- 2008-10-15
- Volume
- 36
- Issue
- 21
- Pages
- e141-e141
- ISSN
- 0305-1048 (ISSN-L)
- 1362-4962
- PMC
- PMC2588528
- OpenAlex
- W2116166762
- Cited by
- 742
- References
- 50
- Citations by year
- 2026: 3 · 2025: 2 · 2024: 4 · 2023: 19 · 2022: 24 · 2021: 19 · 2020: 25 · 2019: 32 · 2018: 33 · 2017: 24 · 2016: 43 · 2015: 71 · 2014: 78 · 2013: 94 · 2012: 89
- FWCI
- 24.98
- Type
- journal article
- Language
- en
- Open access
- gold
- doi.org
- Licence
- Locations
- Nucleic Acids Research (publishedVersion, cc-by-nc)
- PubMed Central (publishedVersion, cc-by-nc)
- PubMed (publishedVersion)
- Funders
- Nederlandse Organisatie voor Wetenschappelijk Onderzoek
- Leids Universitair Medisch Centrum
- Topics
- Life Sciences › Biochemistry, Genetics and Molecular Biology › Molecular Biology › Gene expression and cancer classification
- Life Sciences › Biochemistry, Genetics and Molecular Biology › Molecular Biology › Genomics and Phylogenetic Studies
- Life Sciences › Biochemistry, Genetics and Molecular Biology › Molecular Biology › Single-cell and spatial transcriptomics
- Keywords
- deep sequencing, microarray comparison, hippocampus, transgenic mice, differential gene expression, false discovery rate, Bayesian model, interlaboratory reproducibility, antisense transcription, alternative polyadenylation, calcium/calmodulin-dependent protein kinase, vesicle trafficking, gene expression profiling
- MeSH terms
- Doublecortin-Like Kinases, Animals, Bayes Theorem, Hippocampus, Male, Mice, Inbred C57BL, Mice, Transgenic, Reproducibility of Results, Polymerase Chain Reaction, Sequence Tagged Sites, RNA, Antisense, Protein Serine-Threonine Kinases, Alternative Splicing, Sequence Analysis, DNA, Oligonucleotide Array Sequence Analysis, Gene Expression Profiling, Polyadenylation, Mice
About these checks
Registry, retraction, Cites and statistics results are computed, not judged, with one exception: a printed reference that no index lists is read once by a model before it counts as a citation error. Claims are extracted by a model and kept only when their quote appears verbatim in the text; each cited source is then checked, with a model’s help, for whether it says what the claim relies on. Those verdicts can be wrong — read the claim’s quote and the cited source before relying on one.
Statistics and arithmetic are recomputed, not judged.
Confidence bands are shown only for fields calibrated on our annotated test set. None is calibrated yet, so no band is shown.
What counts as a claim ›How we measure confidence ›How we check this ›
Are you an author, or do you see a problem with this page? Request a review
Data sources
Bibliographic data: Semantic Scholar, OpenAlex, Crossref.
Contains information from the Semantic Scholar Academic Graph Datasets, made available under the ODC Attribution License (ODC-BY 1.0).
Semantic Scholar’s data is described in: Kinney, R., et al. (2023). The Semantic Scholar Open Data Platform. arXiv:2301.10140.
