

The DOI matches its Crossref record; 39 of the 39 references it cites were found in a registry or an index.
A comparison of RNA-Seq and high-density exon array for detecting differential gene expression between closely related species
Open accessAbstract
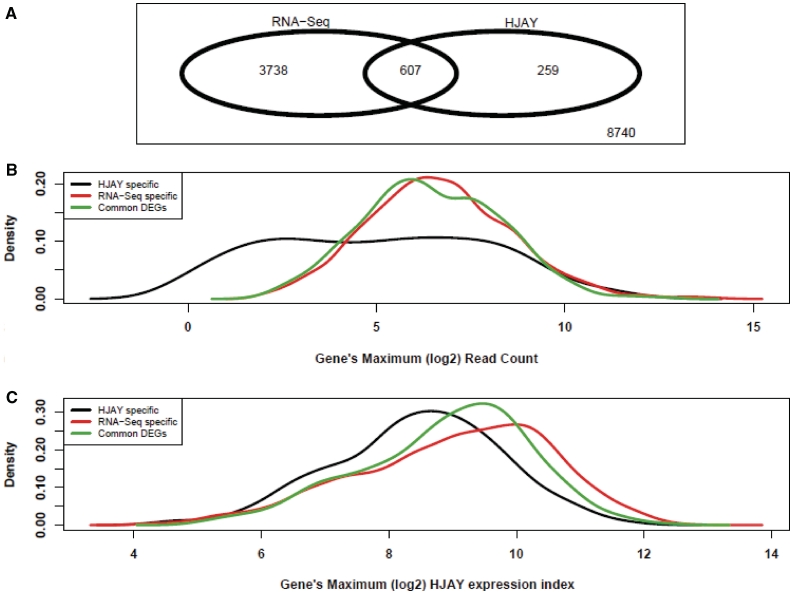
RNA-Seq has emerged as a revolutionary technology for transcriptome analysis. In this article, we report a systematic comparison of RNA-Seq and high-density exon array for detecting differential gene expression between closely related species. On a panel of human/chimpanzee/rhesus cerebellum RNA samples previously examined by the high-density human exon junction array (HJAY) and real-time qPCR, we generated 48.68 million RNA-Seq reads. Our results indicate that RNA-Seq has significantly improved gene coverage and increased sensitivity for differentially expressed genes compared with the high-density HJAY array. Meanwhile, we observed a systematic increase in the RNA-Seq error rate for lowly expressed genes. Specifically, between-species DEGs detected by array/qPCR but missed by RNA-Seq were characterized by relatively low expression levels, as indicated by lower RNA-Seq read counts, lower HJAY array expression indices and higher qPCR raw cycle threshold values. Furthermore, this issue was not unique to between-species comparisons of gene expression. In the RNA-Seq analysis of MicroArray Quality Control human reference RNA samples with extensive qPCR data, we also observed an increase in both the false-negative rate and the false-positive rate for lowly expressed genes. These findings have important implications for the design and data interpretation of RNA-Seq studies on gene expression differences between and within species.
Overview
The claims and statistics of this paper haven’t been checked yet.
Free: it reads the open-access text and checks the first 5 claims that cite a source we can check. Create a free account to check every claim.
Integrity signals
Registry
Cites
Statistics
Figures



Verification
Claims the paper makes
The claims and statistics of this paper haven’t been checked yet.
Free: it reads the open-access text and checks the first 5 claims that cite a source we can check. Create a free account to check every claim.
Self-check
Percentages, sums and reported differences re-computed from the paper’s own numbers.
The self-check needs the paper’s full text.
Citations
Cites
Controlling the False Discovery Rate: A Practical and Powerful Approach to Multiple Testing
Benjamini, Y., & Hochberg, Y. (1995) · Journal of the Royal Statistical Society Series B: Statistical Methodology · doi:10.1111/j.2517-6161.1995.tb02031.x · Cited by 109,482
Mapping and quantifying mammalian transcriptomes by RNA-Seq
Mortazavi, A., Williams, B. A., McCue, K., Schaeffer, L., & Wold, B. (2008) · Nature Methods · doi:10.1038/nmeth.1226 · Cited by 13,696
RNA-Seq: a revolutionary tool for transcriptomics
Wang, Z., Gerstein, M., & Snyder, M. (2009) · Nature Reviews Genetics · doi:10.1038/nrg2484 · Cited by 13,174
Smyth, G. K. (2004) · Statistical Applications in Genetics and Molecular Biology · doi:10.2202/1544-6115.1027 · Cited by 11,829
Alternative isoform regulation in human tissue transcriptomes
Wang, E. T., Sandberg, R., Luo, S., Khrebtukova, I., Zhang, L., Mayr, C., Kingsmore, S. F., Schroth, G. P., & Burge, C. B. (2008) · Nature · doi:10.1038/nature07509 · Cited by 5,181
RNA-seq: An assessment of technical reproducibility and comparison with gene expression arrays
Marioni, J. C., Mason, C. E., Mane, S. M., Stephens, M., & Gilad, Y. (2008) · Genome Research · doi:10.1101/gr.079558.108 · Cited by 2,771
MAQC Consortium, Shi, L., Shi, L., Reid, L. H., Jones, W. D., Shippy, R., Warrington, J. A., Baker, S. C., Collins, P. J., de Longueville, F., et al. (2006) · Nature Biotechnology · doi:10.1038/nbt1239 · Cited by 2,126
Bullard, J. H., Purdom, E., Hansen, K. D., & Dudoit, S. (2010) · BMC Bioinformatics · doi:10.1186/1471-2105-11-94 · Cited by 1,680
Sultan, M., Schulz, M. H., Richard, H., Magen, A., Klingenhoff, A., Scherf, M., Seifert, M., Borodina, T., Soldatov, A., Parkhomchuk, D., et al. (2008) · Science · doi:10.1126/science.1160342 · Cited by 1,293
Stem cell transcriptome profiling via massive-scale mRNA sequencing
Cloonan, N., Forrest, A. R. R., Kolle, G., Gardiner, B. B. A., Faulkner, G. J., Brown, M. K., Taylor, D. F., Steptoe, A. L., Wani, S., Bethel, G., et al. (2008) · Nature Methods · doi:10.1038/nmeth.1223 · Cited by 1,035 · cited 1×
“Although our finding appears to contradict the general assumption that RNA-Seq is particularly suitable for analysis of lowly expressed genes as compared with microarrays (23,24), it is not entirely unexpected.”
Result
Cited by
Dillies, M.-A., Rau, A., Aubert, J., Hennequet-Antier, C., Jeanmougin, M., Servant, N., Keime, C., Marot, G., Castel, D., Estelle, J., et al. (2013) · Briefings in Bioinformatics · doi:10.1093/bib/bbs046 · Cited by 1,298
SEQC/MAQC-III Consortium (2014) · Nature Biotechnology · doi:10.1038/nbt.2957 · Cited by 983
Microarrays, deep sequencing and the true measure of the transcriptome
Malone, J. H., & Oliver, B. (2011) · BMC Biology · doi:10.1186/1741-7007-9-34 · Cited by 548
Evolution of human-specific neural SRGAP2 genes by incomplete segmental duplication
Dennis, M. Y., Nuttle, X., Sudmant, P. H., Antonacci, F., Graves, T. A., Nefedov, M., Rosenfeld, J. A., Sajjadian, S., Malig, M., Kotkiewicz, H., et al. (2012) · Cell · doi:10.1016/j.cell.2012.03.033 · Cited by 407
Li, B., Tsoi, L. C., Swindell, W. R., Gudjonsson, J. E., Tejasvi, T., Johnston, A., Ding, J., Stuart, P. E., Xing, X., Kochkodan, J. J., et al. (2014) · Journal of Investigative Dermatology · doi:10.1038/jid.2014.28 · Cited by 397
Metadata
- Authors
- Liu, S., Lin, L., Jiang, P., Wang, D., & Xing, Y.
- Affiliations
- University of Iowa (US)
- Corresponding author
- Xing, Yi
- Venue
- Nucleic Acids Research
- Publisher
- Oxford University Press (OUP)
- Published
- 2010-09-22
- Volume
- 39
- Issue
- 2
- Pages
- 578-588
- ISSN
- 0305-1048 (ISSN-L)
- 1362-4962
- PMC
- PMC3025565
- OpenAlex
- W2149517369
- Cited by
- 146
- References
- 39
- Citations by year
- 2026: 3 · 2025: 1 · 2024: 2 · 2022: 2 · 2021: 5 · 2020: 3 · 2019: 9 · 2018: 8 · 2017: 9 · 2016: 8 · 2015: 20 · 2014: 20 · 2013: 19 · 2012: 19
- FWCI
- 7.30
- Type
- journal article
- Language
- en
- Open access
- gold
- doi.org
- Licence
- Locations
- Nucleic Acids Research (publishedVersion, cc-by-nc)
- PubMed Central (publishedVersion, cc-by-nc)
- PubMed (publishedVersion)
- Funders
- National Institutes of Health (RR013986, RR024979)
- National Human Genome Research Institute (R01HG004634)
- National Institute of General Medical Sciences (R01GM088342)
- National Center for Research Resources (RR-013986, P51RR013986, UL1RR024979, RR024979)
- Topics
- Life Sciences › Biochemistry, Genetics and Molecular Biology › Molecular Biology › Genomics and Phylogenetic Studies
- Life Sciences › Biochemistry, Genetics and Molecular Biology › Molecular Biology › Gene expression and cancer classification
- Life Sciences › Biochemistry, Genetics and Molecular Biology › Molecular Biology › Single-cell and spatial transcriptomics
- Keywords
- RNA-seq, differential gene expression, closely related species, lowly expressed genes, false negative rate, false positive rate, gene coverage, qPCR validation
- MeSH terms
- Animals, Cerebellum, Pan troglodytes, Exons, Humans, Macaca mulatta, Reference Standards, RNA, Polymerase Chain Reaction, Sequence Analysis, RNA, Oligonucleotide Array Sequence Analysis, Gene Expression Profiling
About these checks
Registry, retraction, Cites and statistics results are computed, not judged, with one exception: a printed reference that no index lists is read once by a model before it counts as a citation error. Claims are extracted by a model and kept only when their quote appears verbatim in the text; each cited source is then checked, with a model’s help, for whether it says what the claim relies on. Those verdicts can be wrong — read the claim’s quote and the cited source before relying on one.
Statistics and arithmetic are recomputed, not judged.
Confidence bands are shown only for fields calibrated on our annotated test set. None is calibrated yet, so no band is shown.
What counts as a claim ›How we measure confidence ›How we check this ›
Are you an author, or do you see a problem with this page? Request a review
How to cite
Cite CoChat for the checks on this page, and the paper for its own findings.
- This page
- CoChat. (2026). Citation check: A comparison of RNA-Seq and high-density exon array for detecting differential gene expression between closely related species. https://app.cochat.ai/papers/10.1093/nar/gkq817
- The paper
- Liu, S., Lin, L., Jiang, P., Wang, D., & Xing, Y. (2011). A comparison of RNA-Seq and high-density exon array for detecting differential gene expression between closely related species. Nucleic Acids Research. https://doi.org/10.1093/nar/gkq817
Data sources
Bibliographic data: Semantic Scholar, OpenAlex, Crossref.
Contains information from the Semantic Scholar Academic Graph Datasets, made available under the ODC Attribution License (ODC-BY 1.0).
Semantic Scholar’s data is described in: Kinney, R., et al. (2023). The Semantic Scholar Open Data Platform. arXiv:2301.10140.
