

The DOI matches its Crossref record; 32 of the 32 references it cites were found in a registry or an index.
Optimizing the noise versus bias trade-off for Illumina whole genome expression BeadChips
Open accessAbstract
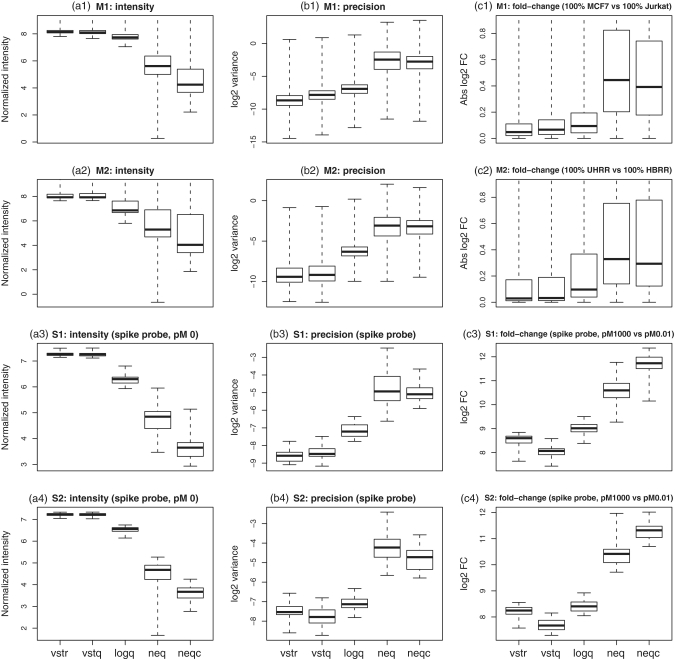
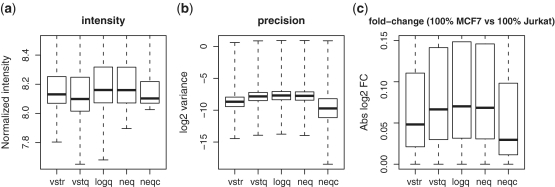
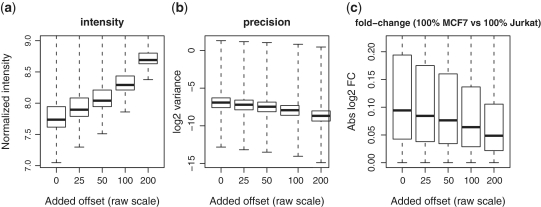
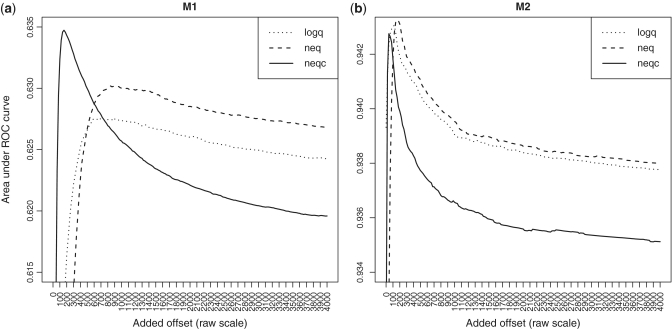
Five strategies for pre-processing intensities from Illumina expression BeadChips are assessed from the point of view of precision and bias. The strategies include a popular variance stabilizing transformation and model-based background corrections that either use or ignore the control probes. Four calibration data sets are used to evaluate precision, bias and false discovery rate (FDR). The original algorithms are shown to have operating characteristics that are not easily comparable. Some tend to minimize noise while others minimize bias. Each original algorithm is shown to have an innate intensity offset, by which unlogged intensities are bounded away from zero, and the size of this offset determines its position on the noise-bias spectrum. By adding extra offsets, a continuum of related algorithms with different noise-bias trade-offs is generated, allowing direct comparison of the performance of the strategies on equivalent terms. Adding a positive offset is shown to decrease the FDR of each original algorithm. The potential of each strategy to generate an algorithm with an optimal noise-bias trade-off is explored by finding the offset that minimizes its FDR. The use of control probes as part of the background correction and normalization strategy is shown to achieve the lowest FDR for a given bias.
Overview
The claims and statistics of this paper haven’t been checked yet.
Run the check — free, no account needed. It reads the open-access text and checks the sources it cites.
Integrity signals
Registry
Cites
Statistics
Figures
Verification
Claims the paper makes
The claims and statistics of this paper haven’t been checked yet.
Run the check — free, no account needed. It reads the open-access text and checks the sources it cites.
Claims other papers make about this one
Each is checked against this paper’s own text: does it say what the citing paper says it does?
In the citing paper
“Offsets in a range of moderate values have been shown to achieve an effective compromise between noise and bias (24).”
From limma powers differential expression analyses for RNA-sequencing and microarray studies (2015) · cites this paper as [24]
Self-check
Percentages, sums and reported differences re-computed from the paper’s own numbers.
The self-check needs the paper’s full text.
Citations
Cites
Smyth, G. K. (2004) · Statistical Applications in Genetics and Molecular Biology · doi:10.2202/1544-6115.1027 · Cited by 11,829
Self-citationExploration, normalization, and summaries of high density oligonucleotide array probe level data
Irizarry, R. A. (2003) · Biostatistics · doi:10.1093/biostatistics/4.2.249 · Cited by 10,603
Bolstad, B. M., Irizarry, R. A., Åstrand, M., & Speed, T. P. (2003) · Bioinformatics · doi:10.1093/bioinformatics/19.2.185 · Cited by 8,328
Huber, P. J. (1981) · Wiley Series in Probability and Statistics · doi:10.1002/0471725250 · Cited by 7,066
limma: Linear Models for Microarray Data
Smyth, G. K. (2005) · Statistics for Biology and Health · doi:10.1007/0-387-29362-0_23 · Cited by 5,796
Self-citationSummaries of Affymetrix GeneChip probe level data
Irizarry, R. A. (2003) · Nucleic Acids Research · doi:10.1093/nar/gng015 · Cited by 4,837
Bioinformatics and Computational Biology Solutions Using R and Bioconductor
Gentleman, R. C., Carey, V. J., Huber, W. K., Irizarry, R. A., & Dudoit, S. (2005) · Statistics in the health sciences · doi:10.1007/0-387-29362-0 · Cited by 3,470
Algorithms for Minimization Without Derivatives
G., D., & Brent, R. P. (1974) · Mathematics of Computation · doi:10.2307/2005713 · Cited by 2,914
MAQC Consortium, Shi, L., Shi, L., Reid, L. H., Jones, W. D., Shippy, R., Warrington, J. A., Baker, S. C., Collins, P. J., de Longueville, F., et al. (2006) · Nature Biotechnology · doi:10.1038/nbt1239 · Cited by 2,126
lumi : a pipeline for processing Illumina microarray
Du, P., Kibbe, W. A., & Lin, S. M. (2008) · Bioinformatics · doi:10.1093/bioinformatics/btn224 · Cited by 2,028
Research works printed but not linked: 1
- Illumina, 2008, BeadStudio Gene Expression Module User Guide
Cited by
Sorted by citations
limma powers differential expression analyses for RNA-sequencing and microarray studies
Ritchie, M. E., Phipson, B., Wu, D., Hu, Y., Law, C. W., Shi, W., & Smyth, G. K. (2015) · Nucleic Acids Research · doi:10.1093/nar/gkv007 · Cited by 40,458
Self-citationThe Subread aligner: fast, accurate and scalable read mapping by seed-and-vote
Liao, Y., Smyth, G. K., & Shi, W. (2013) · Nucleic Acids Research · doi:10.1093/nar/gkt214 · Cited by 3,064
Self-citationIntegrative approaches for large-scale transcriptome-wide association studies
Gusev, A., Ko, A., Shi, H., Bhatia, G., Chung, W., Penninx, B. W. J. H., Jansen, R., de Geus, E. J. C., Boomsma, D. I., Wright, F. A., et al. (2016) · Nature Genetics · doi:10.1038/ng.3506 · Cited by 2,479
Gene expression elucidates functional impact of polygenic risk for schizophrenia
Fromer, M., Roussos, P., Sieberts, S. K., Johnson, J. S., Kavanagh, D. H., Perumal, T. M., Ruderfer, D. M., Oh, E. C., Topol, A., Shah, H. R., et al. (2016) · Nature Neuroscience · doi:10.1038/nn.4399 · Cited by 1,091
Phipson, B., Lee, S., Majewski, I. J., Alexander, W. S., & Smyth, G. K. (2016) · The Annals of Applied Statistics · doi:10.1214/16-aoas920 · Cited by 1,013
Self-citationApoptotic Caspases Suppress mtDNA-Induced STING-Mediated Type I IFN Production
White, M. J., McArthur, K., Metcalf, D., Lane, R. M., Cambier, J. C., Herold, M. J., van Delft, M. F., Bedoui, S., Lessene, G., Ritchie, M. E., et al. (2014) · Cell · doi:10.1016/j.cell.2014.11.036 · Cited by 983
Low-level processing of Illumina Infinium DNA Methylation BeadArrays
Triche, T. J., Weisenberger, D. J., Berg, D. V. D., Laird, P. W., & Siegmund, K. D. (2013) · Nucleic Acids Research · doi:10.1093/nar/gkt090 · Cited by 909
Camera: a competitive gene set test accounting for inter-gene correlation
Wu, D., & Smyth, G. K. (2012) · Nucleic Acids Research · doi:10.1093/nar/gks461 · Cited by 901
Self-citationThe Gut Microbiota Plays a Protective Role in the Host Defence Against Pneumococcal Pneumonia
Schuijt, T. J., Lankelma, J. M., Scicluna, B. P., de Sousa e Melo, F., Roelofs, J. J. T. H., de Boer, J. D., Hoogendijk, A. J., de Beer, R., de Vos, A., Belzer, C., et al. (2016) · Gut · doi:10.1136/gutjnl-2015-309728 · Cited by 832
Cretney, E., Xin, A., Shi, W., Minnich, M., Masson, F., Miasari, M., Belz, G. T., Smyth, G. K., Busslinger, M., Nutt, S. L., et al. (2011) · Nature Immunology · doi:10.1038/ni.2006 · Cited by 605
Self-citationHuman MX2 is an interferon-induced post-entry inhibitor of HIV-1 infection
Goujon, C., Moncorgé, O., Bauby, H., Doyle, T., Ward, C. C., Schaller, T., Hué, S., Barclay, W., Schulz, R., & Malim, M. H. (2013) · Nature · doi:10.1038/nature12542 · Cited by 632
Suppression of antitumor T cell immunity by the oncometabolite (R)-2-hydroxyglutarate
Bunse, L., Pusch, S., Bunse, T., Sahm, F., Sanghvi, K., Friedrich, M., Alansary, D., Sonner, J. K., Green, E., Deumelandt, K., et al. (2018) · Nature Medicine · doi:10.1038/s41591-018-0095-6 · Cited by 566
Programs for the persistence, vigilance and control of human CD8+ lung-resident memory T cells
Hombrink, P., Helbig, C., Backer, R. A., Piet, B., Oja, A. E., Stark, R., Brasser, G., Jongejan, A., Jonkers, R. E., Nota, B., et al. (2016) · Nature Immunology · doi:10.1038/ni.3589 · Cited by 455
Integrated genomic characterization of IDH1-mutant glioma malignant progression
Bai, H., Harmancı, A. S., Erson-Omay, Z., Li, J., Coşkun, S., Simon, M., Krischek, B., Özduman, K., Omay, S. B., Sorensen, E. A., et al. (2015) · Nature Genetics · doi:10.1038/ng.3457 · Cited by 328
Stančáková, A., Civelek, M., Saleem, N. K., Soininen, P., Kangas, A. J., Cederberg, H., Paananen, J., Pihlajamäki, J., Bonnycastle, L. L., Morken, M. A., et al. (2012) · Diabetes · doi:10.2337/db11-1378 · Cited by 282
Dittrich, M. T., Mueller, H. M., Bauer, H., Peirats‐Llobet, M., Rodrı́guez, P. L., Geilfus, C., Carpentier, S., Rasheid, K. A. S. A., Kollist, H., Merilo, E., et al. (2019) · Nature Plants · doi:10.1038/s41477-019-0490-0 · Cited by 213
Histone variant H2A.J accumulates in senescent cells and promotes inflammatory gene expression
Contrepois, K., Coudereau, C., Benayoun, B. A., Schuler, N., Roux, P.-F., Bischof, O., Courbeyrette, R., Carvalho, C., Thuret, J.-Y., Ma, Z., et al. (2017) · Nature Communications · doi:10.1038/ncomms14995 · Cited by 191
Xin, A., Masson, F., Liao, Y., Preston, S., Guan, T., Gloury, R., Olshansky, M., Lin, J., Li, P., Speed, T. P., et al. (2016) · Nature Immunology · doi:10.1038/ni.3410 · Cited by 191
Self-citationBilberries reduce low‐grade inflammation in individuals with features of metabolic syndrome
Kolehmainen, M., Mykkänen, O. T., Kirjavainen, P. V., Leppänen, T., Moilanen, E., Adriaens, M. E., Laaksonen, D. E., Hallikainen, M., Puupponen‐Pimiä, R., Pulkkinen, L., et al. (2012) · Molecular Nutrition & Food Research · doi:10.1002/mnfr.201200195 · Cited by 194
Cordell, H. J., Bentham, J., Töpf, A., Zélénika, D., Heath, S. C., Mamasoula, C., Cosgrove, C., Blue, G. M., Granados-Riveron, J. T., Setchfield, K., et al. (2013) · Nature Genetics · doi:10.1038/ng.2637 · Cited by 165
Trigger-happy resident memory CD4+ T cells inhabit the human lungs
Oja, A. E., Piet, B., Helbig, C., Stark, R., van der Zwan, D., Blaauwgeers, H., Remmerswaal, E. B. M., Amsen, D., Jonkers, R. E., Moerland, P. D., et al. (2018) · Mucosal Immunology · doi:10.1038/mi.2017.94 · Cited by 160
Mechanisms of action of sacubitril/valsartan on cardiac remodeling: a systems biology approach
Egea, O. I., Gálvez‐Montón, C., Roura, S., Perea‐Gil, I., Prat‐Vidal, C., Soler‐Botija, C., & Bayés‐Genís, A. (2017) · npj Systems Biology and Applications · doi:10.1038/s41540-017-0013-4 · Cited by 137
Identification of quiescent and spatially restricted mammary stem cells that are hormone responsive
Fu, N. Y., Rios, A. C., Pal, B., Law, C. W., Jamieson, P. R., Liu, R., Vaillant, F., Jackling, F. C., Liu, K. H., Smyth, G. K., et al. (2017) · Nature Cell Biology · doi:10.1038/ncb3471 · Cited by 141
Self-citationGlobal Changes in the Mammary Epigenome Are Induced by Hormonal Cues and Coordinated by Ezh2
Pal, B., Bouras, T., Shi, W., Vaillant, F., Sheridan, J. M., Fu, N. Y., Breslin, K. A., Jiang, K., Ritchie, M. E., Young, M. D., et al. (2013) · Cell Reports · doi:10.1016/j.celrep.2012.12.020 · Cited by 134
Self-citationCabrera, C., Manson, J., Shepherd, J. M., Torrance, H. D. T., Watson, D., Longhi, M. P., Hoti, M., Patel, M. B., O’Dwyer, M. J., Nourshargh, S., et al. (2017) · PLoS Medicine · doi:10.1371/journal.pmed.1002352 · Cited by 120
Association of Ketone Body Levels With Hyperglycemia and Type 2 Diabetes in 9,398 Finnish Men
Mahendran, Y., Vangipurapu, J., Cederberg, H., Stančáková, A., Pihlajamäki, J., Soininen, P., Kangas, A. J., Paananen, J., Civelek, M., Saleem, N. K., et al. (2013) · Diabetes · doi:10.2337/db12-1363 · Cited by 122
Chevrier, S., Emslie, D., Shi, W., Kratina, T., Wellard, C. J., Karnowski, A., Erikçi, E., Smyth, G. K., Chowdhury, K., Tarlinton, D. M., et al. (2014) · The Journal of Experimental Medicine · doi:10.1084/jem.20131831 · Cited by 118
Self-citationCroker, B. A., O’Donnell, J. A., Nowell, C. J., Metcalf, D., Dewson, G., Campbell, K. J., Rogers, K. L., Hu, Y., Smyth, G. K., Zhang, J., et al. (2011) · Proceedings of the National Academy of Sciences · doi:10.1073/pnas.1110358108 · Cited by 116
Self-citationAsselin-Labat, M.-L., Sutherland, K. D., Vaillant, F., Gyorki, D. E., Wu, D., Holroyd, S. L., Breslin, K. A., Ward, T. A., Shi, W., Bath, M. L., et al. (2011) · Molecular and Cellular Biology · doi:10.1128/mcb.05766-11 · Cited by 115
Self-citationIanculescu, I., Wu, D., Siegmund, K. D., & Stallcup, M. R. (2011) · Journal of Biological Chemistry · doi:10.1074/jbc.m111.300194 · Cited by 107
Lacruz, R. S., Smith, C. E., Bringas, P., Chen, Y., Smith, S. M., Snead, M. L., Kurtz, I., Hacia, J. G., Hubbard, M. J., & Paine, M. L. (2011) · Journal of Cellular Physiology · doi:10.1002/jcp.22965 · Cited by 103
Achtman, A. H., Pilat, S., Law, C. W., Lynn, D. J., Janot, L., Mayer, M. L., Ma, S., Kindrachuk, J., Finlay, B. B., Brinkman, F. S. L., et al. (2012) · Science Translational Medicine · doi:10.1126/scitranslmed.3003515 · Cited by 94
Self-citationHaemopedia: An Expression Atlas of Murine Hematopoietic Cells
de Graaf, C. A., Choi, J., Baldwin, T. M., Bolden, J. E., Fairfax, K. A., Robinson, A. J., Biben, C., Morgan, C., Ramsay, K. A., Ng, A. P., et al. (2016) · Stem Cell Reports · doi:10.1016/j.stemcr.2016.07.007 · Cited by 94
Self-citationDegradation of CCNK/CDK12 is a druggable vulnerability of colorectal cancer
Dieter, S. M., Siegl, C., Codó, P. L., Huerta, M., Ostermann-Parucha, A. L., Schulz, E., Zowada, M. K., Martin, S., Laaber, K., Nowrouzi, A., et al. (2021) · Cell Reports · doi:10.1016/j.celrep.2021.109394 · Cited by 95
MOZ (MYST3, KAT6A) inhibits senescence via the INK4A-ARF pathway
Sheikh, B. N., Phipson, B., El-Saafin, F., Vanyai, H. K., Downer, N. L., Bird, M., Kueh, A. J., May, R. E., Smyth, G. K., Voss, A. K., et al. (2015) · Oncogene · doi:10.1038/onc.2015.33 · Cited by 96
Self-citationSkeletal muscle characteristics are preserved in hTERT/cdk4 human myogenic cell lines
Thorley, M., Duguez, S., Mazza, E. M. C., Valsoni, S., Bigot, A., Mamchaoui, K., Harmon, B. T., Voït, T., Mouly, V., & Duddy, W. J. (2016) · Skeletal Muscle · doi:10.1186/s13395-016-0115-5 · Cited by 88
Marques, F. Z., Prestes, P. R., Byars, S., Ritchie, S. C., Würtz, P., Patel, S. K., Booth, S. A., Rana, I., Minoda, Y., Berzins, S. P., et al. (2017) · Journal of the American Heart Association · doi:10.1161/jaha.117.005971 · Cited by 85
Swindell, W. R., Kruse, C. P. S., List, E. O., Berryman, D. E., & Kopchick, J. J. (2019) · Journal of Translational Medicine · doi:10.1186/s12967-019-1909-0 · Cited by 80
Tiffen, J. C., Gunatilake, D., Gallagher, S. J., Gowrishankar, K., Heinemann, A., Cullinane, C. M., Dutton‐Regester, K., Pupo, G. M., Strbenac, D., Yang, J. Y. H., et al. (2015) · Oncotarget · doi:10.18632/oncotarget.4809 · Cited by 81
Scortegagna, M., Ruller, C. M., Feng, Y., Lazova, R. Z., Kluger, H., Li, J., De, S. K., Rickert, R. C., Pellecchia, M., Bosenberg, M., et al. (2013) · Oncogene · doi:10.1038/onc.2013.383 · Cited by 77
5-hydroxymethylcytosine marks promoters in colon that resist DNA hypermethylation in cancer
Uribe‐Lewis, S., Stark, R., Carroll, T. D., Dunning, M., Bachman, M., Ito, Y., Stojic, L., Halim, S., Vowler, S. L., Lynch, A. G., et al. (2015) · Genome biology · doi:10.1186/s13059-015-0605-5 · Cited by 75
Bouchard‐Mercier, A., Paradis, A.-M., Rudkowska, I., Lemieux, S., Couture, P., & Vohl, M. (2013) · Nutrition Journal · doi:10.1186/1475-2891-12-24 · Cited by 81
Cytomegalovirus infection is a risk factor for tuberculosis disease in infants
Müller, J., Tanner, R., Matsumiya, M., Snowden, M. A., Landry, B., Satti, I., Harris, S. A., Tanner, R., O’Shea, M. K., Stockdale, L. K., et al. (2019) · JCI Insight · doi:10.1172/jci.insight.130090 · Cited by 74
The use of miRNA microarrays for the analysis of cancer samples with global miRNA decrease
Wu, D., Hu, Y., Tong, S., Williams, B. R. G., Smyth, G. K., & Gantier, M. P. (2013) · RNA · doi:10.1261/rna.035055.112 · Cited by 71
Self-citationHoeksema, M. A., Scicluna, B. P., Boshuizen, M. C. S., van der Velden, S., Neele, A. E., den Bossche, J. V., Matlung, H. L., van den Berg, T. K., Goossens, P., & de Winther, M. P. J. (2015) · The Journal of Immunology · doi:10.4049/jimmunol.1402077 · Cited by 74
Easy and efficient ensemble gene set testing with EGSEA
Alhamdoosh, M., Law, C. W., Tian, L., Sheridan, J. M., Ng, M., & Ritchie, M. E. (2017) · F1000Research · doi:10.12688/f1000research.12544.1 · Cited by 69
Activated macrophages release microvesicles containing polarized M1 or M2 mRNAs
Garzetti, L., Menon, R., Finardi, A., Bergami, A., Sica, A., Martino, G., Comı, G., Verderio, C., Farina, C., & Furlan, R. (2013) · Journal of Leukocyte Biology · doi:10.1189/jlb.0913485 · Cited by 71
Time-Course Gene Set Analysis for Longitudinal Gene Expression Data
Hejblum, B. P., Skinner, J. A., & Thiébaut, R. (2015) · PLoS Computational Biology · doi:10.1371/journal.pcbi.1004310 · Cited by 66
Stanifer, M. L., Mukenhirn, M., Muenchau, S., Pervolaraki, K., Kanaya, T., Albrecht, D., Odendall, C., Hielscher, T., Haucke, V., Kagan, J. C., et al. (2019) · Nature Microbiology · doi:10.1038/s41564-019-0594-3 · Cited by 65
Erg is required for self-renewal of hematopoietic stem cells during stress hematopoiesis in mice
Ng, A. P., Loughran, S. J., Metcalf, D., Hyland, C. D., de Graaf, C. A., Hu, Y., Smyth, G. K., Hilton, D. J., Kile, B. T., & Alexander, W. S. (2011) · Blood · doi:10.1182/blood-2011-03-344739 · Cited by 65
Self-citationSahu, A., Köse, K., Kraehenbuehl, L., Byers, C., Holland, A., Tembo, T., Santella, A., Alfonso, A., Li, M., Cordova, M. A., et al. (2022) · Nature Communications · doi:10.1038/s41467-022-32738-7 · Cited by 65
Pang, S. H. M., de Graaf, C. A., Hilton, D. J., Huntington, N. D., Carotta, S., Wu, L., & Nutt, S. L. (2018) · Frontiers in Immunology · doi:10.3389/fimmu.2018.01264 · Cited by 60
“Raw intensities were normalized by using the neqc function, which performs background and quantile normalization using control probes (40).”
MethodMorales, A. J., Carrero, J. A., Hung, P. J., Tubbs, A., Andrews, J. M., Edelson, B. T., Calderón, B., Innes, C. L., Paules, R. S., Payton, J. E., et al. (2017) · eLife · doi:10.7554/elife.24655 · Cited by 62
In vitro three-dimensional modeling of fallopian tube secretory epithelial cells
Lawrenson, K., Notaridou, M., Lee, N., Benjamin, E. O., Jacobs, I. J., Jones, C., & Gayther, S. A. (2013) · BMC Cell Biology · doi:10.1186/1471-2121-14-43 · Cited by 59
Walker, E. C., Johnson, R. W., Hu, Y., Brennan, H. J., Poulton, I. J., Zhang, J., Jenkins, B. J., Smyth, G. K., Nicola, N. A., & Sims, N. A. (2016) · Journal of Biological Chemistry · doi:10.1074/jbc.m116.748483 · Cited by 57
Self-citationStatistical approaches for the analysis of DNA methylation microarray data
Siegmund, K. D. (2011) · Human Genetics · doi:10.1007/s00439-011-0993-x · Cited by 56
BeadArray Expression Analysis Using Bioconductor
Ritchie, M. E., Dunning, M., Smith, M. L., Shi, W., & Lynch, A. G. (2011) · PLoS Computational Biology · doi:10.1371/journal.pcbi.1002276 · Cited by 56
Self-citationFutrega, K., Atkinson, K., Lott, W. B., & Doran, M. R. (2017) · Tissue Engineering Part C Methods · doi:10.1089/ten.tec.2016.0329 · Cited by 53
Damas, F., Ugrinowitsch, C., Libardi, C. A., Jannig, P. R., Hector, A. J., McGlory, C., Lixandrão, M. E., VECHIN, F. C., Montenegro, H., Tricoli, V., et al. (2018) · European Journal of Applied Physiology · doi:10.1007/s00421-018-3984-y · Cited by 51
Peripheral Blood MCEMP1 Gene Expression as a Biomarker for Stroke Prognosis
Raman, K., O'Donnell, M. J., Członkowska, A., Duarte, Y., López-Jaramillo, P. A., Peñaherrera, E., Sharma, M., Shoamanesh, A., Skowrońska, M., Yusuf, S., et al. (2016) · Stroke · doi:10.1161/strokeaha.115.011854 · Cited by 49
Schmitt, K., Molfenter, B., Laureano, N. K., Tawk, B., Bieg, M., Hostench, X. P., Weichenhan, D., Ullrich, N. D., Shang, V., Richter, D., et al. (2019) · International Journal of Cancer · doi:10.1002/ijc.32481 · Cited by 48
Kitchen, R. R., Sabine, V. S., Simen, A. A., Dixon, J. M., Bartlett, J. M. S., & Sims, A. H. (2011) · BMC Genomics · doi:10.1186/1471-2164-12-589 · Cited by 49
Cystatin SN Upregulation in Patients with Seasonal Allergic Rhinitis
Imoto, Y., Tokunaga, T., Matsumoto, Y., Hamada, Y., Ono, M., Yamada, T., Ito, Y., Arinami, T., Okano, M., Noguchi, E., et al. (2013) · PLoS ONE · doi:10.1371/journal.pone.0067057 · Cited by 47
Under salt stress guard cells rewire ion transport and abscisic acid signaling
Karimi, S. M., Freund, M., Wager, B. M., Knoblauch, M., Fromm, J. H., Mueller, H. M., Ache, P., Krischke, M., Mueller, M. J., Müller, T., et al. (2021) · New Phytologist · doi:10.1111/nph.17376 · Cited by 46
Genome-Wide Identification of Expression Quantitative Trait Loci (eQTLs) in Human Heart
Koopmann, T. T., Adriaens, M. E., Moerland, P. D., Marsman, R. F. J., Westerveld, M., Lal, S., Zhang, T., Simmons, C. Q., Baczkó, I., dos Remedios, C. G., et al. (2014) · PLoS ONE · doi:10.1371/journal.pone.0097380 · Cited by 48
Increased β-cell proliferation before immune cell invasion prevents progression of type 1 diabetes
Dirice, E., Kahraman, S., Jesus, D. F. D., Ouaamari, A. E., Basile, G., Baker, R. L., Yigit, B., Piehowski, P., Kim, M., Dwyer, A. J., et al. (2019) · Nature Metabolism · doi:10.1038/s42255-019-0061-8 · Cited by 46
Marsay, L., Matsumiya, M., Tanner, R., Poyntz, H., Griffiths, K., Stylianou, E., Marsh, P. D., Williams, A., Sharpe, S. A., Fletcher, H. A., et al. (2013) · Tuberculosis · doi:10.1016/j.tube.2013.04.007 · Cited by 46
STAT5 Activation in the Dermal Papilla Is Important for Hair Follicle Growth Phase Induction
Legrand, J. M. D., Roy, E., Ellis, J. J., François, M., Brooks, A. J., & Khosrotehrani, K. (2016) · Journal of Investigative Dermatology · doi:10.1016/j.jid.2016.04.014 · Cited by 50
Human induced pluripotent stem cell derived neurons as a model for Williams-Beuren syndrome
Khattak, S., Brimble, E., Zhang, W., Zaslavsky, K., Strong, E., Ross, P. J., Hendry, J. A., Mital, S. R., Salter, M. W., Osborne, L. R., et al. (2015) · Molecular Brain · doi:10.1186/s13041-015-0168-0 · Cited by 43
A comprehensive database for integrated analysis of omics data in autoimmune diseases
Martorell‐Marugán, J., López-Domínguez, R., García-Moreno, A., Dominguez, D. T., Villatoro-García, J. A., Barturen, G., Martín-Gómez, A., Troulé, K., Goméz-López, G., Al‐Shahrour, F., et al. (2021) · BMC Bioinformatics · doi:10.1186/s12859-021-04268-4 · Cited by 44
Romay, M. C., Che, N., Becker, S. N., Pouldar, D., Hagopian, R., Xiao, X. G., Lusis, A. J., Berliner, J. A., & Civelek, M. (2014) · Journal of Lipid Research · doi:10.1194/jlr.m052670 · Cited by 46
Gene‐expression analysis of early‐ and late‐maturation‐stage rat enamel organ
Lacruz, R. S., Smith, C. E., Chen, Y., Hubbard, M. J., Hacia, J. G., & Paine, M. L. (2011) · European Journal Of Oral Sciences · doi:10.1111/j.1600-0722.2011.00881.x · Cited by 43
Epigenetic Regulator Smchd1 Functions as a Tumor Suppressor
Leong, H. S., Chen, K., Hu, Y., Lee, S. C.-W., Corbin, J. E., Pakusch, M., Murphy, J. M., Majewski, I. J., Smyth, G. K., Alexander, W. S., et al. (2012) · Cancer Research · doi:10.1158/0008-5472.can-12-3019 · Cited by 43
Self-citationHamers, A. A. J., Argmann, C., Moerland, P. D., Koenis, D. S., Marinković, G., Sokolović, M., de Vos, A. F., de Vries, C. J. M., & van Tiel, C. M. (2016) · BMC Genomics · doi:10.1186/s12864-016-2469-9 · Cited by 43
Deane, C. S., Willis, C. R. G., Phillips, B. E., Atherton, P. J., Harries, L. W., Ames, R. M., Szewczyk, N. J., & Etheridge, T. (2021) · Journal of Cachexia Sarcopenia and Muscle · doi:10.1002/jcsm.12706 · Cited by 42
Wentworth, J. M., Naselli, G., Ngui, K., Smyth, G. K., Liu, R., O’Brien, P. E., Bruce, C. R., Weir, J. M., Cinel, M. A., Meikle, P. J., et al. (2015) · International Journal of Obesity · doi:10.1038/ijo.2015.223 · Cited by 42
Self-citationSmall-molecule and CRISPR screening converge to reveal RTK dependencies in pediatric rhabdoid tumors
Oberlick, E. M., Rees, M., Seashore-Ludlow, B., Vazquez, F., Nelson, G. M., Dharia, N., Weir, B., Tsherniak, A., Ghandi, M., Krill-Burger, J., et al. (2019) · Cell Reports · doi:10.1016/j.celrep.2019.07.021 · Cited by 40
Transcriptome analysis reveals novel genes and immune networks dysregulated in veterans with PTSD
Mehta, D., Voisey, J., Bruenig, D., Harvey, W., Morris, C. P., Lawford, B. R., & Young, R. M. (2018) · Brain Behavior and Immunity · doi:10.1016/j.bbi.2018.08.014 · Cited by 41
Kok, C. H., Yeung, D. T. O., Liu, L., Watkins, D. B., Leclercq, T. M., Dang, P., Saunders, V. A., Reynolds, J., White, D. L., & Hughes, T. P. (2019) · Blood Advances · doi:10.1182/bloodadvances.2019000195 · Cited by 40
Robertson, M. J., Soibam, B., O’Leary, J. G., Sampaio, L. C., & Taylor, D. A. (2018) · PLoS ONE · doi:10.1371/journal.pone.0191892 · Cited by 38
Miyano, M., Sayaman, R. W., Stoiber, M. H., Lin, C., Stampfer, M. R., Brown, J., & LaBarge, M. A. (2017) · Aging · doi:10.18632/aging.101298 · Cited by 36
Shen, S., Bai, J., Wei, Y., Wang, G., Li, Q., Zhang, R., Duan, W., Yang, S., Du, M., Zhao, Y., et al. (2017) · Oncology Reports · doi:10.3892/or.2017.6057 · Cited by 36
Regulation of mycobacterial infection by macrophage Gch1 and tetrahydrobiopterin
McNeill, E., Stylianou, E., Crabtree, M. J., Harrington-Kandt, R., Kolb, A.-L., Diotallevi, M., Hale, A., Bettencourt, P. J. G., Tanner, R., O’Shea, M. K., et al. (2018) · Nature Communications · doi:10.1038/s41467-018-07714-9 · Cited by 35
Hartnell, F., Brown, A., Capone, S., Kopycinski, J. T., Bliss, C. M., Makvandi‐Nejad, S., Swadling, L., Ghaffari, E., Cicconi, P., Sorbo, M. D., et al. (2019) · Frontiers in Immunology · doi:10.3389/fimmu.2018.03175 · Cited by 36
Berghoff, A. S., Liao, Y., Karreman, M. A., Ilhan‐Mutlu, A., Gunkel, K., Sprick, M. R., Eisen, C., Keßler, T., Osswald, M., Wünsche, S., et al. (2020) · Molecular Cancer Research · doi:10.1158/1541-7786.mcr-20-0863 · Cited by 37
Potts, K. S., Sargeant, T., Dawson, C. A., Josefsson, E. C., Hilton, D. J., Alexander, W. S., & Taoudi, S. (2015) · Blood · doi:10.1182/blood-2014-12-616607 · Cited by 34
Ward, M. A., Pierre, J. F., Leal, R. F., Huang, Y., Shogan, B. D., Dalal, S. R., Weber, C. R., Leone, V., Musch, M. W., An, G. C., et al. (2016) · American Journal of Physiology-Gastrointestinal and Liver Physiology · doi:10.1152/ajpgi.00017.2016 · Cited by 34
The influence of haemoglobin and iron on in vitro mycobacterial growth inhibition assays
Tanner, R., O’Shea, M. K., White, A., Müller, J., Harrington-Kandt, R., Matsumiya, M., Dennis, M. J., Parizotto, E. A., Harris, S. A., Stylianou, E., et al. (2017) · Scientific Reports · doi:10.1038/srep43478 · Cited by 34
Berlanga‐Taylor, A. J., Plant, K., Dahl, A., Lau, E., Hill, M., Sims, D., Heger, A., Emberson, J., Armitage, J., Clarke, R., et al. (2018) · EBioMedicine · doi:10.1016/j.ebiom.2018.04.010 · Cited by 34
Early Lineage Priming by Trisomy of Erg Leads to Myeloproliferation in a Down Syndrome Model
Ng, A. P., Hu, Y., Metcalf, D., Hyland, C. D., Ierino, H., Phipson, B., Wu, D., Baldwin, T. M., Kauppi, M., Kiu, H., et al. (2015) · PLoS Genetics · doi:10.1371/journal.pgen.1005211 · Cited by 33
Self-citationGenome-wide impact of hydrogen peroxide on maintenance DNA methylation in replicating cells
Seddon, A. R., Liau, Y., Pace, P., Miller, A. L., Das, A. B., Kennedy, M. A., Hampton, M. B., & Stevens, A. J. (2021) · Epigenetics & Chromatin · doi:10.1186/s13072-021-00388-6 · Cited by 34
The effect of air pollution on the transcriptomics of the immune response to respiratory infection
Croft, D. P., Burton, D. S., Nagel, D. J., Bhattacharya, S., Falsey, A. R., Georas, S. N., Hopke, P. K., Johnston, C. J., Kottmann, R. M., Litonjua, A. A., et al. (2021) · Scientific Reports · doi:10.1038/s41598-021-98729-8 · Cited by 34
Divergent Influence of MicroRNA-21 Deletion on Murine Colitis Phenotypes
Wu, F., Dong, F., Arendovich, N., Zhang, J., Huang, Y., & Kwon, J. H. (2014) · Inflammatory Bowel Diseases · doi:10.1097/mib.0000000000000201 · Cited by 34
de Masson, A., Kirilovsky, A., Zoorob, R., Avettand-Fènoël, V., Morin, V., Oudin, A., Descours, B., Rouzioux, C., & Autran, B. (2014) · AIDS · doi:10.1097/qad.0000000000000295 · Cited by 32
Wentworth, J. M., Zhang, J.-G., Bandala‐Sanchez, E., Naselli, G., Liu, R., Ritchie, M. E., Smyth, G. K., O'Brien, P. E., & Harrison, L. C. (2017) · International Journal of Obesity · doi:10.1038/ijo.2017.180 · Cited by 31
Self-citationAbrogating GPT2 in triple‐negative breast cancer inhibits tumor growth and promotes autophagy
Mitra, D., Vega-Rubín-de-Celis, S., Royla, N., Bernhardt, S., Wilhelm, H., Tarade, N., Poschet, G., Buettner, M., Binenbaum, I., Borgoni, S., et al. (2020) · International Journal of Cancer · doi:10.1002/ijc.33456 · Cited by 30
Norrin/Frizzled4 signalling in the preneoplastic niche blocks medulloblastoma initiation
Bassett, E. A., Tokarew, N. J. A., Allemano, E. A., Mazerolle, C. J., Morin, K., Mears, A. J., McNeill, B., Ringuette, R., Campbell, C. M., Smiley, S., et al. (2016) · eLife · doi:10.7554/elife.16764 · Cited by 30
Guihot, A., Luyt, C. E., Parrot, A., Rousset, D., Cavaillon, J., Boutolleau, D., Fitting, C., Pajanirassa, P., Mallet, A., Fartoukh, M. S., et al. (2014) · American Journal of Respiratory and Critical Care Medicine · doi:10.1164/rccm.201311-2071oc · Cited by 30
HIV-1 Vpr Induces Widespread Transcriptomic Changes in CD4 + T Cells Early Postinfection
Bauby, H., Ward, C. C., Hugh-White, R., Swanson, C. M., Schulz, R., Goujon, C., & Malim, M. H. (2021) · mBio · doi:10.1128/mbio.01369-21 · Cited by 32
Matsumiya, M., Satti, I., Chomka, A., Harris, S. A., Stockdale, L. K., Meyer, J., Fletcher, H. A., & McShane, H. (2014) · The Journal of Infectious Diseases · doi:10.1093/infdis/jiu615 · Cited by 29
Metadata
- Authors
- Shi, W., Oshlack, A., & Smyth, G. K.
- Affiliations
- The University of Melbourne (AU)
- Corresponding author
- Shi, Wei
- Smyth, Gordon K.
- Venue
- Nucleic Acids Research
- Publisher
- Oxford University Press (OUP)
- Published
- 2010-10-06
- Volume
- 38
- Issue
- 22
- Pages
- e204-e204
- ISSN
- 0305-1048 (ISSN-L)
- 1362-4962
- PMC
- PMC3001098
- OpenAlex
- W2118373398
- Cited by
- 225
- References
- 32
- Citations by year
- 2026: 5 · 2025: 4 · 2024: 8 · 2023: 10 · 2022: 13 · 2021: 15 · 2020: 11 · 2019: 20 · 2018: 14 · 2017: 19 · 2016: 28 · 2015: 23 · 2014: 15 · 2013: 20 · 2012: 9
- FWCI
- 5.21
- Type
- journal article
- Language
- en
- Open access
- gold
- doi.org
- Licence
- Locations
- Nucleic Acids Research (publishedVersion, cc-by-nc)
- PubMed Central (publishedVersion, cc-by-nc)
- PubMed (publishedVersion)
- Minerva Access (University of Melbourne) (submittedVersion, cc-by-nc)
- HighWire Press Open Archive (submittedVersion)
- Funders
- Medical Research Council
- National Health and Medical Research Council (490037)
- Topics
- Life Sciences › Biochemistry, Genetics and Molecular Biology › Molecular Biology › Gene expression and cancer classification
- Life Sciences › Biochemistry, Genetics and Molecular Biology › Molecular Biology › Genomics and Phylogenetic Studies
- Life Sciences › Biochemistry, Genetics and Molecular Biology › Molecular Biology › Bioinformatics and Genomic Networks
- Keywords
- variance stabilizing transformation, background correction, false discovery rate, normalization, gene expression data
- MeSH terms
- Algorithms, Humans, Reproducibility of Results, Oligonucleotide Probes, Genome, Oligonucleotide Array Sequence Analysis, Gene Expression Profiling
About these checks
Registry, retraction, Cites and statistics results are computed, not judged, with one exception: a printed reference that no index lists is read once by a model before it counts as a citation error. Claims are extracted by a model and kept only when their quote appears verbatim in the text; each cited source is then checked, with a model’s help, for whether it says what the claim relies on. Those verdicts can be wrong — read the claim’s quote and the cited source before relying on one.
Statistics and arithmetic are recomputed, not judged.
Confidence bands are shown only for fields calibrated on our annotated test set. None is calibrated yet, so no band is shown.
What counts as a claim ›How we measure confidence ›How we check this ›
Are you an author, or do you see a problem with this page? Request a review
