

The DOI matches its Crossref record; 59 of the 59 references it cites were found in a registry or an index.
A comprehensive comparison of RNA-Seq-based transcriptome analysis from reads to differential gene expression and cross-comparison with microarrays: a case study in Saccharomyces cerevisiae
Open accessAbstract
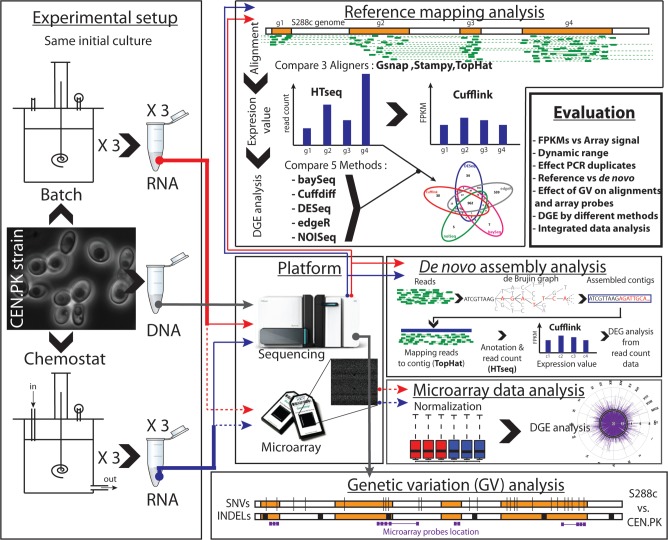
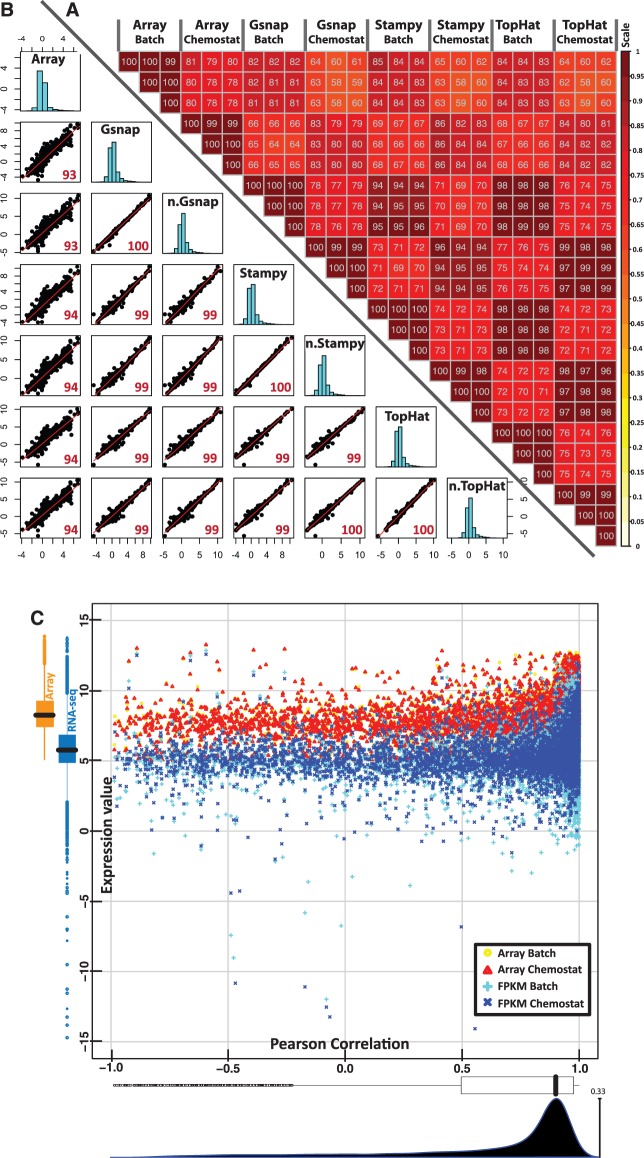
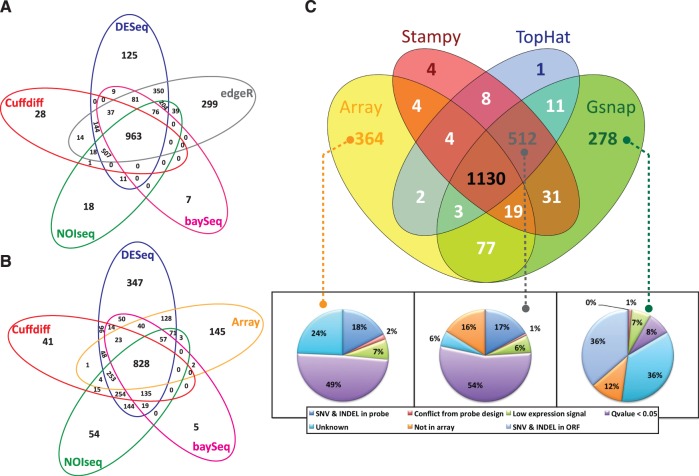
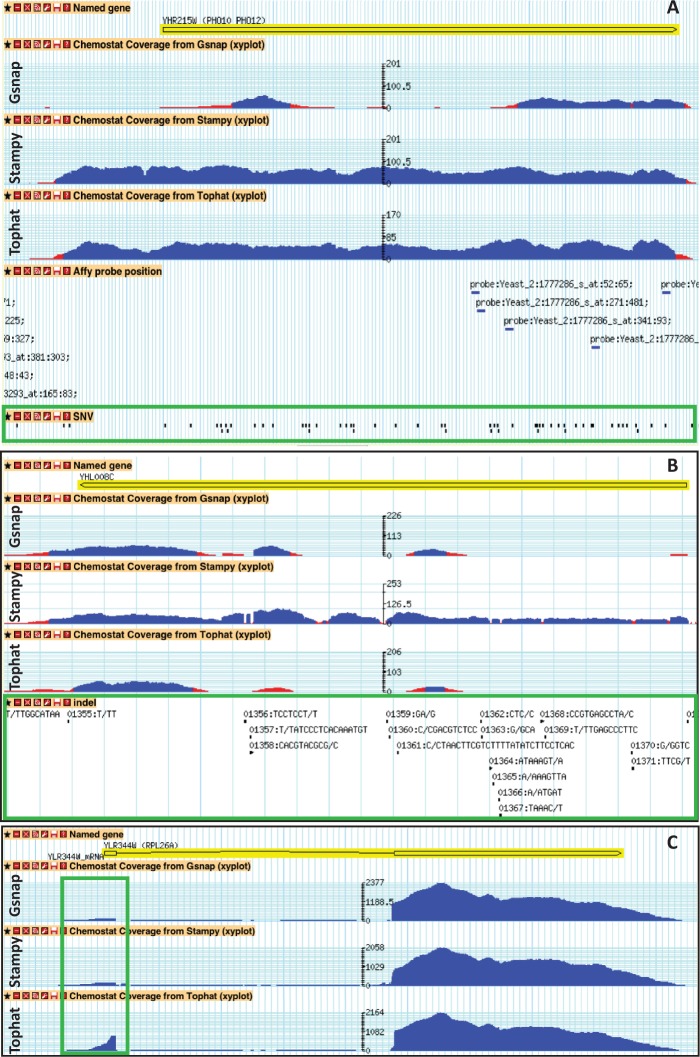
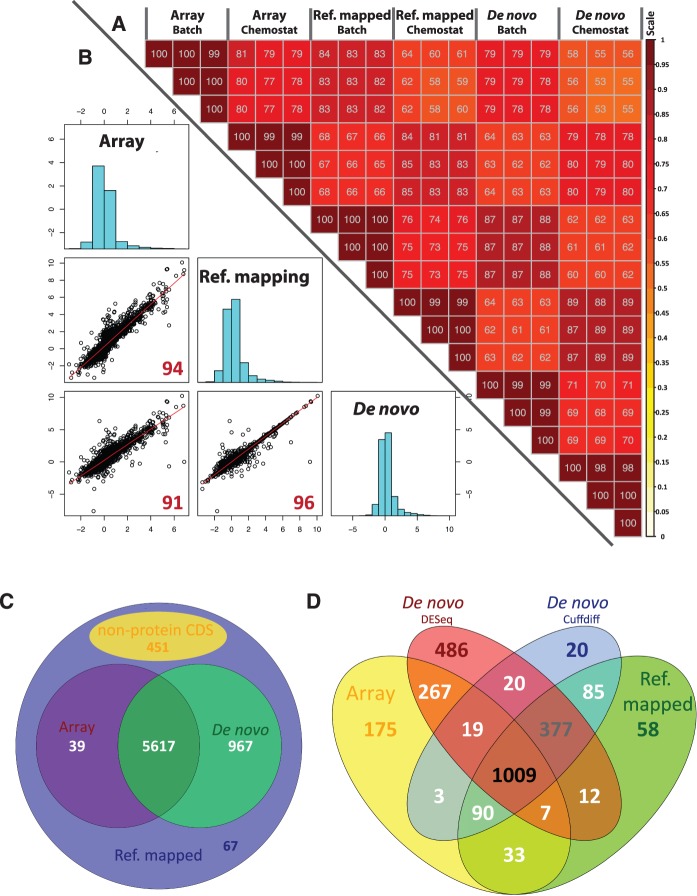
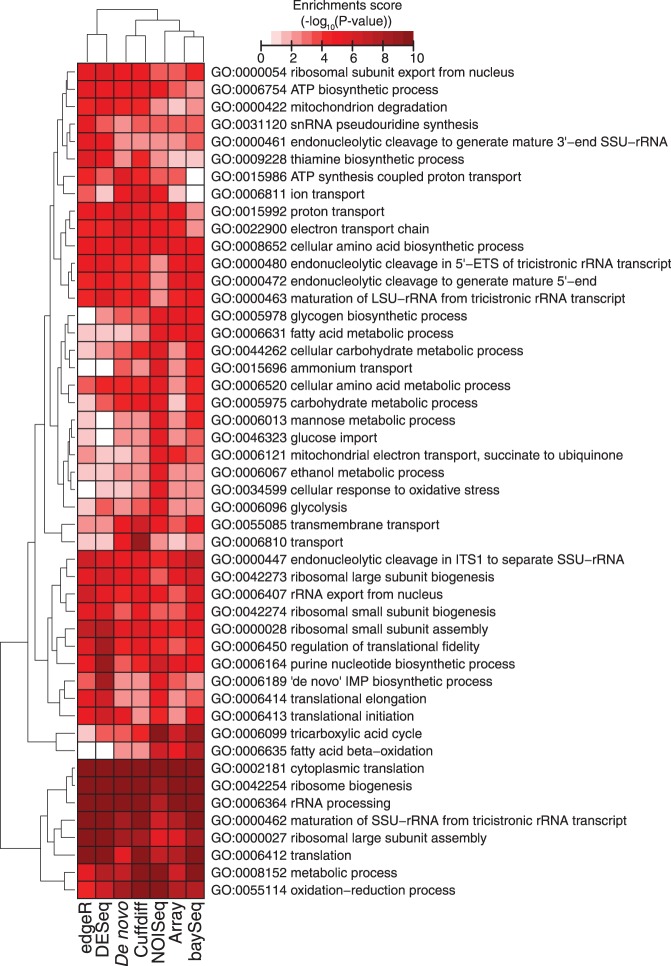
RNA-seq, has recently become an attractive method of choice in the studies of transcriptomes, promising several advantages compared with microarrays. In this study, we sought to assess the contribution of the different analytical steps involved in the analysis of RNA-seq data generated with the Illumina platform, and to perform a cross-platform comparison based on the results obtained through Affymetrix microarray. As a case study for our work we, used the Saccharomyces cerevisiae strain CEN.PK 113-7D, grown under two different conditions (batch and chemostat). Here, we asses the influence of genetic variation on the estimation of gene expression level using three different aligners for read-mapping (Gsnap, Stampy and TopHat) on S288c genome, the capabilities of five different statistical methods to detect differential gene expression (baySeq, Cuffdiff, DESeq, edgeR and NOISeq) and we explored the consistency between RNA-seq analysis using reference genome and de novo assembly approach. High reproducibility among biological replicates (correlation≥0.99) and high consistency between the two platforms for analysis of gene expression levels (correlation≥0.91) are reported. The results from differential gene expression identification derived from the different statistical methods, as well as their integrated analysis results based on gene ontology annotation are in good agreement. Overall, our study provides a useful and comprehensive comparison between the two platforms (RNA-seq and microrrays) for gene expression analysis and addresses the contribution of the different steps involved in the analysis of RNA-seq data.
Overview
The claims and statistics of this paper haven’t been checked yet.
Run the check — free, no account needed. It reads the open-access text and checks the sources it cites.
Integrity signals
Registry
Cites
Statistics
Figures
Verification
Claims the paper makes
The claims and statistics of this paper haven’t been checked yet.
Run the check — free, no account needed. It reads the open-access text and checks the sources it cites.
Claims other papers make about this one
Each is checked against this paper’s own text: does it say what the citing paper says it does?
The source backs part of the claim, not all of it — or backs it for a different population, condition or comparison.
In the citing paper
“DESeq and edgeR perform similarly in ranking genes but are often relatively conservative or too liberal, respectively, in controlling FDR [63, 209, 210].”
From A survey of best practices for RNA-seq data analysis (2016) · cites this paper as [210]
Experimental — accuracy not yet measuredIn the citing paper
“As simulations typically rely on specific statistical distributions or on limited experimental datasets and as spike-in datasets represent only technical replicates with minimal variation, comparisons using simulated datasets have been complemented with more practical comparisons in real datasets with true biological replicates [64, 210, 211].”
From A survey of best practices for RNA-seq data analysis (2016) · cites this paper as [210]
Self-check
Percentages, sums and reported differences re-computed from the paper’s own numbers.
The self-check needs the paper’s full text.
Citations
Cites
The Sequence Alignment/Map format and SAMtools
Li, H., Handsaker, B., Wysoker, A., Fennell, T., Ruan, J., Homer, N., Marth, G., Abecasis, G., Durbin, R., & 1000 Genome Project Data Processing Subgroup (2009) · Bioinformatics · doi:10.1093/bioinformatics/btp352 · Cited by 62,041
Fast and accurate short read alignment with Burrows-Wheeler transform
Li, H., & Durbin, R. (2009) · Bioinformatics · doi:10.1093/bioinformatics/btp324 · Cited by 58,607
Robinson, M. D., McCarthy, D. J., & Smyth, G. K. (2010) · Bioinformatics · doi:10.1093/bioinformatics/btp616 · Cited by 41,364
The Genome Analysis Toolkit: A MapReduce framework for analyzing next-generation DNA sequencing data
McKenna, A., Hanna, M., Banks, E., Sivachenko, A., Cibulskis, K., Kernytsky, A., Garimella, K., Altshuler, D., Gabriel, S., Daly, M., et al. (2010) · Genome Research · doi:10.1101/gr.107524.110 · Cited by 27,895
BEDTools: a flexible suite of utilities for comparing genomic features
Quinlan, A. R., & Hall, I. M. (2010) · Bioinformatics · doi:10.1093/bioinformatics/btq033 · Cited by 27,437
Full-length transcriptome assembly from RNA-Seq data without a reference genome
Grabherr, M. G., Haas, B. J., Yassour, M., Levin, J. Z., Thompson, D. A., Amit, I., Adiconis, X., Fan, L., Raychowdhury, R., Zeng, Q., et al. (2011) · Nature Biotechnology · doi:10.1038/nbt.1883 · Cited by 21,201
Differential expression analysis for sequence count data
Anders, S., & Huber, W. (2010) · Genome Biology · doi:10.1186/gb-2010-11-10-r106 · Cited by 15,581
Trapnell, C., Williams, B. A., Pertea, G., Mortazavi, A., Kwan, G., van Baren, M. J., Salzberg, S. L., Wold, B. J., & Pachter, L. (2010) · Nature Biotechnology · doi:10.1038/nbt.1621 · Cited by 15,556
Mapping and quantifying mammalian transcriptomes by RNA-Seq
Mortazavi, A., Williams, B. A., McCue, K., Schaeffer, L., & Wold, B. (2008) · Nature Methods · doi:10.1038/nmeth.1226 · Cited by 13,696
RNA-Seq: a revolutionary tool for transcriptomics
Wang, Z., Gerstein, M., & Snyder, M. (2009) · Nature Reviews Genetics · doi:10.1038/nrg2484 · Cited by 13,174
Cited by
Sorted by citations
featureCounts: an efficient general purpose program for assigning sequence reads to genomic features
Liao, Y., Smyth, G. K., & Shi, W. (2014) · Bioinformatics · doi:10.1093/bioinformatics/btt656 · Cited by 27,219
Waste Not, Want Not: Why Rarefying Microbiome Data Is Inadmissible
McMurdie, P. J., & Holmes, S. (2014) · PLoS Computational Biology · doi:10.1371/journal.pcbi.1003531 · Cited by 3,034
A survey of best practices for RNA-seq data analysis
Conesa, A., Madrigal, P., Tarazona, S., Gomez-Cabrero, D., Cervera, A., McPherson, A., Szcześniak, M. W., Gaffney, D. J., Elo, L. L., Zhang, X., et al. (2016) · Genome Biology · doi:10.1186/s13059-016-0881-8 · Cited by 2,794
Sequencing depth and coverage: key considerations in genomic analyses
Sims, D., Sudbery, I. M., Ilott, N. E., Heger, A., & Ponting, C. P. (2014) · Nature Reviews Genetics · doi:10.1038/nrg3642 · Cited by 1,488
Count-based differential expression analysis of RNA sequencing data using R and Bioconductor
Anders, S., McCarthy, D. J., Chen, Y., Okoniewski, M. J., Smyth, G. K., Huber, W. K., & Robinson, M. D. (2013) · Nature Protocols · doi:10.1038/nprot.2013.099 · Cited by 1,170
Metadata
- Authors
- Nookaew, I., Papini, M., Pornputtapong, N., Scalcinati, G., Fagerberg, L., Uhlén, M., & Nielsen, J.
- Affiliations
- Chalmers University of Technology (SE)
- Novo Nordisk Foundation (DK)
- Corresponding author
- Nielsen, Jens
- Venue
- Nucleic Acids Research
- Publisher
- Oxford University Press (OUP)
- Published
- 2012-09-08
- Volume
- 40
- Issue
- 20
- Pages
- 10084-10097
- ISSN
- 0305-1048 (ISSN-L)
- 1362-4962
- PMC
- PMC3488244
- OpenAlex
- W2102921564
- Cited by
- 309
- References
- 59
- Citations by year
- 2026: 1 · 2025: 8 · 2024: 9 · 2023: 9 · 2022: 19 · 2021: 10 · 2020: 17 · 2019: 31 · 2018: 30 · 2017: 25 · 2016: 40 · 2015: 33 · 2014: 44 · 2013: 30 · 2012: 2
- FWCI
- 14.02
- Type
- journal article
- Language
- en
- Open access
- gold
- doi.org
- Licence
- Locations
- Nucleic Acids Research (publishedVersion, cc-by-nc)
- Europe PMC (PubMed Central) (publishedVersion, cc-by-nc)
- PubMed Central (publishedVersion, cc-by-nc)
- PubMed (publishedVersion)
- HighWire Press Open Archive (submittedVersion)
- Chalmers Publication Library (Chalmers University of Technology) (submittedVersion)
- Technical University of Denmark, DTU Orbit (Technical University of Denmark, DTU) (submittedVersion, cc-by-nc)
- Chalmers Research (Chalmers University of Technology) (submittedVersion)
- Funders
- Novo Nordisk Fonden (NNF10CC1016517)
- Topics
- Life Sciences › Biochemistry, Genetics and Molecular Biology › Molecular Biology › Genomics and Phylogenetic Studies
- Life Sciences › Biochemistry, Genetics and Molecular Biology › Molecular Biology › Gene expression and cancer classification
- Life Sciences › Biochemistry, Genetics and Molecular Biology › Molecular Biology › Single-cell and spatial transcriptomics
- Keywords
- RNA-seq, gene expression profiling, differential gene expression, microarray comparison, Saccharomyces cerevisiae, read mapping, de novo assembly, reference genome, gene ontology annotation, S288c
- MeSH terms
- Base Sequence, Chromosome Mapping, Data Interpretation, Statistical, Molecular Sequence Data, Saccharomyces cerevisiae, Software, Reproducibility of Results, Genome, Fungal, Sequence Analysis, RNA, Oligonucleotide Array Sequence Analysis, Polymorphism, Single Nucleotide, Gene Expression Profiling, INDEL Mutation, High-Throughput Nucleotide Sequencing
About these checks
Registry, retraction, Cites and statistics results are computed, not judged, with one exception: a printed reference that no index lists is read once by a model before it counts as a citation error. Claims are extracted by a model and kept only when their quote appears verbatim in the text; each cited source is then checked, with a model’s help, for whether it says what the claim relies on. Those verdicts can be wrong — read the claim’s quote and the cited source before relying on one.
Statistics and arithmetic are recomputed, not judged.
Confidence bands are shown only for fields calibrated on our annotated test set. None is calibrated yet, so no band is shown.
What counts as a claim ›How we measure confidence ›How we check this ›
Are you an author, or do you see a problem with this page? Request a review
