

The DOI matches its Crossref record; 57 of the 57 references it cites were found in a registry or an index.
The influence of CpG and UpA dinucleotide frequencies on RNA virus replication and characterization of the innate cellular pathways underlying virus attenuation and enhanced replication
Open accessAbstract
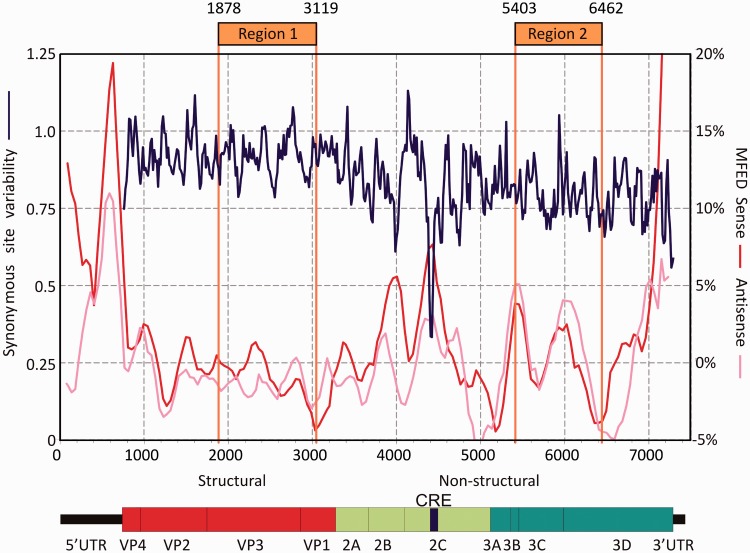
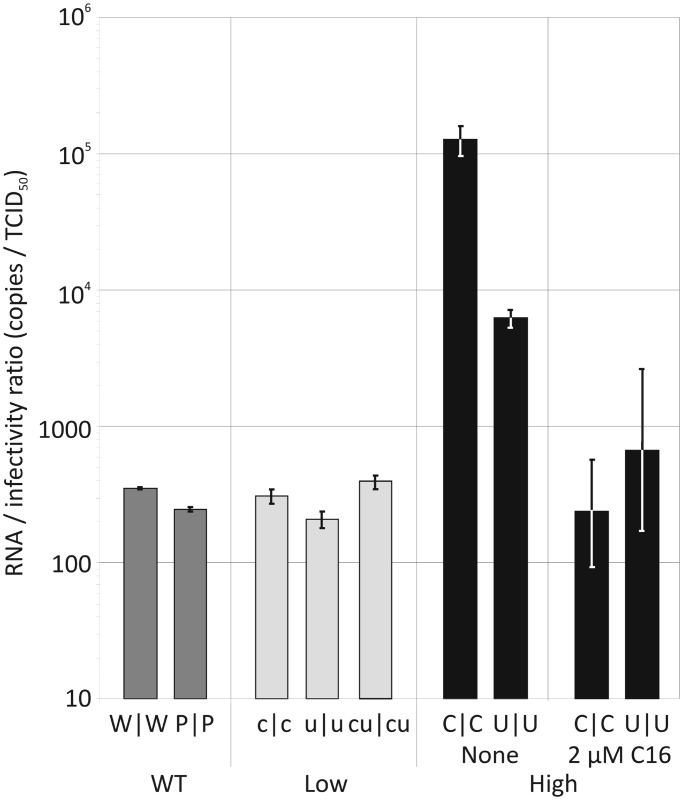
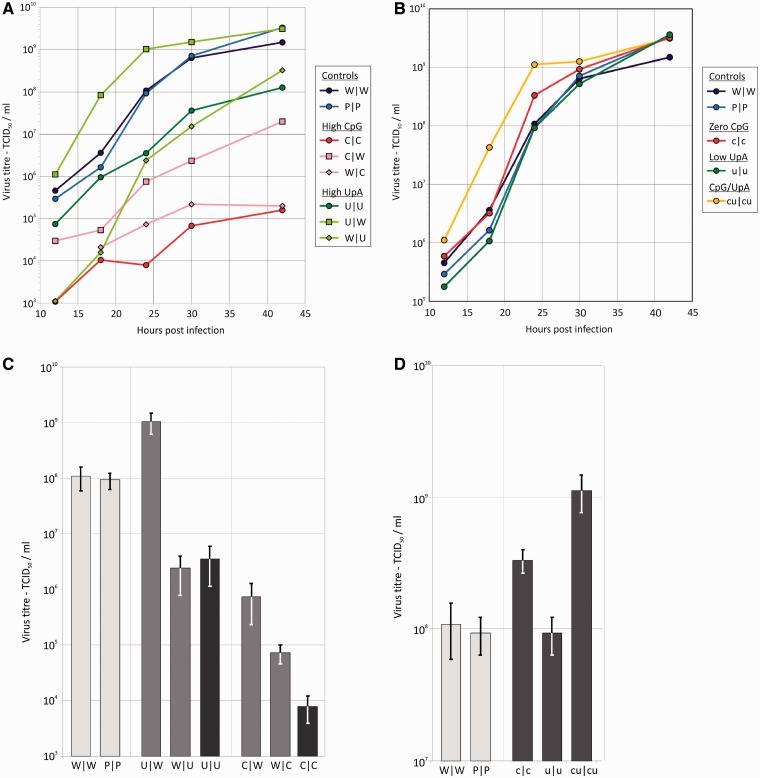
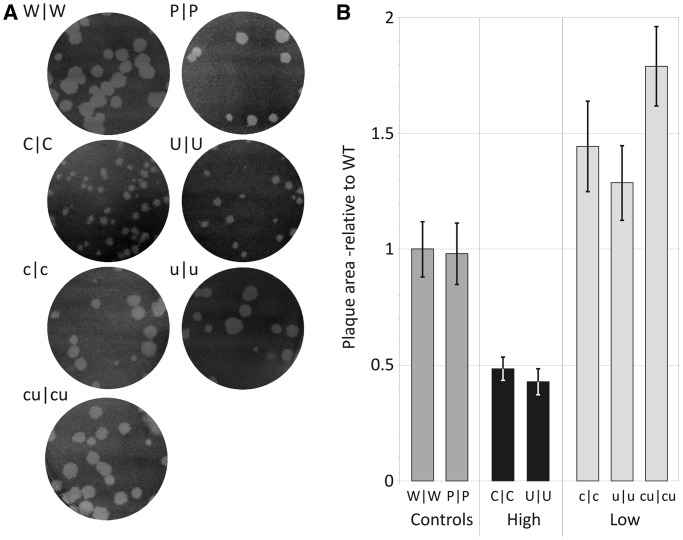
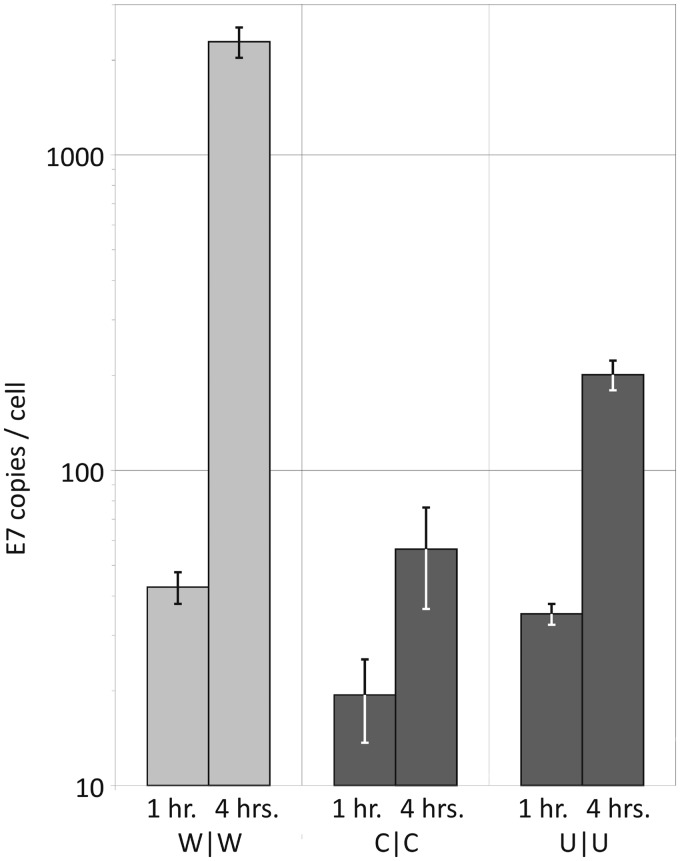
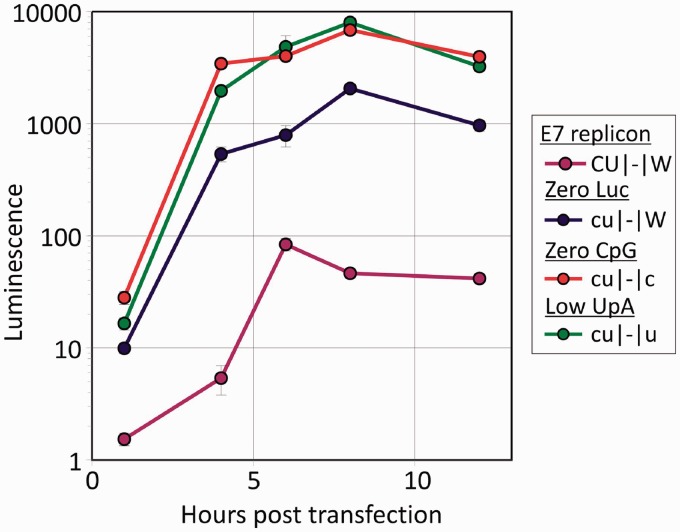
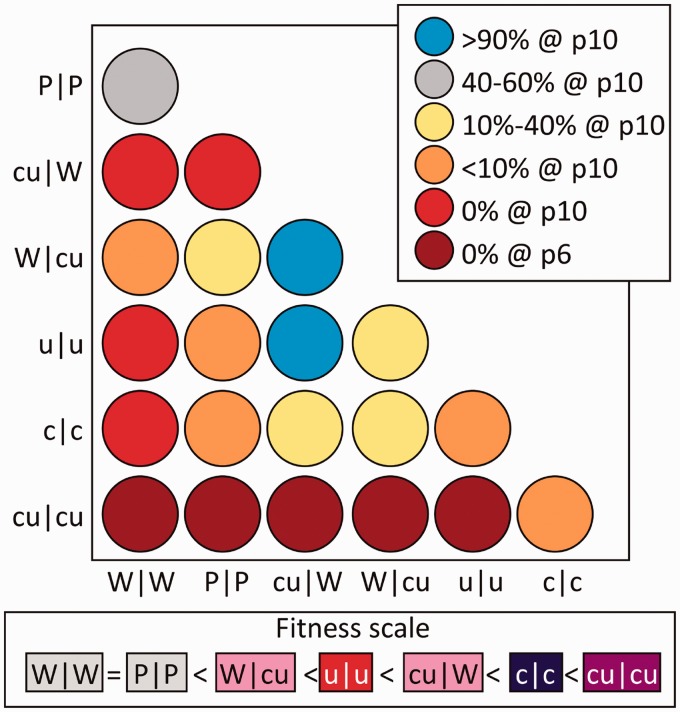
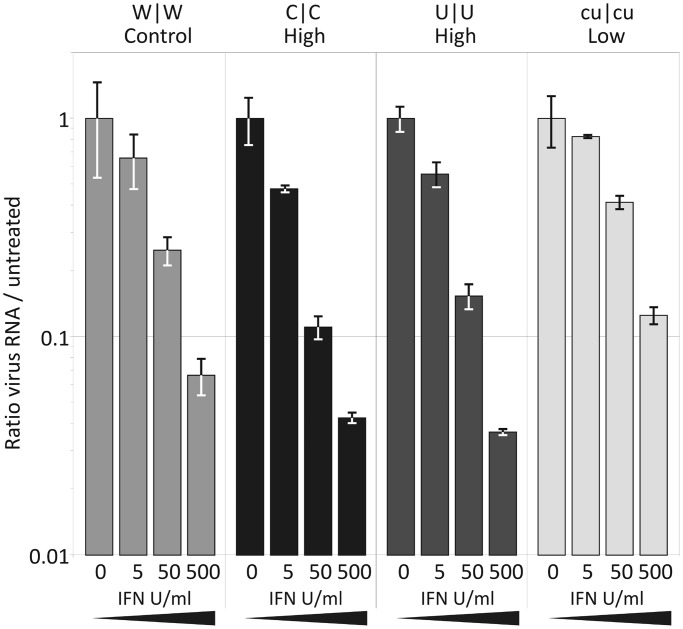
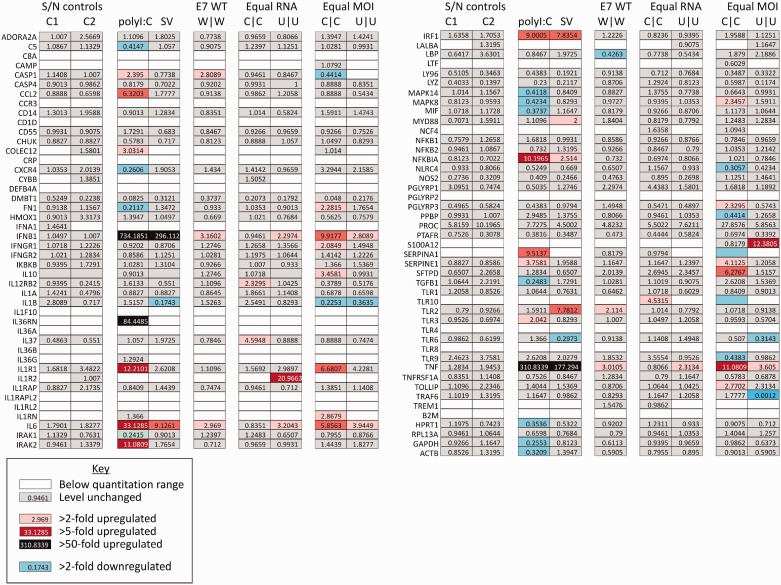
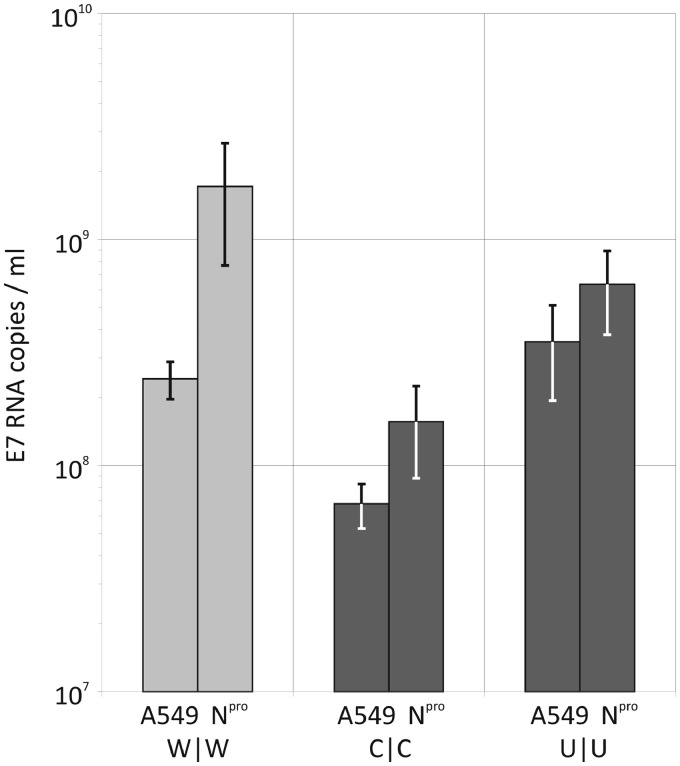
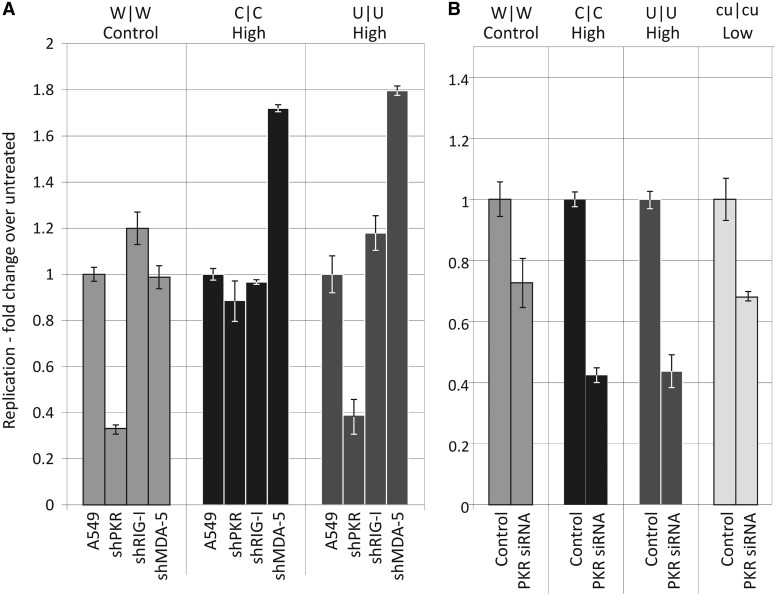
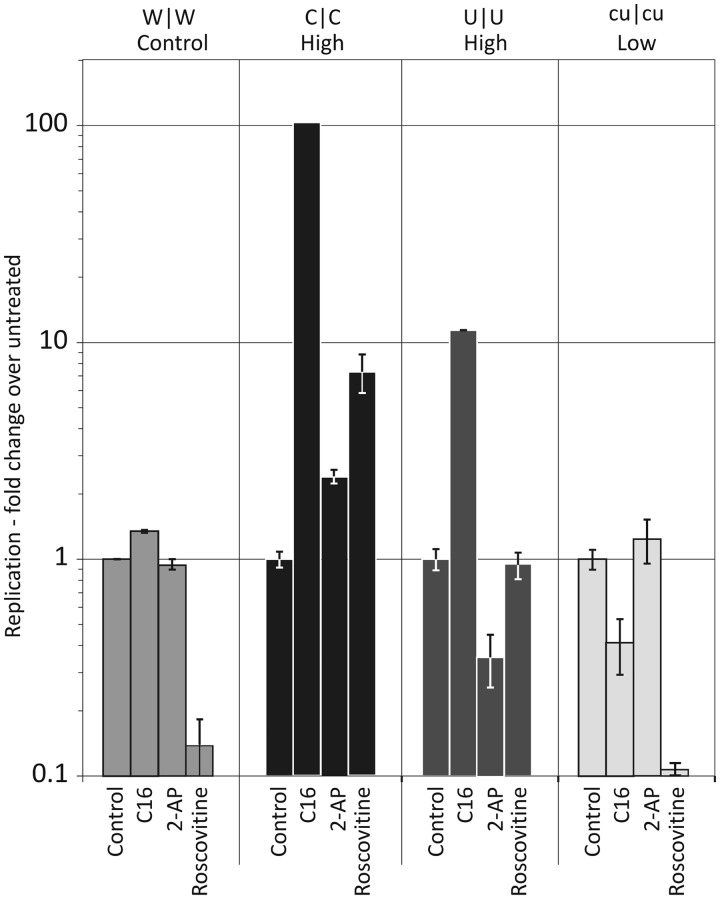
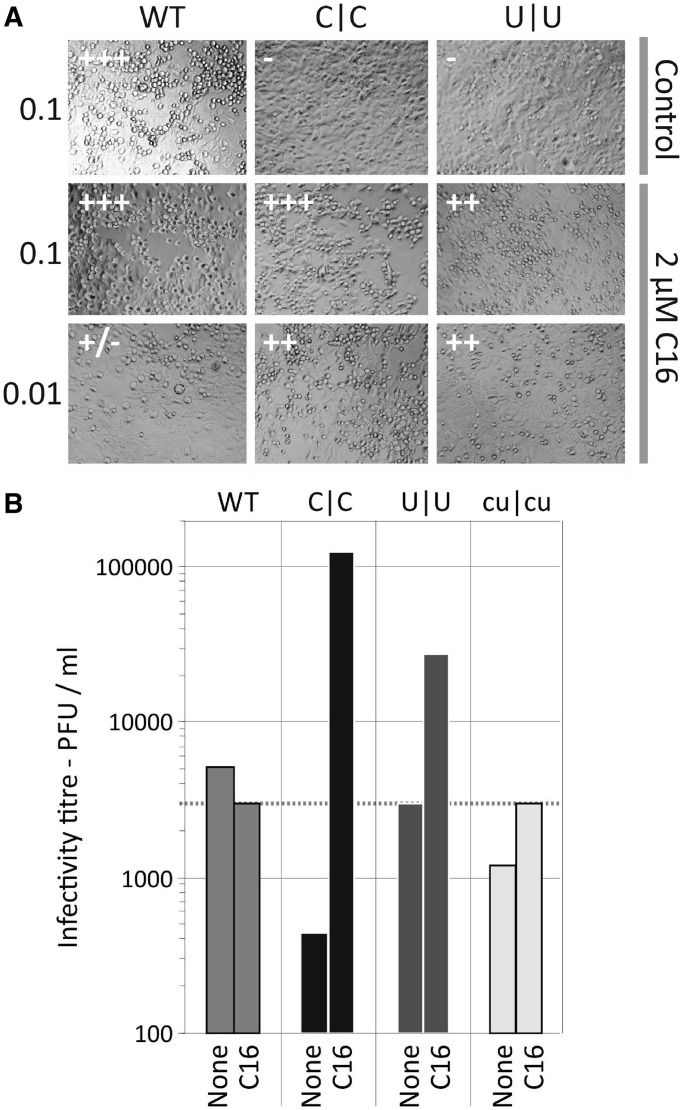
Most RNA viruses infecting mammals and other vertebrates show profound suppression of CpG and UpA dinucleotide frequencies. To investigate this functionally, mutants of the picornavirus, echovirus 7 (E7), were constructed with altered CpG and UpA compositions in two 1.1–1.3 Kbase regions. Those with increased frequencies of CpG and UpA showed impaired replication kinetics and higher RNA/infectivity ratios compared with wild-type virus. Remarkably, mutants with CpGs and UpAs removed showed enhanced replication, larger plaques and rapidly outcompeted wild-type virus on co-infections. Luciferase-expressing E7 sub-genomic replicons with CpGs and UpAs removed from the reporter gene showed 100-fold greater luminescence. E7 and mutants were equivalently sensitive to exogenously added interferon-β, showed no evidence for differential recognition by ADAR1 or pattern recognition receptors RIG-I, MDA5 or PKR. However, kinase inhibitors roscovitine and C16 partially or entirely reversed the attenuated phenotype of high CpG and UpA mutants, potentially through inhibition of currently uncharacterized pattern recognition receptors that respond to RNA composition. Generating viruses with enhanced replication kinetics has applications in vaccine production and reporter gene construction. More fundamentally, the findings introduce a new evolutionary paradigm where dinucleotide composition of viral genomes is subjected to selection pressures independently of coding capacity and profoundly influences host–pathogen interactions.
Overview
The claims and statistics of this paper haven’t been checked yet.
Run the check — free, no account needed. It reads the open-access text and checks the sources it cites.
Integrity signals
Registry
Cites
Statistics
Figures
Verification
Claims the paper makes
The claims and statistics of this paper haven’t been checked yet.
Run the check — free, no account needed. It reads the open-access text and checks the sources it cites.
Claims other papers make about this one
Each is checked against this paper’s own text: does it say what the citing paper says it does?
The source backs part of the claim, not all of it — or backs it for a different population, condition or comparison.
In the citing paper
“Previous studies have shown that SAVE not only increases the number of codon pairs that are underrepresented in coding sequences of the target host”
From Codon Pair Bias Is a Direct Consequence of Dinucleotide Bias (2016) · cites this paper as Atkinson et al., 2014
Experimental — accuracy not yet measuredThe source backs part of the claim, not all of it — or backs it for a different population, condition or comparison.
In the citing paper
“when done using vertebrate CPSs, inadvertently increases the number of CpG and, to lesser degree, also TpA dinucleotides in recoded sequences”
From Codon Pair Bias Is a Direct Consequence of Dinucleotide Bias (2016) · cites this paper as Atkinson et al., 2014
Experimental — accuracy not yet measuredThe source backs part of the claim, not all of it — or backs it for a different population, condition or comparison.
In the citing paper
“codon pairs that contain CpG and TpA dinucleotides at codon position P3-A1 are among the most underrepresented codon pairs”
From Codon Pair Bias Is a Direct Consequence of Dinucleotide Bias (2016) · cites this paper as Atkinson et al., 2014
Experimental — accuracy not yet measuredThe cited source says what the claim attributes to it.
In the citing paper
“Several studies have shown that increasing the frequency of CpG dinucleotides in the RNA virus genome reduces the virus fitness (Atkinson et al., 2014;Burns et al., 2009;Tulloch et al., 2014).”
From Mechanism of Virus Attenuation by Codon Pair Deoptimization (2020) · cites this paper as Atkinson et al., 2014
Self-check
Percentages, sums and reported differences re-computed from the paper’s own numbers.
The self-check needs the paper’s full text.
Citations
Cites
Differential roles of MDA5 and RIG-I helicases in the recognition of RNA viruses
Kato, H., Takeuchi, O., Sato, S., Yoneyama, M., Yamamoto, M., Matsui, K., Uematsu, S., Jung, A., Kawai, T., Ishii, K. J., et al. (2006) · Nature · doi:10.1038/nature04734 · Cited by 3,888
5'-Triphosphate RNA Is the Ligand for RIG-I
Hornung, V., Ellegast, J., Kim, S., Brzózka, K., Jung, A., Kato, H., Poeck, H., Akira, S., Conzelmann, K.-K., Schlee, M., et al. (2006) · Science · doi:10.1126/science.1132505 · Cited by 2,474
The ‘effective number of codons’ used in a gene
Wright, F. (1990) · Gene · doi:10.1016/0378-1119(90)90491-9 · Cited by 2,318
Meijer, L., Borgne, A., Mulner, O., Chong, J. P. J., Blow, J. J., Inagaki, N., Inagaki, M., Delcros, J., & Moulinoux, J. (1997) · European Journal of Biochemistry · doi:10.1111/j.1432-1033.1997.t01-2-00527.x · Cited by 1,352
A novel influenza A virus mitochondrial protein that induces cell death
Chen, W., Calvo, P. A., Malide, D. A., Gibbs, J. S., Schubert, U., Bačík, I., Basta, S., O’Neill, R. E., Schickli, J. H., Palese, P., et al. (2001) · Nature Medicine · doi:10.1038/nm1201-1306 · Cited by 1,037
Virus attenuation by genome-scale changes in codon pair bias
Coleman, J. R., Papamichail, D., Skiena, S., Futcher, B., Wimmer, E., & Mueller, S. (2008) · Science · doi:10.1126/science.1155761 · Cited by 715
Etchison, D., Milburn, S. C., Edery, I., Sonenberg, N., & Hershey, J. W. B. (1982) · Journal of Biological Chemistry · doi:10.1016/s0021-9258(18)33352-0 · Cited by 583
The distribution of fitness effects caused by single-nucleotide substitutions in an RNA virus.
Sanjuán, R., Moya, A., & Elena, S. F. (2004) · Proceedings of the National Academy of Sciences · doi:10.1073/pnas.0400146101 · Cited by 582
CAIcal: A combined set of tools to assess codon usage adaptation
Puigbò, P., Bravo, I., & García-Vallvé, S. (2008) · Biology Direct · doi:10.1186/1745-6150-3-38 · Cited by 569
Activation of MDA5 Requires Higher-Order RNA Structures Generated during Virus Infection
Pichlmair, A., Schulz, O., Tan, C.-P., Rehwinkel, J., Kato, H., Takeuchi, O., Akira, S., Way, M., Schiavo, G., & Sousa, C. R. E. (2009) · Journal of Virology · doi:10.1128/jvi.00770-09 · Cited by 469
Cited by
Sorted by citations
Discriminating self from non-self in nucleic acid sensing
Schlee, M., & Hartmann, G. (2016) · Nature reviews. Immunology · doi:10.1038/nri.2016.78 · Cited by 598
Origins and challenges of viral dark matter
Krishnamurthy, S. R., & Wang, D. (2017) · Virus Research · doi:10.1016/j.virusres.2017.02.002 · Cited by 259
Synonymous but Not Silent: The Codon Usage Code for Gene Expression and Protein Folding
Liu, Y., Yang, Q., & Zhao, F. (2021) · Annual Review of Biochemistry · doi:10.1146/annurev-biochem-071320-112701 · Cited by 254
Theoretical basis for stabilizing messenger RNA through secondary structure design
Wayment-Steele, H. K., Kim, D. S., Choe, C. A., Nicol, J. J., Wellington-Oguri, R., Watkins, A. M., Parra Sperberg, R. A., Huang, P.-S., Participants, E., & Das, R. (2021) · Nucleic Acids Research · doi:10.1093/nar/gkab764 · Cited by 197
Tulloch, F., Atkinson, N. J., Evans, D. J., Ryan, M. D., & Simmonds, P. (2014) · eLife · doi:10.7554/elife.04531 · Cited by 178
Self-citationCodon Pair Bias Is a Direct Consequence of Dinucleotide Bias
Kunec, D., & Osterrieder, N. (2016) · Cell Reports · doi:10.1016/j.celrep.2015.12.011 · Cited by 159
“…using vertebrate CPSs, inadvertently increases the number of CpG and, to lesser degree, also TpA dinucleotides in recoded sequences because codon pairs that contain CpG and TpA dinucleotides at codon position P3-A1 are among the most underrepresented codon pairs (Table S3; Atkinson et al., 2014).”
InfluentialExtreme Genomic CpG Deficiency in SARS-CoV-2 and Evasion of Host Antiviral Defense
Xia, X. (2020) · Molecular Biology and Evolution · doi:10.1093/molbev/msaa094 · Cited by 160
Nchioua, R., Kmiec, D., Müller, J. A., Conzelmann, C., Groß, R., Swanson, C. M., Neil, S. J. D., Stenger, S., Sauter, D., Münch, J., et al. (2020) · mBio · doi:10.1128/mbio.01930-20 · Cited by 146
The Evolutionary Pathway to Virulence of an RNA Virus
Stern, A., Yeh, M. T., Zinger, T., Smith, M., Wright, C., Ling, G., Nielsen, R., Macadam, A., & Andino, R. (2017) · Cell · doi:10.1016/j.cell.2017.03.013 · Cited by 127
Ficarelli, M., Wilson, H., Pedro Galão, R., Mazzon, M., Antzin-Anduetza, I., Marsh, M., Neil, S. J., & Swanson, C. M. (2019) · eLife · doi:10.7554/elife.46767 · Cited by 135
Dinucleotide Composition in Animal RNA Viruses Is Shaped More by Virus Family than by Host Species
Giallonardo, F. D., Schlub, T. E., Shī, M., & Holmes, E. C. (2017) · Journal of Virology · doi:10.1128/jvi.02381-16 · Cited by 119
Gaunt, E., Wise, H. M., Zhang, H., Lee, L. N., Atkinson, N. J., Nicol, M. Q., Highton, A. J., Klenerman, P., Beard, P. M., Dutia, B. M., et al. (2016) · eLife · doi:10.7554/elife.12735 · Cited by 107
Self-citationLarge-scale recoding of an arbovirus genome to rebalance its insect versus mammalian preference
Shen, S. H., Stauft, C. B., Gorbatsevych, O., Song, Y., Ward, C. B., Yurovsky, A., Mueller, S., Futcher, B., & Wimmer, E. (2015) · Proceedings of the National Academy of Sciences · doi:10.1073/pnas.1502864112 · Cited by 99
Development of a new oral poliovirus vaccine for the eradication end game using codon deoptimization
Konopka‐Anstadt, J. L., Campagnoli, R. P., Vincent, A., Shaw, J., Wei, L., Wynn, N. T., Smithee, S., Bujáki, E., Yeh, M. T., Laassri, M., et al. (2020) · npj Vaccines · doi:10.1038/s41541-020-0176-7 · Cited by 98
Functional RNA during Zika virus infection
Göertz, G. P., Abbo, S. R., Fros, J. J., & Pijlman, G. P. (2017) · Virus Research · doi:10.1016/j.virusres.2017.08.015 · Cited by 95
Odon, V., Fros, J. J., Goonawardane, N., Dietrich, I., Ibrahim, A., Alshaikhahmed, K., Nguyen, D. V., & Peter Simmonds, K. (2019) · Nucleic Acids Research · doi:10.1093/nar/gkz581 · Cited by 95
Attenuation of RNA viruses by redirecting their evolution in sequence space
Moratorio, G., Henningsson, R., Barbezange, C., Carrau, L., Bordería, A. V., Blanc, H., Beaucourt, S. M., Poirier, E. Z., Vallet, T., Boussier, J., et al. (2017) · Nature Microbiology · doi:10.1038/nmicrobiol.2017.88 · Cited by 93
A Review of Flaviviruses that Have No Known Arthropod Vector
Blitvich, B. J., & Firth, A. E. (2017) · Viruses · doi:10.3390/v9060154 · Cited by 86
Mechanism of Virus Attenuation by Codon Pair Deoptimization
Groenke, N., Trimpert, J., Merz, S., Conradie, A. M., Wyler, E., Zhang, H., Hazapis, O.-G., Rausch, S., Landthaler, M., Osterrieder, N., et al. (2020) · Cell Reports · doi:10.1016/j.celrep.2020.107586 · Cited by 85
“Several studies have shown that increasing the frequency of CpG dinucleotides in the RNA virus genome reduces the virus fitness (Atkinson et al., 2014; Burns et al., 2009; Tulloch et al., 2014).”
BackgroundFicarelli, M., Antzin-Anduetza, I., Hugh-White, R., Firth, A. E., Sertkaya, H., Wilson, H., Neil, S. J. D., Schulz, R., & Swanson, C. M. (2019) · Journal of Virology · doi:10.1128/jvi.01337-19 · Cited by 84
Synonymous Virus Genome Recoding as a Tool to Impact Viral Fitness
Martı́nez, M. Á., Jordan-Paiz, A., Franco, S., & Nevot, M. (2015) · Trends in Microbiology · doi:10.1016/j.tim.2015.11.002 · Cited by 83
Lowry, K., Woodman, A., Cook, J., & Evans, D. J. (2014) · PLoS Pathogens · doi:10.1371/journal.ppat.1004191 · Cited by 80
Self-citationEvolutionary reversion of live viral vaccines: Can genetic engineering subdue it?
Bull, J. J. (2015) · Virus Evolution · doi:10.1093/ve/vev005 · Cited by 86
Biased Mutation and Selection in RNA Viruses
Kustin, T., & Stern, A. (2020) · Molecular Biology and Evolution · doi:10.1093/molbev/msaa247 · Cited by 79
Distinguishing the immunostimulatory properties of noncoding RNAs expressed in cancer cells
Tanne, A., Muniz, L. R., Puzio-Kuter, A., Leonova, K. I., Gudkov, A. V., Ting, D. T., Monasson, R., Cocco, S., Levine, A. J., Bhardwaj, N., et al. (2015) · Proceedings of the National Academy of Sciences · doi:10.1073/pnas.1517584112 · Cited by 74
Predicting host taxonomic information from viral genomes: A comparison of feature representations
Young, F., Rogers, S., & Robertson, D. L. (2020) · PLoS Computational Biology · doi:10.1371/journal.pcbi.1007894 · Cited by 60
Fros, J. J., Dietrich, I., Alshaikhahmed, K., Passchier, T. C., Evans, D. J., & Peter Simmonds, K. (2017) · eLife · doi:10.7554/elife.29112 · Cited by 58
Self-citationKmieć, D., Nchioua, R., Sherrill-Mix, S. A., Stürzel, C. M., Heusinger, E., Braun, E., Gondim, M. V. P., Hotter, D., Sparrer, K. M. J., Hahn, B. H., et al. (2020) · mBio · doi:10.1128/mbio.02903-19 · Cited by 58
Wang, B., Chen, Y., Tekes, G., Mueller, S., Paul, A. V., Whelan, S. P. J., & Wimmer, E. (2015) · mBio · doi:10.1128/mbio.00237-15 · Cited by 59
Host–virus interaction and viral evasion
Strumillo, S. T., Kartavykh, D., de Carvalho, F. F., Cruz, N., Teodoro, A. C. D. S., Diaz, R. S., & Curcio, M. F. (2021) · Cell Biology International · doi:10.1002/cbin.11565 · Cited by 57
Li, J., Zhang, S., Li, B., Hu, Y., Kang, X., Wu, X., Huang, M.-T., Li, Y., Zhao, Z., Qin, C., et al. (2019) · Molecular Biology and Evolution · doi:10.1093/molbev/msz276 · Cited by 53
Wang, G., & Zheng, C. (2020) · FEMS Microbiology Reviews · doi:10.1093/femsre/fuaa059 · Cited by 51
Pathogenicity and virulence of hepatitis A virus
Pintó, R. M., Rodríguez, F., Costafreda, M. I., Chavarria-Miró, G., Guix, S., Ribes, E., & Bosch, A. (2021) · Virulence · doi:10.1080/21505594.2021.1910442 · Cited by 50
Dinucleotide evolutionary dynamics in influenza A virus
Gu, H., Fan, R. L. Y., Wang, D., & Poon, L. L. M. (2019) · Virus Evolution · doi:10.1093/ve/vez038 · Cited by 51
An update review of globally reported SARS-CoV-2 vaccines in preclinical and clinical stages
Motamedi, H., Ari, M. M., Dashtbin, S., Fathollahi, M., Hossainpour, H., Alvandi, A., Moradi, J., & Abiri, R. (2021) · International Immunopharmacology · doi:10.1016/j.intimp.2021.107763 · Cited by 51
Zhou, J.-H., Li, X., Lan, X., Han, S., Wang, Y., Hu, Y., & Pan, Q. (2018) · Infection Genetics and Evolution · doi:10.1016/j.meegid.2018.11.024 · Cited by 48
Lin, Y.-T., Chiweshe, S., McCormick, D., Raper, A., Wickenhagen, A., DeFilippis, V. R., Gaunt, E. R., Peter Simmonds, K., Wilson, S. J., & Grey, F. E. (2020) · PLoS Pathogens · doi:10.1371/journal.ppat.1008844 · Cited by 50
Transcription, mRNA Export, and Immune Evasion Shape the Codon Usage of Viruses
Mordstein, C., Cano, L., Castillo-Morales, A., Young, B., Ho, A. T., Rice, A. M., Liss, M. A., Hurst, L. D., & Kudla, G. (2021) · Genome Biology and Evolution · doi:10.1093/gbe/evab106 · Cited by 48
Respiratory eukaryotic virome expansion and bacteriophage deficiency characterize childhood asthma
Megremis, S., Constantinides, B., Xepapadaki, P. V., Yap, C. F., Sotiropoulos, A. G., Bachert, C., Finotto, S., Jartti, T. T., Tapinos, A., Vuorinen, T., et al. (2023) · Scientific Reports · doi:10.1038/s41598-023-34730-7 · Cited by 56
Sequence-Specific Sensing of Nucleic Acids
Vabret, N., Bhardwaj, N., & Greenbaum, B. D. (2017) · Trends in Immunology · doi:10.1016/j.it.2016.10.006 · Cited by 45
Segundo, F. D.-S., Medina, G. N., Ramírez-Medina, E., Velázquez-Salinas, L., Koster, M. J., Grubman, M. J., & Santos, T. D. L. (2015) · Journal of Virology · doi:10.1128/jvi.02167-15 · Cited by 48
Causes and Consequences of Purifying Selection on SARS-CoV-2
Castillo-Morales, A., Rice, A. M., Ho, A. T., Mordstein, C., Mühlhausen, S., Watson, S., Cano, L., Young, B., Kudla, G., & Hurst, L. D. (2021) · Genome Biology and Evolution · doi:10.1093/gbe/evab196 · Cited by 43
Kmieć, D., Lista, M. J., Ficarelli, M., Swanson, C. M., & Neil, S. J. D. (2021) · PLoS Pathogens · doi:10.1371/journal.ppat.1009726 · Cited by 42
Increasing the CpG dinucleotide abundance in the HIV-1 genomic RNA inhibits viral replication
Antzin-Anduetza, I., Mahiet, C., Granger, L. A., Odendall, C., & Swanson, C. M. (2017) · Retrovirology · doi:10.1186/s12977-017-0374-1 · Cited by 40
Compensating the Fitness Costs of Synonymous Mutations
Knöppel, A., Näsvall, J., & Andersson, D. I. (2016) · Molecular Biology and Evolution · doi:10.1093/molbev/msw028 · Cited by 41
Intra-genome variability in the dinucleotide composition of SARS-CoV-2
Digard, P., Lee, H. M., Sharp, C., Grey, F. E., & Gaunt, E. R. (2020) · Virus Evolution · doi:10.1093/ve/veaa057 · Cited by 42
Gao, L., Wang, L., Huang, C., Yang, L., Guo, X.-K., Yu, Z., Liu, Y., Yang, P., & Feng, W.-H. (2015) · Virology · doi:10.1016/j.virol.2015.07.012 · Cited by 40
Trus, I., Udenze, D., Berube, N., Wheler, C. L., Martel, M.-J., Gerdts, V., & Karniychuk, U. U. (2020) · Frontiers in Immunology · doi:10.3389/fimmu.2019.03077 · Cited by 43
Oberemok, V. V., Laikova, K. V., Yurchenko, K. A., Marochkin, N. A., Фомочкина, И. И., & Kubyshkin, A. V. (2020) · Inflammation Research · doi:10.1007/s00011-020-01377-3 · Cited by 39
Fros, J. J., Visser, I., Tang, B., Yan, K., Nakayama, E., Visser, T. M., Koenraadt, C. J. M., van Oers, M. M., Pijlman, G. P., Suhrbier, A., et al. (2021) · PLoS Biology · doi:10.1371/journal.pbio.3001201 · Cited by 40
Hepatitis A Virus Codon Usage: Implications for Translation Kinetics and Capsid FoldingPreprint
Pintó, R. M., Rodríguez, F., D’Andrea, L., de Castellarnau, M., Guix, S., & Bosch, A. (2018) · Cold Spring Harbor Perspectives in Medicine · doi:10.1101/cshperspect.a031781 · Cited by 43
Tricks and threats of RNA viruses – towards understanding the fate of viral RNA
Markiewicz, Ł., Drążkowska, K., & Sikorski, P. J. (2021) · RNA Biology · doi:10.1080/15476286.2021.1875680 · Cited by 39
Emergency Services of Viral RNAs: Repair and Remodeling
Agol, V. I., & Gmyl, A. P. (2018) · Microbiology and Molecular Biology Reviews · doi:10.1128/mmbr.00067-17 · Cited by 35
Tsai, Y.-H., Huang, S.-W., Hsieh, W.-S., Cheng, C.-K., Chang, C., Wang, Y., & Wang, J. (2019) · Journal of Virology · doi:10.1128/jvi.02308-18 · Cited by 36
Attenuation of Human Respiratory Viruses by Synonymous Genome Recoding
Nouën, C. L., Collins, P. L., & Buchholz, U. J. (2019) · Frontiers in Immunology · doi:10.3389/fimmu.2019.01250 · Cited by 39
Trus, I., Berube, N., Jiang, P., Rak, J. W., Gerdts, V., & Karniychuk, U. U. (2020) · Viruses · doi:10.3390/v12050579 · Cited by 38
Charles, J., Firth, A. E., Loroño-Pino, M. A., Garcia-Rejon, J. E., Farfán-Ale, J. A., Lipkin, W. I., Blitvich, B. J., & Briese, T. (2016) · Journal of General Virology · doi:10.1099/jgv.0.000424 · Cited by 35
Witteveldt, J., Martin-Gans, M., & Peter Simmonds, K. (2016) · Antimicrobial Agents and Chemotherapy · doi:10.1128/aac.02932-15 · Cited by 35
Self-citationEffects of Arbovirus Multi-Host Life Cycles on Dinucleotide and Codon Usage Patterns
Sexton, N. R., & Ebel, G. D. (2019) · Viruses · doi:10.3390/v11070643 · Cited by 34
Cellular Factors Targeting HIV-1 Transcription and Viral RNA Transcripts
Nchioua, R., Bosso, M., Kmieć, D., & Kirchhoff, F. (2020) · Viruses · doi:10.3390/v12050495 · Cited by 37
Compositional biases in RNA viruses: Causes, consequences and applications
Gaunt, E. R., & Digard, P. (2021) · Wiley Interdisciplinary Reviews - RNA · doi:10.1002/wrna.1679 · Cited by 35
Theys, K., Feder, A. F., Gelbart, M., Hartl, M., Stern, A., & Pennings, P. S. (2018) · PLoS Genetics · doi:10.1371/journal.pgen.1007420 · Cited by 33
Shaw, A. E., Rihn, S. J., Mollentze, N., Wickenhagen, A., Stewart, D. G., Orton, R. J., Srikeerthana, K., Bakshi, S., Rodríguez, M. C., Turnbull, M. L., et al. (2021) · PLoS Biology · doi:10.1371/journal.pbio.3001352 · Cited by 30
Coronavirus genomes carry the signatures of their habitats
Wei, Y., Silke, J. R., Aris, P., & Xia, X. (2020) · PLoS ONE · doi:10.1371/journal.pone.0244025 · Cited by 31
Song, Y., Gorbatsevych, O., Liu, Y., Mugavero, J., Shen, S. H., Ward, C. B., Asare, E., Jiang, P., Paul, A. V., Mueller, S., et al. (2017) · Proceedings of the National Academy of Sciences · doi:10.1073/pnas.1714385114 · Cited by 30
Hussain, S., Rasool, S. T., & Shinu, P. (2021) · Journal of Molecular Evolution · doi:10.1007/s00239-021-10008-2 · Cited by 28
Viral evolution: beyond drift and shift
Greenbaum, B. D., & Ghedin, E. (2015) · Current Opinion in Microbiology · doi:10.1016/j.mib.2015.06.015 · Cited by 28
Protein–protein interaction and non-interaction predictions using gene sequence natural vector
Zhao, N., Zhuo, M., Tian, K., & Gong, X. (2022) · Communications Biology · doi:10.1038/s42003-022-03617-0 · Cited by 29
Amyloidosis in the white Pekin duck. I. Relation to social environmental stress.
Cowan, D. F., & Johnson, W. C. (1970) · PubMed · Cited by 28
Colmant, A. M. G., Hobson‐Peters, J., Slijkerman, T. A. P., Harrison, J. J., Pijlman, G. P., van Oers, M. M., Peter Simmonds, K., Hall, R. A., & Fros, J. J. (2021) · Viruses · doi:10.3390/v13040573 · Cited by 24
Virulence and Immune Evasion Strategies of FMDV: Implications for Vaccine Design
Medina, G. N., & Segundo, F. D.-S. (2024) · Vaccines · doi:10.3390/vaccines12091071 · Cited by 23
The CpG dinucleotide content of the HIV-1 envelope gene may predict disease progression
Wasson, M. K., Borkakoti, J., Kumar, A., Biswas, B., & Vivekanandan, P. (2017) · Scientific Reports · doi:10.1038/s41598-017-08716-1 · Cited by 21
Goonawardane, N., Nguyen, D. V., & Peter Simmonds, K. (2021) · mSphere · doi:10.1128/msphere.01138-20 · Cited by 23
Wang, Q., Lyu, X., Chéng, J., Fù, Y., Lin, Y., Abdoulaye, A. H., Jiāng, D., & Xiè, J. (2022) · International Journal of Molecular Sciences · doi:10.3390/ijms23137441 · Cited by 22
Al-Nazawi, M., Al-Taher, A. Y., & Kandeel, M. K. (2017) · Biological and Pharmaceutical Bulletin · doi:10.1248/bpb.b17-00241 · Cited by 21
Tuplin, A. (2015) · Journal of General Virology · doi:10.1099/vir.0.000066 · Cited by 20
Dengue virus preferentially uses human and mosquito non-optimal codons
Castellano, L. A., McNamara, R. J., Pallarés, H. M., Gamarnik, A. V., Alvarez, D. E., & Bazzini, A. (2024) · Molecular Systems Biology · doi:10.1038/s44320-024-00052-7 · Cited by 20
Velázquez-Salinas, L., Risatti, G. R., Holinka, L. G., O’Donnell, V. K., Carlson, J., Alfano, M., Rodrı́guez, L. L., Carrillo, C., Gladue, D. P., & Borca, M. V. (2016) · Virology · doi:10.1016/j.virol.2016.04.007 · Cited by 21
Host influence in the genomic composition of flaviviruses: A multivariate approach
Simón, D., Fajardo, Á., Sóñora, M., Delfraro, A., & Musto, H. (2017) · Biochemical and Biophysical Research Communications · doi:10.1016/j.bbrc.2017.06.088 · Cited by 20
Replicons of a Rodent Hepatitis C Model Virus Permit Selection of Highly Permissive Cells
Wolfisberg, R., Holmbeck, K., Nielsen, L., Kapoor, A., Rice, C. M., Bukh, J., & Scheel, T. K. H. (2019) · Journal of Virology · doi:10.1128/jvi.00733-19 · Cited by 20
Ibrahim, A., Fros, J. J., Bertran, A. G. M., Sechan, F., Odon, V., Torrance, L., Kormelink, R., & Peter Simmonds, K. (2019) · Scientific Reports · doi:10.1038/s41598-019-54853-0 · Cited by 23
Codon Usage and Adenovirus Fitness: Implications for Vaccine Development
Gimenez–Roig, J., Núñez-Manchón, E., Alemany, R., Villanueva, E., & Fillat, C. (2021) · Frontiers in Microbiology · doi:10.3389/fmicb.2021.633946 · Cited by 21
Reduced Protein Expression in a Virus Attenuated by Codon Deoptimization
Jack, B. R., Boutz, D. R., Paff, M. L., Smith, B. L., Bull, J. J., & Wilke, C. O. (2017) · G3 Genes Genomes Genetics · doi:10.1534/g3.117.041020 · Cited by 21
Lytras, S., & Hughes, J. (2020) · Viruses · doi:10.3390/v12040462 · Cited by 20
Antiviral Activity of Zinc Finger Antiviral Protein (ZAP) in Different Virus Families
de Andrade, K. Q., & Cirne-Santos, C. C. (2023) · Pathogens · doi:10.3390/pathogens12121461 · Cited by 21
Synonymous genome recoding: a tool to explore microbial biology and new therapeutic strategies
Martı́nez, M. Á., Jordan-Paiz, A., Franco, S., & Nevot, M. (2019) · Nucleic Acids Research · doi:10.1093/nar/gkz831 · Cited by 18
Plant Virus Genome Is Shaped by Specific Dinucleotide Restrictions That Influence Viral Infection
de Prádena, A. G., Jimenez, A. S., León, D. S., Peter Simmonds, K., Garcı́a, J. A., & Valli, A. A. (2020) · mBio · doi:10.1128/mbio.02818-19 · Cited by 19
Rahman, M. M., Kader, S. B., & Rizvi, S. M. S. (2021) · Heliyon · doi:10.1016/j.heliyon.2021.e07866 · Cited by 17
ΦX174 Attenuation by Whole-Genome Codon Deoptimization
Leuven, J. T. V., Ederer, M. M., Burleigh, K., Scott, L., Hughes, R. A., Codrea, V., Ellington, A. D., Wichman, H. A., & Miller, C. R. (2020) · Genome Biology and Evolution · doi:10.1093/gbe/evaa214 · Cited by 15
Franzo, G., Tucciarone, C. M., Legnardi, M., & Cecchinato, M. (2021) · BMC Genomics · doi:10.1186/s12864-021-07559-5 · Cited by 17
Klitting, R., Riziki, T., Moureau, G., Piorkowski, G., Gould, E. A., & de Lamballerie, X. N. (2018) · Virus Evolution · doi:10.1093/ve/vey021 · Cited by 16
Altering Compositional Properties of Viral Genomes to Design Live-Attenuated Vaccines
Pereira-Gómez, M., Carrau, L., Fajardo, Á., Moreno, P., & Moratorio, G. (2021) · Frontiers in Microbiology · doi:10.3389/fmicb.2021.676582 · Cited by 17
Attenuation and protective efficacy of Rift Valley fever phlebovirus rMP12-GM50 strain
Ly, H. J., Nishiyama, S., Lokugamage, N., Smith, J. K., Zhang, L., Perez, D., Juelich, T. L., Freiberg, A. N., & Ikegami, T. (2017) · Vaccine · doi:10.1016/j.vaccine.2017.10.036 · Cited by 16
Kumar, N., Kaushik, R., Tennakoon, C., Uversky, V. N., Longhi, S., Zhang, K. Y. J., & Bhatia, S. (2021) · Briefings in Bioinformatics · doi:10.1093/bib/bbab145 · Cited by 16
Nouën, C. L., Luongo, C., Yang, L., Mueller, S., Wimmer, E., DiNapoli, J. M., Collins, P. L., & Buchholz, U. J. (2019) · Journal of Virology · doi:10.1128/jvi.01296-19 · Cited by 14
Base composition, adaptation, and evolution of goose astroviruses: codon-based investigation
Guo, F., Yang, J., El‐Aty, A. M. A., Wang, R., & Ju, X. (2023) · Poultry Science · doi:10.1016/j.psj.2023.103029 · Cited by 14
Analysis of Codon Usage and Nucleotide Bias in Middle East Respiratory Syndrome Coronavirus Genes
Hussain, S., Shinu, P., Islam, M. M., Chohan, M. S., & Rasool, S. T. (2020) · Evolutionary Bioinformatics · doi:10.1177/1176934320918861 · Cited by 14
Stauft, C. B., Shen, S. H., Song, Y., Gorbatsevych, O., Asare, E., Futcher, B., Mueller, S., Payne, A. F., Brecher, M. B., Kramer, L. D., et al. (2018) · PLoS ONE · doi:10.1371/journal.pone.0198303 · Cited by 13
Lee, M. H. P., Tan, C. W., Tee, H. K., Ong, K. C., Sam, I., & Chan, Y. F. (2021) · Vaccine · doi:10.1016/j.vaccine.2021.02.024 · Cited by 13
Pintó, R. M., Burns, C. C., & Moratorio, G. (2021) · Frontiers in Microbiology · doi:10.3389/fmicb.2021.791750 · Cited by 13
Metadata
- Authors
- Atkinson, N. J., Witteveldt, J., Evans, D. J., & Simmonds, P.
- Affiliations
- Roslin Institute (GB)
- 1 Infection and Immunity Division, Roslin Institute, University of Edinburgh, Easter Bush, Edinburgh EH25 9RG, UK and 2School of Life Sciences, University of Warwick, Coventry CV4 7AL, UK
- Venue
- Nucleic Acids Research
- Publisher
- Oxford University Press (OUP)
- Published
- 2014-01-25
- Volume
- 42
- Issue
- 7
- Pages
- 4527-4545
- ISSN
- 0305-1048 (ISSN-L)
- 1362-4962
- PMC
- PMC3985648
- OpenAlex
- W2057088297
- Cited by
- 192
- References
- 57
- Citations by year
- 2026: 12 · 2025: 15 · 2024: 9 · 2023: 8 · 2022: 11 · 2021: 36 · 2020: 26 · 2019: 17 · 2018: 11 · 2017: 20 · 2016: 10 · 2015: 13 · 2014: 3
- FWCI
- 7.01
- Type
- journal article
- Language
- en
- Open access
- gold
- doi.org
- Locations
- Nucleic Acids Research (publishedVersion, cc-by)
- Europe PMC (PubMed Central) (publishedVersion, cc-by)
- PubMed Central (publishedVersion, cc-by)
- PubMed (publishedVersion)
- Warwick Research Archive Portal (University of Warwick) (acceptedVersion)
- Edinburgh Research Explorer (University of Edinburgh) (submittedVersion, cc-by)
- St Andrews Research Repository (St Andrews Research Repository) (submittedVersion, cc-by)
- Funders
- Wellcome Trust (095831, WT087628MA)
- University of St Andrews
- Medical Research Council
- Biotechnology and Biological Sciences Research Council (BBS/E/D/20241864)
- Topics
- Life Sciences › Immunology and Microbiology › Immunology › interferon and immune responses
- Life Sciences › Biochemistry, Genetics and Molecular Biology › Genetics › Evolution and Genetic Dynamics
- Life Sciences › Biochemistry, Genetics and Molecular Biology › Molecular Biology › RNA and protein synthesis mechanisms
- Keywords
- CpG, RNA virus replication, echovirus 7, picornavirus, viral genome evolution, RNA composition, innate immune recognition, pattern recognition receptors, interferon-beta, roscovitine, RNA replicon, vaccine production, host-pathogen interaction
- MeSH terms
- Base Composition, Cell Line, Mutation, RNA, Viral, Virus Replication, Dinucleoside Phosphates, GC Rich Sequence, Enterovirus B, Human
About these checks
Registry, retraction, Cites and statistics results are computed, not judged, with one exception: a printed reference that no index lists is read once by a model before it counts as a citation error. Claims are extracted by a model and kept only when their quote appears verbatim in the text; each cited source is then checked, with a model’s help, for whether it says what the claim relies on. Those verdicts can be wrong — read the claim’s quote and the cited source before relying on one.
Statistics and arithmetic are recomputed, not judged.
Confidence bands are shown only for fields calibrated on our annotated test set. None is calibrated yet, so no band is shown.
What counts as a claim ›How we measure confidence ›How we check this ›
Are you an author, or do you see a problem with this page? Request a review
