

The DOI matches its Crossref record; 30 of the 30 references it cites were found in a registry or an index.
xVis: a web server for the schematic visualization and interpretation of crosslink-derived spatial restraints
Open accessAbstract
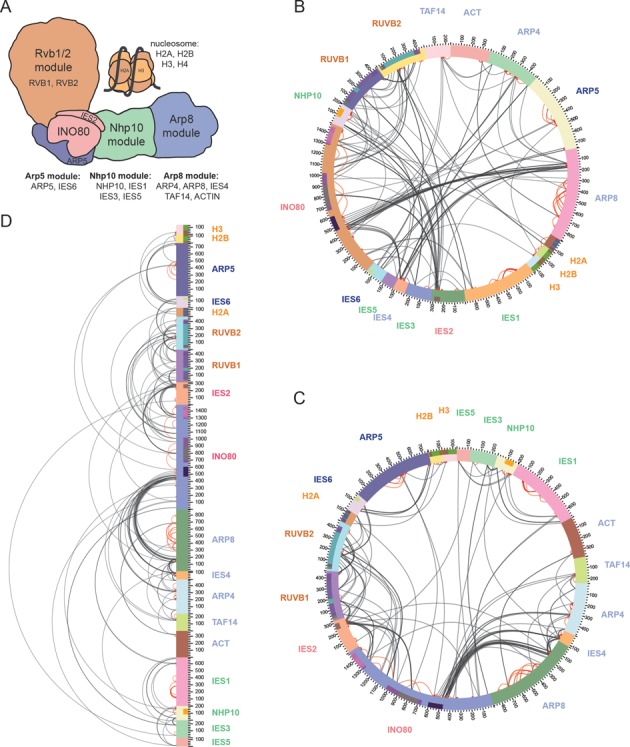
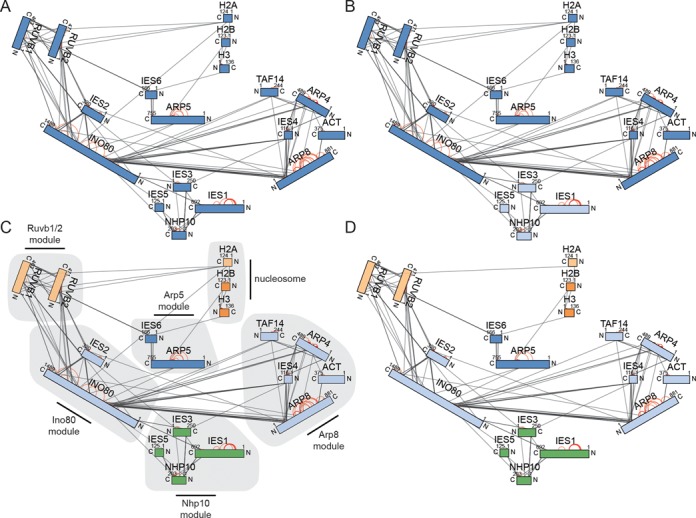
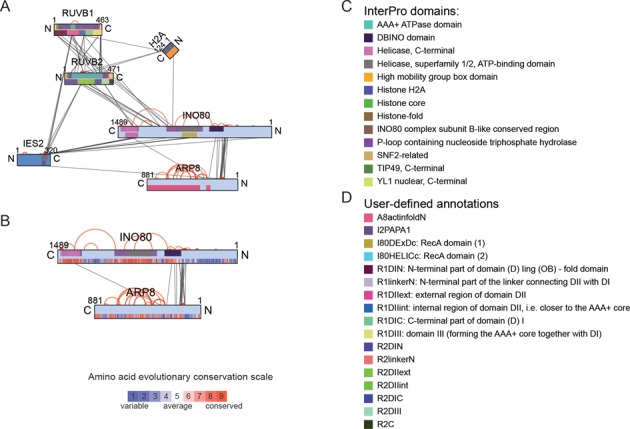
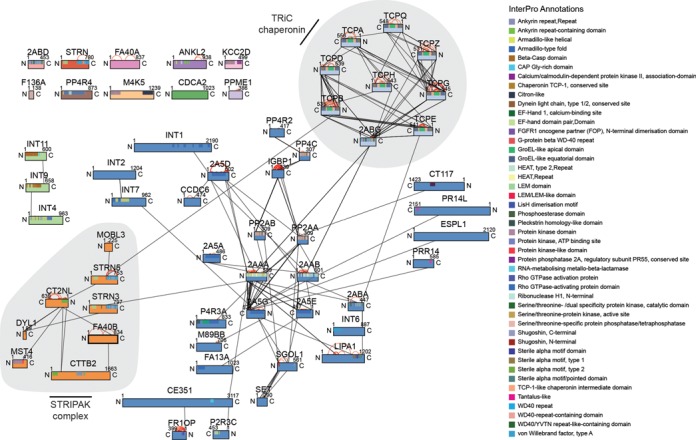
The identification of crosslinks by mass spectrometry has recently been established as an integral part of the hybrid structural analysis of protein complexes and networks. The crosslinking analysis determines distance restraints between two covalently linked amino acids which are typically summarized in a table format that precludes the immediate and comprehensive interpretation of the topological data. xVis displays crosslinks in clear schematic representations in form of a circular, bar or network diagram. The interactive graphs indicate the linkage sites and identification scores, depict the spatial proximity of structurally and functionally annotated protein regions and the evolutionary conservation of amino acids and facilitate clustering of proteins into subcomplexes according to the crosslink density. Furthermore, xVis offers two options for the qualitative assessment of the crosslink identifications by filtering crosslinks according to identification scores or false discovery rates and by displaying the corresponding fragment ion spectrum of each crosslink for the manual validation of the mass spectrometric data. Our web server provides an easy-to-use tool for the fast topological and functional interpretation of distance information on protein complex architectures and for the evaluation of crosslink fragment ion spectra. xVis is available under a Creative Commons Attribution-ShareAlike 4.0 International license at http://xvis.genzentrum.lmu.de/.
Overview
The claims and statistics of this paper haven’t been checked yet.
Run the check — free, no account needed. It reads the open-access text and checks the sources it cites.
Integrity signals
Registry
Cites
Statistics
Figures
Verification
Claims the paper makes
The claims and statistics of this paper haven’t been checked yet.
Run the check — free, no account needed. It reads the open-access text and checks the sources it cites.
Claims other papers make about this one
Each is checked against this paper’s own text: does it say what the citing paper says it does?
In the citing paper
“For example, programs have been developed to analyze and visualize cross-linking data as a network of amino acid nodes, where edges represent a detected cross-link (Combe et al., 2015; Courcelles et al., 2017; Grimm et al., 2015; Riffle et al., 2016); organizing clusters of nodes spatially according to subunit is one approach that has been applied in these networks (Figure 5C).”
From Mapping the multiscale structure of biological systems (2021) · cites this paper as Grimm et al., 2015
Self-check
Percentages, sums and reported differences re-computed from the paper’s own numbers.
The self-check needs the paper’s full text.
Citations
Cites
Bostock, M., Ogievetsky, V., & Heer, J. (2011) · IEEE Transactions on Visualization and Computer Graphics · doi:10.1109/tvcg.2011.185 · Cited by 3,165
Glaser, F., Pupko, T., Paz, I., Bell, R. E., Shental-Bechor, D., Martz, E., & Ben‐Tal, N. (2002) · Bioinformatics · doi:10.1093/bioinformatics/19.1.163 · Cited by 1,237
Sinz, A. (2006) · Mass Spectrometry Reviews · doi:10.1002/mas.20082 · Cited by 648
Determining the architectures of macromolecular assemblies
Alber, F., Dokudovskaya, S., Veenhoff, L. M., Zhang, W., Kipper, J., Devos, D. P., Suprapto, A., Karni-Schmidt, O., Williams, R., Chait, B. T., et al. (2007) · Nature · doi:10.1038/nature06404 · Cited by 525
Probing Native Protein Structures by Chemical Cross-linking, Mass Spectrometry, and Bioinformatics
Leitner, A., Walzthoeni, T., Kahraman, A., Herzog, F., Rinner, O., Beck, M., & Aebersold, R. H. (2010) · Molecular & Cellular Proteomics · doi:10.1074/mcp.r000001-mcp201 · Cited by 468
Molecular architecture of the 26S proteasome holocomplex determined by an integrative approach
Lasker, K., Förster, F. G., Bohn, S., Walzthoeni, T., Villa, E., Unverdorben, P., Beck, F., Aebersold, R. H., Šali, A., & Baumeister, W. P. (2012) · Proceedings of the National Academy of Sciences · doi:10.1073/pnas.1120559109 · Cited by 442
Using MCL to Extract Clusters from Networks
van Dongen, S., & Abreu‐Goodger, C. (2011) · Methods in molecular biology · doi:10.1007/978-1-61779-361-5_15 · Cited by 432
Kao, A., Chiu, C., Vellucci, D., Yang, Y., Patel, V. R., Guan, S., Randall, A. Z., Baldi, P., Rychnovsky, S. D., & Huang, L. (2010) · Molecular & Cellular Proteomics · doi:10.1074/mcp.m110.002212 · Cited by 405
Herzog, F., Kahraman, A., Boehringer, D., Mak, R., Bracher, A., Walzthoeni, T., Leitner, A., Beck, M., Hartl, F. U., Ban, N., et al. (2012) · Science · doi:10.1126/science.1221483 · Cited by 372
Integrated Structural Analysis of the Human Nuclear Pore Complex Scaffold
Bui, K. H., von Appen, A., DiGuilio, A. L., Ori, A., Sparks, L., Mackmull, M., Bock, T., Hagen, W. J. H., Andrés‐Pons, A., Glavy, J. S., et al. (2013) · Cell · doi:10.1016/j.cell.2013.10.055 · Cited by 351
Cited by
Sorted by citations
Structure of the human MHC-I peptide-loading complex
Blees, A., Januliene, D., Hofmann, T., Koller, N., Schmidt, C., Trowitzsch, S., Moeller, A., & Tampé, R. (2017) · Nature · doi:10.1038/nature24627 · Cited by 372
O’Reilly, F. J., & Rappsilber, J. (2018) · Nature Structural & Molecular Biology · doi:10.1038/s41594-018-0147-0 · Cited by 366
Leitner, A., Faini, M., Stengel, F., & Aebersold, R. H. (2015) · Trends in Biochemical Sciences · doi:10.1016/j.tibs.2015.10.008 · Cited by 368
Cross-Linking Mass Spectrometry: An Emerging Technology for Interactomics and Structural Biology
Yu, C., & Huang, L. (2017) · Analytical Chemistry · doi:10.1021/acs.analchem.7b04431 · Cited by 344
Piersimoni, L., Kastritis, P. L., Arlt, C., & Sinz, A. (2021) · Chemical Reviews · doi:10.1021/acs.chemrev.1c00786 · Cited by 327
Inert and seed-competent tau monomers suggest structural origins of aggregation
Mirbaha, H., Chen, D., Morazova, O. A., Ruff, K. M., Sharma, A. M., Liu, X., Goodarzi, M., Pappu, R. V., Colby, D. W., Mirzaei, H., et al. (2018) · eLife · doi:10.7554/elife.36584 · Cited by 225
Structural insights into preinitiation complex assembly on core promoters
Chen, X., Qi, Y., Wu, Z., Wang, X., Li, J., Zhao, D., Hou, H., Li, Y., Yu, Z., Liu, W., et al. (2021) · Science · doi:10.1126/science.aba8490 · Cited by 185
Structures of the human Mediator and Mediator-bound preinitiation complex
Chen, X., Yin, X., Li, J., Wu, Z., Qi, Y., Wang, X., Liu, W., & Xu, Y. (2021) · Science · doi:10.1126/science.abg0635 · Cited by 186
A unified mechanism for intron and exon definition and back-splicing
Li, X., Liu, S., Zhang, L., Issaian, A., Hill, R. C., Espinosa, S., Shi, S., Cui, Y., Kappel, K., Das, R., et al. (2019) · Nature · doi:10.1038/s41586-019-1523-6 · Cited by 177
Human Condensin I and II Drive Extensive ATP-Dependent Compaction of Nucleosome-Bound DNA
Kong, M., Cutts, E., Pan, D., Beuron, F., Kaliyappan, T., Xue, C., Morris, E. P., Musacchio, A., Vannini, A., & Greene, E. C. (2020) · Molecular Cell · doi:10.1016/j.molcel.2020.04.026 · Cited by 162
Insights from biochemical reconstitution into the architecture of human kinetochores
Weir, J. R., Faesen, A. C., Klare, K., Petrović, A., Basilico, F., Fischböck, J., Pentakota, S., Keller, J., Pesenti, M. E., Pan, D., et al. (2016) · Nature · doi:10.1038/nature19333 · Cited by 156
ATG9A and ATG2A form a heteromeric complex essential for autophagosome formation
van Vliet, A. R., Chiduza, G. N., Maslen, S., Pye, V. E., Joshi, D., Tito, S. D., Jefferies, H. B. J., Christodoulou, E., Roustan, C., Punch, E. K., et al. (2022) · Molecular Cell · doi:10.1016/j.molcel.2022.10.017 · Cited by 146
Structure of SWI/SNF chromatin remodeller RSC bound to a nucleosome
Wagner, F., Dienemann, C., Wang, H., Stützer, A., Tegunov, D., Urlaub, H., & Cramer, P. (2020) · Nature · doi:10.1038/s41586-020-2088-0 · Cited by 148
Schiffrin, B., Radford, S. E., Brockwell, D. J., & Calabrese, A. N. (2020) · Protein Science · doi:10.1002/pro.3902 · Cited by 136
Leene, J. V., Eeckhout, D., Gadeyne, A., Matthijs, C., Han, C., Winne, N. D., Persiau, G., Slijke, E. V. D., Persyn, F., Mertens, T., et al. (2022) · Nature Plants · doi:10.1038/s41477-022-01269-w · Cited by 136
Structure of the inner kinetochore CCAN complex assembled onto a centromeric nucleosome
Yan, K., Yang, J., Zhang, Z., McLaughlin, S. H., Chang, L., Fasci, D., Ehrenhofer‐Murray, A. E., Heck, A. J. R., & Barford, D. (2019) · Nature · doi:10.1038/s41586-019-1609-1 · Cited by 137
A RECK-WNT7 Receptor-Ligand Interaction Enables Isoform-Specific Regulation of Wnt Bioavailability
Vallon, M., Yuki, K., Nguyen, T. D., Chang, J., Yuan, J., Siepe, D. H., Miao, Y., Essler, M., Noda, M., García, K. C., et al. (2018) · Cell Reports · doi:10.1016/j.celrep.2018.09.045 · Cited by 124
xiView: A common platform for the downstream analysis of Crosslinking Mass Spectrometry dataPreprint
Graham, M., Combe, C., Kolbowski, L., & Rappsilber, J. (2019) · bioRxiv (Cold Spring Harbor Laboratory) · doi:10.1101/561829 · Cited by 97
Deep, A., Gu, Y., Gao, Y.-Q., Ego, K. M., Herzik, M. A., Zhou, H., & Corbett, K. D. (2022) · Molecular Cell · doi:10.1016/j.molcel.2022.09.008 · Cited by 106
xiVIEW: Visualisation of Crosslinking Mass Spectrometry Data
Combe, C., Graham, M., Kolbowski, L., Fischer, L., & Rappsilber, J. (2024) · Journal of Molecular Biology · doi:10.1016/j.jmb.2024.168656 · Cited by 103
Foster, B. M., Stolz, P., Mulholland, C. B., Montoya, A., Kramer, H., Bultmann, S., & Bartke, T. (2018) · Molecular Cell · doi:10.1016/j.molcel.2018.09.028 · Cited by 99
The COMA complex interacts with Cse4 and positions Sli15/Ipl1 at the budding yeast inner kinetochore
Fischböck, J., Singh, S., Potočnjak, M., Hagemann, G., Solis‐Mezarino, V., Woike, S., Ghodgaonkar-Steger, M., Weissmann, F., Gallego, L. D., Rojas, J., et al. (2019) · eLife · doi:10.7554/elife.42879 · Cited by 93
Schmidt, C., & Urlaub, H. (2017) · Current Opinion in Structural Biology · doi:10.1016/j.sbi.2017.10.005 · Cited by 91
CDC20 assists its catalytic incorporation in the mitotic checkpoint complex
Piano, V., Alex, A., Stege, P., Maffini, S., Stoppiello, G. A., Veld, P. J. H. I. ’., Vetter, I. R., & Musacchio, A. (2020) · Science · doi:10.1126/science.abc1152 · Cited by 88
Matzinger, M., & Mechtler, K. (2020) · Journal of Proteome Research · doi:10.1021/acs.jproteome.0c00583 · Cited by 84
Cross-linking/mass spectrometry to get a closer view on protein interaction networks
Iacobucci, C., Götze, M., & Sinz, A. (2019) · Current Opinion in Biotechnology · doi:10.1016/j.copbio.2019.12.009 · Cited by 82
Mapping the multiscale structure of biological systems
Schaffer, L. V., & Ideker, T. (2021) · Cell Systems · doi:10.1016/j.cels.2021.05.012 · Cited by 75
Orbán-Németh, Z., Beveridge, R., Hollenstein, D. M., Rampler, E., Stranzl, T., Hudecz, O., Doblmann, J., Schlögelhofer, P., & Mechtler, K. (2018) · Nature Protocols · doi:10.1038/nprot.2017.146 · Cited by 72
Riffle, M. E., Jaschob, D., Zelter, A., & Davis, T. N. (2016) · Journal of Proteome Research · doi:10.1021/acs.jproteome.6b00274 · Cited by 65
Arlt, C., Götze, M., Ihling, C. H., Hage, C., Schäfer, M., & Sinz, A. (2016) · Analytical Chemistry · doi:10.1021/acs.analchem.5b04853 · Cited by 69
Low, J. K. K., Silva, A. P. G., Tabar, M. S., Torrado, M., Webb, S. R., Parker, B. L., Sana, M., Smits, C., Schmidberger, J. W., Brillault, L., et al. (2020) · Cell Reports · doi:10.1016/j.celrep.2020.108450 · Cited by 65
CryoEM structure of Saccharomyces cerevisiae U1 snRNP offers insight into alternative splicing
Li, X., Liu, S., Jiang, J., Zhang, L., Espinosa, S., Hill, R. C., Hansen, K. C., Zhou, Z. H., & Zhao, R. (2017) · Nature Communications · doi:10.1038/s41467-017-01241-9 · Cited by 66
Structural basis of Cullin 2 RING E3 ligase regulation by the COP9 signalosome
Faull, S. V., Lau, A. M., Martens, C., Ahdash, Z., Hansen, K., Yébenes, H., Schmidt, C., Beuron, F., Cronin, N., Morris, E. P., et al. (2019) · Nature Communications · doi:10.1038/s41467-019-11772-y · Cited by 66
Rotheneder, M., Stakyte, K., van de Logt, E., Bartho, J. D., Lammens, K., Fan, Y., Alt, A., Keßler, B., Jung, C., Roos, W. P., et al. (2022) · Molecular Cell · doi:10.1016/j.molcel.2022.12.003 · Cited by 65
Structural reorganization of the chromatin remodeling enzyme Chd1 upon engagement with nucleosomes
Sundaramoorthy, R., Hughes, A. L., Singh, V., Wiechens, N., Ryan, D., Mkami, H. E., Petoukhov, M. V., Svergun, D. I., Treutlein, B., Quack, S., et al. (2017) · eLife · doi:10.7554/elife.22510 · Cited by 62
The linear ubiquitin chain assembly complex (LUBAC) generates heterotypic ubiquitin chains
Carvajal, A. R., Grishkovskaya, I., Diaz, C. G., Vogel, A., Sonn-Segev, A., Kushwah, M. S., Schodl, K., Deszcz, L., Orbán-Németh, Z., Sakamoto, S., et al. (2021) · eLife · doi:10.7554/elife.60660 · Cited by 58
A Cross-linking Mass Spectrometry Approach Defines Protein Interactions in Yeast Mitochondria
Linden, A., Deckers, M., Parfentev, I., Pflanz, R., Homberg, B., Neumann, P., Ficner, R., Rehling, P., & Urlaub, H. (2020) · Molecular & Cellular Proteomics · doi:10.1074/mcp.ra120.002028 · Cited by 58
Toward Increased Reliability, Transparency, and Accessibility in Cross-linking Mass Spectrometry
Leitner, A., Bonvin, A. M. J. J., Borchers, C. H., Chalkley, R. J., Chamot‐Rooke, J., Combe, C., Cox, J., Dong, M., Fischer, L., Götze, M., et al. (2020) · Structure · doi:10.1016/j.str.2020.09.011 · Cited by 58
SLIRP stabilizes LRPPRC via an RRM–PPR protein interface
Spåhr, H., Rozanska, A. L., Li, X., Atanassov, I., Lightowlers, R. N., Chrzanowska‐Lightowlers, Z. M., Rackham, O., & Larsson, N. (2016) · Nucleic Acids Research · doi:10.1093/nar/gkw575 · Cited by 55
Ihling, C. H., Piersimoni, L., Kipping, M., & Sinz, A. (2021) · Analytical Chemistry · doi:10.1021/acs.analchem.1c01317 · Cited by 56
Structural basis for the disaggregase activity and regulation of Hsp104
Heuck, A., Schitter-Sollner, S., Suskiewicz, M. J., Kurzbauer, R., Kley, J., Schleiffer, A., Rombaut, P., Herzog, F., & Clausen, T. (2016) · eLife · doi:10.7554/elife.21516 · Cited by 53
Wittig, S., Ganzella, M., Barth, M., Kostmann, S., Riedel, D., Pérez-Lara, Á., Jahn, R., & Schmidt, C. (2021) · Nature Communications · doi:10.1038/s41467-021-21102-w · Cited by 59
Bin1 directly remodels actin dynamics through its BAR domain
Dräger, N. M., Nachman, E., Winterhoff, M., Brühmann, S., Shah, P., Katsinelos, T., Boulant, S., Teleman, A. A., Faix, J., & Jahn, T. R. (2017) · The EMBO Reports · doi:10.15252/embr.201744137 · Cited by 51
Nucleosome binding by the pioneer transcription factor OCT4
Echigoya, K., Koyama, M., Negishi, L., Takizawa, Y., Mizukami, Y., Shimabayashi, H., Kuroda, A., & Kurumizaka, H. (2020) · Scientific Reports · doi:10.1038/s41598-020-68850-1 · Cited by 47
Scacioc, A., Schmidt, C., Hofmann, T., Urlaub, H., Kühnel, K., & Pérez-Lara, Á. (2017) · Scientific Reports · doi:10.1038/s41598-017-14337-5 · Cited by 44
Molecular architecture of the endocytic TPLATE complex
Yperman, K., Wang, J., Eeckhout, D., Winkler, J., Vu, L. D., Vandorpe, M., Grones, P., Mylle, E., Kraus, M., Merceron, R., et al. (2021) · Science Advances · doi:10.1126/sciadv.abe7999 · Cited by 46
Pan, D., Brockmeyer, A., Müller, F., Musacchio, A., & Bange, T. (2018) · Analytical Chemistry · doi:10.1021/acs.analchem.8b02593 · Cited by 45
Gallego, L. D., Ghodgaonkar-Steger, M., Polyansky, A. A., Schubert, T., Žagrović, B., Zheng, N., Clausen, T., Herzog, F., & Köhler, A. (2016) · Proceedings of the National Academy of Sciences · doi:10.1073/pnas.1606863113 · Cited by 43
Friese, A., Faesen, A. C., Veld, P. J. H. I. ’., Fischböck, J., Prumbaum, D., Petrović, A., Raunser, S., Herzog, F., & Musacchio, A. (2016) · Nature Communications · doi:10.1038/ncomms11407 · Cited by 40
Structure of a Tc holotoxin pore provides insights into the translocation mechanism
Roderer, D., Hofnagel, O., Benz, R., & Raunser, S. (2019) · Proceedings of the National Academy of Sciences · doi:10.1073/pnas.1909821116 · Cited by 40
Structural basis of TRAPPIII‐mediated Rab1 activation
Joiner, A. M. N., Phillips, B. P., Yugandhar, K., Sanford, E. J., Smolka, M. B., Yu, H., Miller, E. A., & Fromme, J. C. (2021) · The EMBO Journal · doi:10.15252/embj.2020107607 · Cited by 38
Conformational transitions of the Spindly adaptor underlie its interaction with Dynein and Dynactin
d’Amico, E. A., Ud Din Ahmad, M., Cmentowski, V., Girbig, M., Müller, F., Wohlgemuth, S., Brockmeyer, A., Maffini, S., Janning, P., Vetter, I. R., et al. (2022) · Journal of Cell Biology · doi:10.1083/jcb.202206131 · Cited by 34
Novel mechanistic insights into the role of Mer2 as the keystone of meiotic DNA break formation
Rousová, D., Nivsarkar, V., Altmannová, V., Funk, S. K., Raina, V. B., Liedtke, D., Janning, P., Müller, F., Reichle, H., Vader, G., et al. (2021) · eLife · doi:10.7554/elife.72330 · Cited by 38
Mitoproteomics: Tackling Mitochondrial Dysfunction in Human Disease
Gómez‐Serrano, M., Camafeita, E., Loureiro, M., & Peral, B. (2018) · Oxidative Medicine and Cellular Longevity · doi:10.1155/2018/1435934 · Cited by 38
Cross‐linked peptide identification: A computational forest of algorithms
Yılmaz, Ş., Shiferaw, G. A., Rayó, J., Economou, A., Martens, L., & Vandermarliere, E. (2018) · Mass Spectrometry Reviews · doi:10.1002/mas.21559 · Cited by 37
Nagy, B., Polak, M., Ozohanics, O., Zámbó, Z., Szabó, E., Hubert, Á., Jordan, F., Nováček, J., Ádám‐Vizi, V., & Ambrus, A. (2021) · Biochimica et Biophysica Acta (BBA) - General Subjects · doi:10.1016/j.bbagen.2021.129889 · Cited by 33
Trettin, K., Sinha, N. K., Eckert, D. M., Apple, S. E., & Bass, B. (2017) · Proceedings of the National Academy of Sciences · doi:10.1073/pnas.1707063114 · Cited by 33
Insights from the reconstitution of the divergent outer kinetochore of Drosophila melanogaster
Liu, Y., Petrović, A., Rombaut, P., Mosalaganti, S., Keller, J., Raunser, S., Herzog, F., & Musacchio, A. (2016) · Open Biology · doi:10.1098/rsob.150236 · Cited by 32
Molecular and structural basis of the chromatin remodeling activity by Arabidopsis DDM1
Osakabe, A., Takizawa, Y., Horikoshi, N., Hatazawa, S., Negishi, L., Sato, S., Berger, F., Kakutani, T., & Kurumizaka, H. (2024) · Nature Communications · doi:10.1038/s41467-024-49465-w · Cited by 30
Zhou, J., Yang, L., Ozohanics, O., Zhang, X., Wang, J., Ambrus, A., Arjunan, P., Brukh, R., Nemeria, N. S., Furey, W. F., et al. (2018) · Journal of Biological Chemistry · doi:10.1074/jbc.ra118.005432 · Cited by 27
Stadlmeier, M., Runtsch, L. S., Streshnev, F., Wühr, M., & Carell, T. (2019) · ChemBioChem · doi:10.1002/cbic.201900611 · Cited by 28
Molecular architecture of the augmin complex
Gabel, C. A., Li, Z., DeMarco, A. G., Zhang, Z., Yang, J., Hall, M. C., Barford, D., & Chang, L. (2022) · Nature Communications · doi:10.1038/s41467-022-33227-7 · Cited by 28
Nemeria, N. S., Zhang, X., Leandro, J., Zhou, J., Yang, L., Houten, S. M., & Jordan, F. (2021) · Life · doi:10.3390/life11050407 · Cited by 27
The augmin complex architecture reveals structural insights into microtubule branching
Župa, E., Würtz, M., Neuner, A., Hoffmann, T., Rettel, M., Böhler, A., Vermeulen, B. J. A., Eustermann, S., Schiebel, E., & Pfeffer, S. (2022) · Nature Communications · doi:10.1038/s41467-022-33228-6 · Cited by 26
Lubecka, E. A., & Liwo, A. (2019) · Journal of Computational Chemistry · doi:10.1002/jcc.25847 · Cited by 23
Lima, D. B., Zhu, Y., & Liu, F. (2021) · Journal of Proteome Research · doi:10.1021/acs.jproteome.0c00957 · Cited by 23
Transglutaminase 2 has higher affinity for relaxed than for stretched fibronectin fibers
Selcuk, K., Leitner, A., Braun, L., Blanc, F. L., Pacak, P., Pot, S. A., & Viola Vogel, B. (2023) · Matrix Biology · doi:10.1016/j.matbio.2023.12.006 · Cited by 21
Dudziak, A., Engelhard, L., Bourque, C., Klink, B. U., Rombaut, P., Kornakov, N., Jänen, K., Herzog, F., Gatsogiannis, C., & Westermann, S. (2021) · The EMBO Journal · doi:10.15252/embj.2021108004 · Cited by 17
Mass Spectrometry Structural Proteomics Enabled by Limited Proteolysis and Cross‐Linking
Lu, H., Zhu, Z., Fields, L. G., Zhang, H., & Li, L. (2024) · Mass Spectrometry Reviews · doi:10.1002/mas.21908 · Cited by 26
How the central domain of dystrophin acts to bridge F-actin to sarcolemmal lipids
Mias‐Lucquin, D., Morais, R. D. S., Cheron, A., Lagarrigue, M., Winder, S. J., Chenuel, T., Pérez, J., Appavou, M., Martel, A., Alviset, G., et al. (2019) · Journal of Structural Biology · doi:10.1016/j.jsb.2019.107411 · Cited by 20
Piotrowski, C., & Sinz, A. (2018) · Advances in experimental medicine and biology · doi:10.1007/978-981-13-2200-6_8 · Cited by 18
Structural basis for binding diversity of acetyltransferase p300 to the nucleosome
Hatazawa, S., Liu, J., Takizawa, Y., Zandian, M., Negishi, L., Kutateladze, T. G., & Kurumizaka, H. (2022) · iScience · doi:10.1016/j.isci.2022.104563 · Cited by 18
Structural basis of RNA-induced autoregulation of the DExH-type RNA helicase maleless
Jagtap, P. K. A., Muller, M. C., Kiss, A. E., Thomae, A. W., Lapouge, K., Beck, M., Becker, P. B., & Hennig, J. (2023) · Molecular Cell · doi:10.1016/j.molcel.2023.10.026 · Cited by 18
Kobayashi, W., Takizawa, Y., Aihara, M., Negishi, L., Ishii, H., & Kurumizaka, H. (2019) · Communications Biology · doi:10.1038/s42003-019-0385-7 · Cited by 18
Phosphorylation‐linked complex profiling identifies assemblies required for Hippo signal integration
Uliana, F., Ciuffa, R., Mishra, R., Fossati, A., Frommelt, F., Keller, S., Mehnert, M., Birkeland, E. S., van Drogen, F., Srejić, N., et al. (2023) · Molecular Systems Biology · doi:10.15252/msb.202211024 · Cited by 21
Altmannova, V., Firlej, M., Müller, F., Janning, P., Rauleder, R., Rousova, D., Schäffler, A., Bange, T., & Weir, J. R. (2023) · Nucleic Acids Research · doi:10.1093/nar/gkad175 · Cited by 15
Oligomerisation of Synaptobrevin-2 Studied by Native Mass Spectrometry and Chemical Cross-Linking
Wittig, S., Haupt, C., Hoffmann, W., Kostmann, S., Pagel, K., & Schmidt, C. (2018) · Journal of the American Society for Mass Spectrometry · doi:10.1007/s13361-018-2000-4 · Cited by 16
Cross-ID: Analysis and Visualization of Complex XL–MS-Driven Protein Interaction Networks
de Graaf, S. C., Klykov, O. V., van den Toorn, H., & Scheltema, R. A. (2018) · Journal of Proteome Research · doi:10.1021/acs.jproteome.8b00725 · Cited by 15
Rafiei, A., Tetlalmatzi, S. C., Edrington, C. H., Lee, L., Crowder, D. A., Saltzberg, D. J., Šali, A., Brouhard, G. J., & Schriemer, D. C. (2022) · eLife · doi:10.7554/elife.66975 · Cited by 18
Hydrostatic Pressure Sensing by WNK kinases
Humphreys, J. M., Teixeira, L. R., Akella, R., He, H., Kannangara, A. R., Sekulski, K., Pleinis, J. M., Liwocha, J., Jiou, J., Servage, K. A., et al. (2023) · Molecular Biology of the Cell · doi:10.1091/mbc.e23-03-0113 · Cited by 12
Quantitative Cross-Linking of Proteins and Protein Complexes
Barth, M., & Schmidt, C. (2021) · Methods in molecular biology · doi:10.1007/978-1-0716-1024-4_26 · Cited by 12
Proxl (Protein Cross-Linking Database): A Public Server, QC Tools, and Other Major Updates
Riffle, M. E., Jaschob, D., Zelter, A., & Davis, T. N. (2018) · Journal of Proteome Research · doi:10.1021/acs.jproteome.8b00726 · Cited by 9
The active DNA-PK holoenzyme occupies a tensed state in a staggered synaptic complex
Hepburn, M., Saltzberg, D. J., Lee, L., Fang, S., Atkinson, C. E., Strynadka, N. C. J., Šali, A., Lees‐Miller, S. P., & Schriemer, D. C. (2021) · Structure · doi:10.1016/j.str.2020.12.006 · Cited by 11
Ghodgaonkar-Steger, M., Potočnjak, M., Zimniak, T., Fischböck, J., Solis‐Mezarino, V., Singh, S., Speljko, T., Hagemann, G., Drexler, D. J., Witte, G., et al. (2020) · Cell Reports · doi:10.1016/j.celrep.2020.108190 · Cited by 10
Bender, J., & Schmidt, C. (2019) · Bioinformatics · doi:10.1093/bioinformatics/btz732 · Cited by 10
Saltzberg, D. J., Hepburn, M., Pilla, K. B., Schriemer, D. C., Lees‐Miller, S. P., Blundell, T. L., & Šali, A. (2019) · Progress in Biophysics and Molecular Biology · doi:10.1016/j.pbiomolbio.2019.09.003 · Cited by 10
Lubecka, E. A., & Liwo, A. (2021) · Journal of Computational Chemistry · doi:10.1002/jcc.26695 · Cited by 10
Mass spectrometry uncovers intermediates and off-pathway complexes for SNARE complex assembly
Hesselbarth, J., & Schmidt, C. (2023) · Communications Biology · doi:10.1038/s42003-023-04548-0 · Cited by 10
Zhang, X., Nemeria, N. S., Leandro, J., Houten, S. M., Lazarus, M. B., Gerfen, G. J., Ozohanics, O., Ambrus, A., Nagy, B., Brukh, R., et al. (2020) · Journal of Biological Chemistry · doi:10.1074/jbc.ra120.012761 · Cited by 9
Kenny, S., Iyer, S., Gabel, C. A., Tegenfeldt, N. M., DeMarco, A. G., Hall, M. C., Chang, L., Davisson, V. J., Pol, S. V., & Das, C. (2025) · Structure · doi:10.1016/j.str.2024.12.013 · Cited by 7
Solis‐Mezarino, V., & Herzog, F. (2017) · Nucleic Acids Research · doi:10.1093/nar/gkx411 · Cited by 8
Biochemical and functional characterization of a meiosis-specific Pch2/ORC AAA+ assembly
Villar-Fernández, M. A., da Silva, R. C., Firlej, M., Pan, D., Weir, E., Sarembe, A., Raina, V. B., Bange, T., Weir, J. R., & Vader, G. (2020) · Life Science Alliance · doi:10.26508/lsa.201900630 · Cited by 7
Jiao, S., Liu, Z., Kang, Y., Zhang, R., Wang, Y., Zhang, J., Liu, Y., & Qin, S. (2024) · Chemical and Biological Technologies in Agriculture · doi:10.1186/s40538-024-00574-0 · Cited by 6
Inert and seed-competent tau monomers suggest structural origins of aggregationPreprint
Mirbaha, H., Chen, D., Morozova, O. A., Ruff, K. M., Sharma, A., Liu, X., Pappu, R. V., Colby, D. W., Mirzaei, H., Joachimiak, Ł. A., et al. (2017) · bioRxiv (Cold Spring Harbor Laboratory) · doi:10.1101/163394 · Cited by 10
Structural basis of Cullin-2 RING E3 ligase regulation by the COP9 signalosomePreprint
Faull, S. V., Lau, A. M. C., Martens, C., Ahdash, Z., Yébenes, H., Schmidt, C., Beuron, F., Cronin, N., Morris, E. P., & Politis, A. (2018) · bioRxiv (Cold Spring Harbor Laboratory) · doi:10.1101/483024 · Cited by 6
Happonen, L. (2023) · Methods in molecular biology · doi:10.1007/978-1-0716-3243-7_12 · Cited by 4
Alvarado, Y. J., González-Paz, L. A., Paz, J. L., Loroño, M., Santiago, J., Lossada, C. A., Vivas, A., Marrero‐Ponce, Y., Martínez-Rios, F., Rodríguez-Lugo, P., et al. (2024) · Biology · doi:10.3390/biology13121065 · Cited by 3
Towards Increased Reliability, Transparency and Accessibility in Crosslinking Mass SpectrometryPreprint
Leitner, A., Bonvin, A. M. J. J., Borchers, C. H., Chalkley, R. J., Chamot‐Rooke, J., Combe, C., Cox, J., Dong, M., Fischer, L., Götze, M., et al. (2020) · arXiv (Cornell University) · doi:10.48550/arxiv.2007.00383 · Cited by 3
Osakabe, A., Takizawa, Y., Horikoshi, N., Hatazawa, S., Negishi, L., Berger, F., Kakutani, T., & Kurumizaka, H. (2023) · bioRxiv (Cold Spring Harbor Laboratory) · doi:10.1101/2023.07.10.548306 · Cited by 3
Cross-linking mass spectrometry: Workflow enhancements for mapping large-scale interactomes
Balakrishnan, S. M., Nedjadi, T., Alsiary, R., & Ansari, H. R. (2026) · Biophysical Journal · doi:10.1016/j.bpj.2026.05.033 · Cited by 2
Metadata
- Authors
- Grimm, M., Zimniak, T., Kahraman, A., & Herzog, F.
- Affiliations
- Ludwig-Maximilians-Universität München (DE)
- University of Zurich (CH)
- Corresponding author
- Herzog, Franz
- Venue
- Nucleic Acids Research
- Publisher
- Oxford University Press (OUP)
- Published
- 2015-05-08
- Volume
- 43
- Issue
- W1
- Pages
- W362-W369
- ISSN
- 0305-1048 (ISSN-L)
- 1362-4962
- PMC
- PMC4489277
- OpenAlex
- W1644001471
- Cited by
- 121
- References
- 30
- Citations by year
- 2026: 3 · 2025: 2 · 2024: 14 · 2023: 9 · 2022: 10 · 2021: 17 · 2020: 17 · 2019: 13 · 2018: 15 · 2017: 11 · 2016: 9 · 2015: 1
- FWCI
- 5.35
- Type
- journal article
- Language
- en
- Open access
- gold
- doi.org
- Licence
- Locations
- Nucleic Acids Research (publishedVersion, cc-by-nc)
- Europe PMC (PubMed Central) (publishedVersion, cc-by-nc)
- PubMed Central (publishedVersion, cc-by-nc)
- PubMed (publishedVersion)
- Open access LMU (Ludwid Maxmilian's Universitat Munchen) (submittedVersion, cc-by-sa)
- Funders
- Deutsche Forschungsgemeinschaft (GRK1721)
- Topics
- Physical Sciences › Chemistry › Spectroscopy › Mass Spectrometry Techniques and Applications
- Physical Sciences › Chemistry › Spectroscopy › Advanced Proteomics Techniques and Applications
- Life Sciences › Biochemistry, Genetics and Molecular Biology › Molecular Biology › Protein Structure and Dynamics
- Keywords
- crosslinking, distance restraints, protein complexes, protein networks, web server, false discovery rate, fragment ion spectra, evolutionary conservation
- MeSH terms
- Algorithms, Amino Acids, Computer Graphics, Cross-Linking Reagents, Histones, Nucleosomes, Software, Mass Spectrometry, Internet, Chromatin Assembly and Disassembly, Multiprotein Complexes
About these checks
Registry, retraction, Cites and statistics results are computed, not judged, with one exception: a printed reference that no index lists is read once by a model before it counts as a citation error. Claims are extracted by a model and kept only when their quote appears verbatim in the text; each cited source is then checked, with a model’s help, for whether it says what the claim relies on. Those verdicts can be wrong — read the claim’s quote and the cited source before relying on one.
Statistics and arithmetic are recomputed, not judged.
Confidence bands are shown only for fields calibrated on our annotated test set. None is calibrated yet, so no band is shown.
What counts as a claim ›How we measure confidence ›How we check this ›
Are you an author, or do you see a problem with this page? Request a review
