

The DOI matches its Crossref record; 65 of the 65 references it cites were found in a registry or an index.
Active promoters give rise to false positive ‘Phantom Peaks’ in ChIP-seq experiments
Open accessAbstract
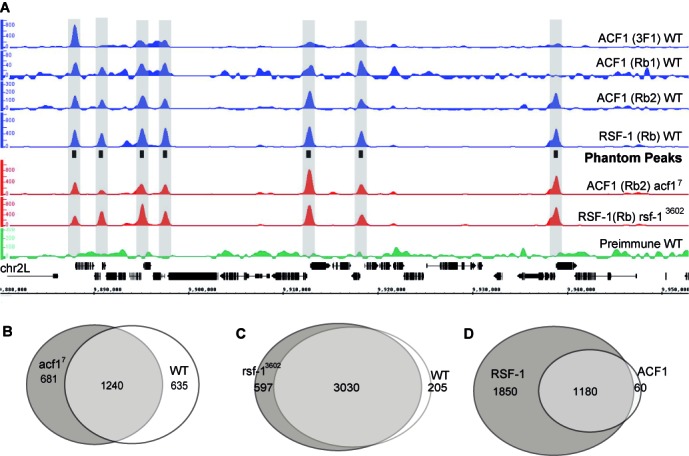
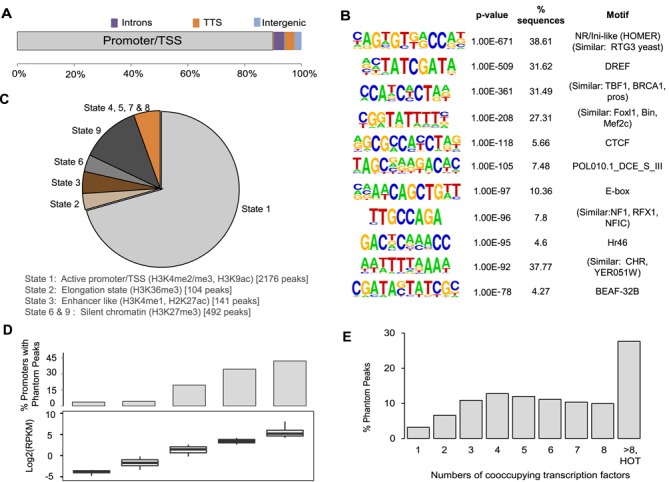
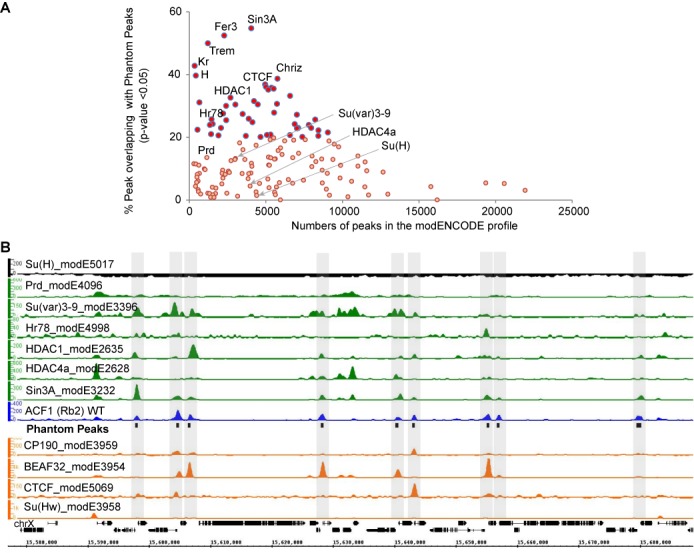
Chromatin immunoprecipitation (ChIP) is widely used to identify chromosomal binding sites. Chromatin proteins are cross-linked to their target sequences in living cells. The purified chromatin is sheared and the relevant protein is enriched by immunoprecipitation with specific antibodies. The co-purifying genomic DNA is then determined by massive parallel sequencing (ChIP-seq).We applied ChIP-seq to map the chromosomal binding sites for two ISWI-containing nucleosome remodeling factors, ACF and RSF, in Drosophila embryos. Employing several polyclonal and monoclonal antibodies directed against their signature subunits, ACF1 and RSF-1, robust profiles were obtained indicating that both remodelers co-occupied a large set of active promoters.Further validation included controls using chromatin of mutant embryos that do not express ACF1 or RSF-1. Surprisingly, the ChIP-seq profiles were unchanged, suggesting that they were not due to specific immunoprecipitation. Conservative analysis lists about 3000 chromosomal loci, mostly active promoters that are prone to non-specific enrichment in ChIP and appear as 'Phantom Peaks'. These peaks are not obtained with pre-immune serum and are not prominent in input chromatin.Mining the modENCODE ChIP-seq profiles identifies potential Phantom Peaks in many profiles of epigenetic regulators. These profiles and other ChIP-seq data featuring prominent Phantom Peaks must be validated with chromatin from cells in which the protein of interest has been depleted.
Overview
The claims and statistics of this paper haven’t been checked yet.
Run the check — free, no account needed. It reads the open-access text and checks the sources it cites.
Integrity signals
Registry
Cites
Statistics
Figures
Verification
Claims the paper makes
The claims and statistics of this paper haven’t been checked yet.
Run the check — free, no account needed. It reads the open-access text and checks the sources it cites.
Claims other papers make about this one
Each is checked against this paper’s own text: does it say what the citing paper says it does?
The source backs part of the claim, not all of it — or backs it for a different population, condition or comparison.
In the citing paper
“Although unquestionably useful, it remains unknown what proportion of candidate enhancers identified solely by biochemical marks are technical false positives130-132 or a product of having enhancer-like biochemical features but no meaningful impact on the expression of cis encoded genes133.”
From Towards a comprehensive catalogue of validated and target-linked human enhancers (2020) · cites this paper as [132]
Experimental — accuracy not yet measured
Self-check
Percentages, sums and reported differences re-computed from the paper’s own numbers.
The self-check needs the paper’s full text.
Citations
Cites
Moderated estimation of fold change and dispersion for RNA-seq data with DESeq2
Love, M. I., Huber, W., & Anders, S. (2014) · Genome Biology · doi:10.1186/s13059-014-0550-8 · Cited by 95,106
Heinz, S., Benner, C., Spann, N., Bertolino, E., Lin, Y. C., Laslo, P., Cheng, J. X., Murre, C., Singh, H., & Glass, C. K. (2010) · Molecular Cell · doi:10.1016/j.molcel.2010.05.004 · Cited by 13,382
Integrative Genomics Viewer (IGV): high-performance genomics data visualization and exploration
Thorvaldsdottir, H., Robinson, J. T., & Mesirov, J. P. (2013) · Briefings in Bioinformatics · doi:10.1093/bib/bbs017 · Cited by 9,049
The biology of chromatin remodeling complexes.
Clapier, C. R., & Cairns, B. (2009) · Annual Review of Biochemistry · doi:10.1146/annurev.biochem.77.062706.153223 · Cited by 2,384
GMAP: A genomic mapping and alignment program for mRNA and EST sequences
Wu, T. D., & Watanabe, C. K. (2005) · Bioinformatics · doi:10.1093/bioinformatics/bti310 · Cited by 2,354
Intrinsically disordered protein
Dunker, A. K., Lawson, J. D., Brown, C. J., Williams, R. M., Romero, P., Oh, J. S., Oldfield, C. J., Campen, A. M., Ratliff, C. M., Hipps, K. W., et al. (2001) · Journal of Molecular Graphics and Modelling · doi:10.1016/s1093-3263(00)00138-8 · Cited by 2,272
ChIP-seq guidelines and practices of the ENCODE and modENCODE consortia
Landt, S. G., Marinov, G. K., Kundaje, A., Kheradpour, P., Pauli, F., Batzoglou, S., Bernstein, B. E., Bickel, P., Brown, J. B., Cayting, P., et al. (2012) · Genome Research · doi:10.1101/gr.136184.111 · Cited by 2,033
Natively unfolded proteins: A point where biology waits for physics
Uversky, V. N. (2002) · Protein Science · doi:10.1110/ps.4210102 · Cited by 1,852
The CRAPome: a contaminant repository for affinity purification–mass spectrometry data
Mellacheruvu, D., Wright, Z., Couzens, A. L., Lambert, J.-P., St-Denis, N. A., Li, T., Miteva, Y. V., Hauri, S., Sardiu, M. E., Low, T. Y., et al. (2013) · Nature Methods · doi:10.1038/nmeth.2557 · Cited by 1,686
Intrinsically Disordered Proteins
Uversky, V. N. (2013) · Elsevier eBooks · doi:10.1016/b978-0-12-374984-0.01698-3 · Cited by 1,646
Cited by
Sorted by citations
An efficient targeted nuclease strategy for high-resolution mapping of DNA binding sites
Skene, P. J., & Henikoff, S. (2017) · eLife · doi:10.7554/elife.21856 · Cited by 1,737
Role of TET enzymes in DNA methylation, development, and cancer
Rasmussen, K. D., & Helin, K. (2016) · Genes & Development · doi:10.1101/gad.276568.115 · Cited by 1,040
High-resolution TADs reveal DNA sequences underlying genome organization in flies
Ramírez, F., Bhardwaj, V., Arrigoni, L., Lam, K. C., Grüning, B. A., Villaveces, J. M., Habermann, B. H., Akhtar, A., & Manke, T. (2018) · Nature Communications · doi:10.1038/s41467-017-02525-w · Cited by 993
Targeted in situ genome-wide profiling with high efficiency for low cell numbers
Skene, P. J., Henikoff, J. G., & Henikoff, S. (2018) · Nature Protocols · doi:10.1038/nprot.2018.015 · Cited by 803
Peak calling by Sparse Enrichment Analysis for CUT&RUN chromatin profiling
Meers, M. P., Tenenbaum, D., & Henikoff, S. (2019) · Epigenetics & Chromatin · doi:10.1186/s13072-019-0287-4 · Cited by 556
Metadata
- Authors
- Jain, D., Baldi, S., Zabel, A., Straub, T., & Becker, P. B.
- Affiliations
- Center for Integrated Protein Science Munich (DE)
- Corresponding author
- Becker, Peter B.
- Venue
- Nucleic Acids Research
- Publisher
- Oxford University Press (OUP)
- Published
- 2015-06-27
- Volume
- 43
- Issue
- 14
- Pages
- 6959-6968
- ISSN
- 0305-1048 (ISSN-L)
- 1362-4962
- PMC
- PMC4538825
- OpenAlex
- W1610193264
- Cited by
- 156
- References
- 65
- Citations by year
- 2026: 6 · 2025: 12 · 2024: 13 · 2023: 10 · 2022: 8 · 2021: 16 · 2020: 13 · 2019: 20 · 2018: 19 · 2017: 15 · 2016: 22 · 2015: 2
- FWCI
- 8.40
- Type
- journal article
- Language
- en
- Open access
- gold
- doi.org
- Locations
- Nucleic Acids Research (publishedVersion, cc-by)
- Europe PMC (PubMed Central) (publishedVersion, cc-by)
- PubMed Central (publishedVersion, cc-by)
- PubMed (publishedVersion)
- Open access LMU (Ludwid Maxmilian's Universitat Munchen) (submittedVersion)
- Topics
- Life Sciences › Biochemistry, Genetics and Molecular Biology › Molecular Biology › Genomics and Chromatin Dynamics
- Life Sciences › Biochemistry, Genetics and Molecular Biology › Molecular Biology › Chromatin Remodeling and Cancer
- Life Sciences › Biochemistry, Genetics and Molecular Biology › Molecular Biology › Epigenetics and DNA Methylation
- Keywords
- ACF, Drosophila embryo, chromatin immunoprecipitation, modENCODE
- MeSH terms
- RNA Splicing Factors, Animals, Binding Sites, Drosophila, Promoter Regions, Genetic, Repressor Proteins, Transcription Factors, Artifacts, RNA-Binding Proteins, Sequence Analysis, DNA, Drosophila Proteins, Databases, Genetic, Chromatin Immunoprecipitation, Chromosomes, Insect, High-Throughput Nucleotide Sequencing
About these checks
Registry, retraction, Cites and statistics results are computed, not judged, with one exception: a printed reference that no index lists is read once by a model before it counts as a citation error. Claims are extracted by a model and kept only when their quote appears verbatim in the text; each cited source is then checked, with a model’s help, for whether it says what the claim relies on. Those verdicts can be wrong — read the claim’s quote and the cited source before relying on one.
Statistics and arithmetic are recomputed, not judged.
Confidence bands are shown only for fields calibrated on our annotated test set. None is calibrated yet, so no band is shown.
What counts as a claim ›How we measure confidence ›How we check this ›
Are you an author, or do you see a problem with this page? Request a review
