

The DOI matches its Crossref record; 41 of the 41 references it cites were found in a registry or an index.
The Dreem Headband compared to polysomnography for electroencephalographic signal acquisition and sleep staging
Open accessPublished version of a preprint
Abstract
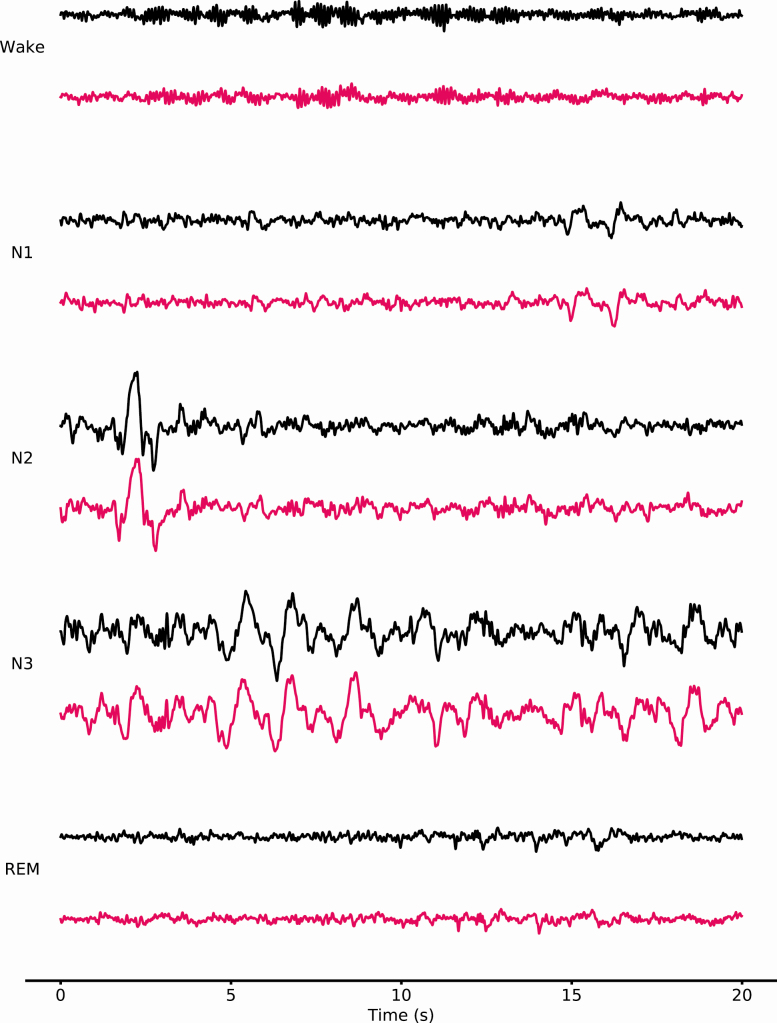
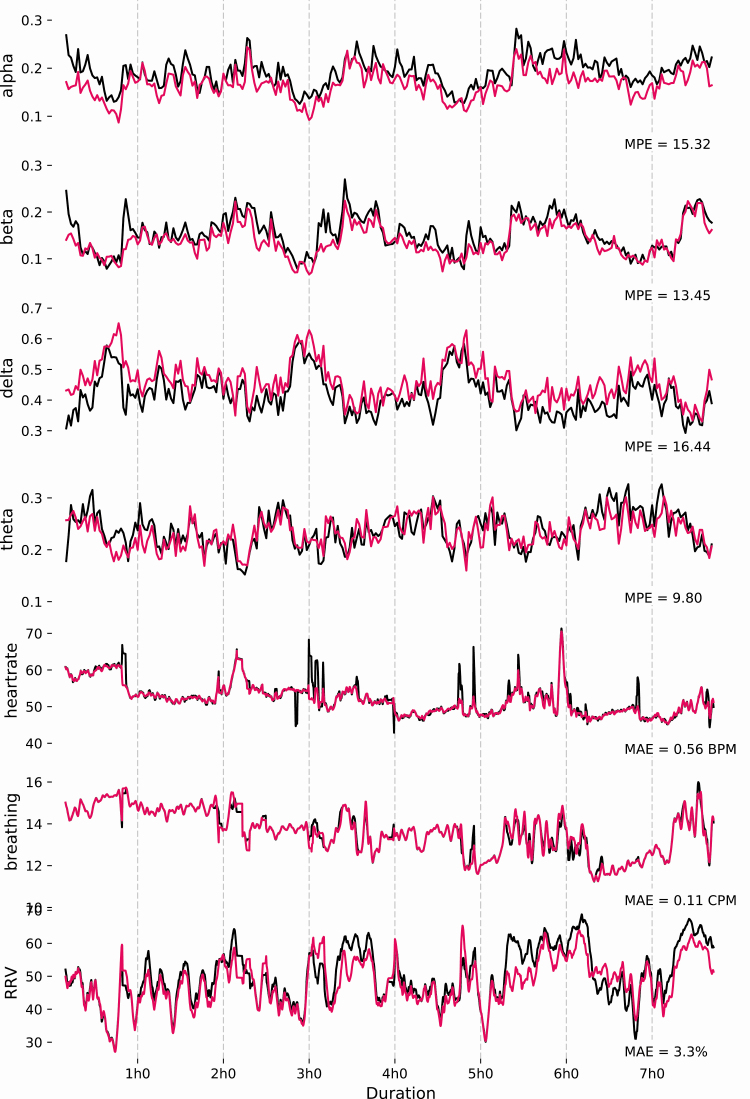
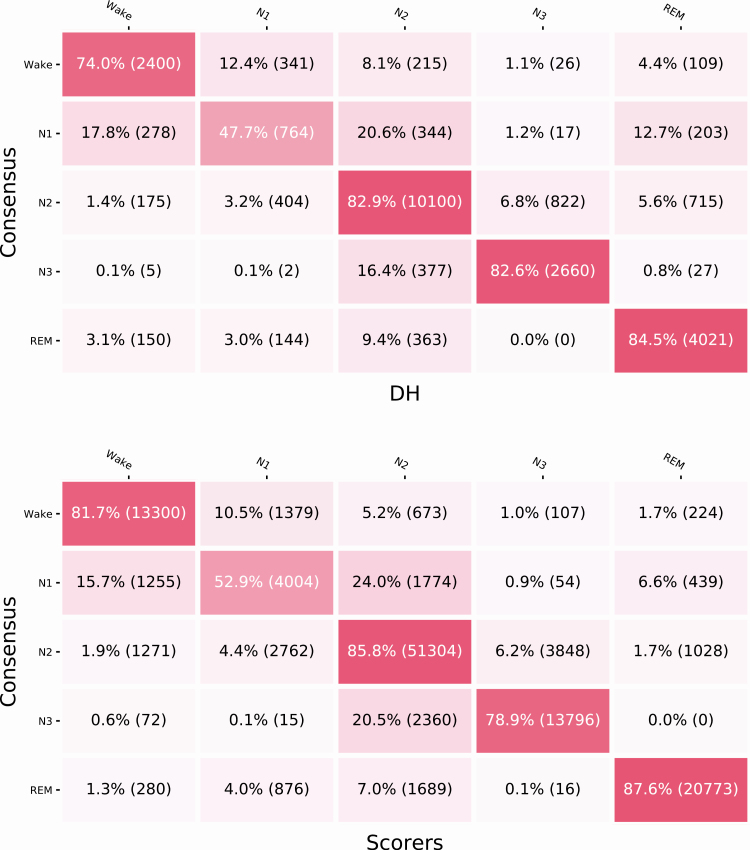
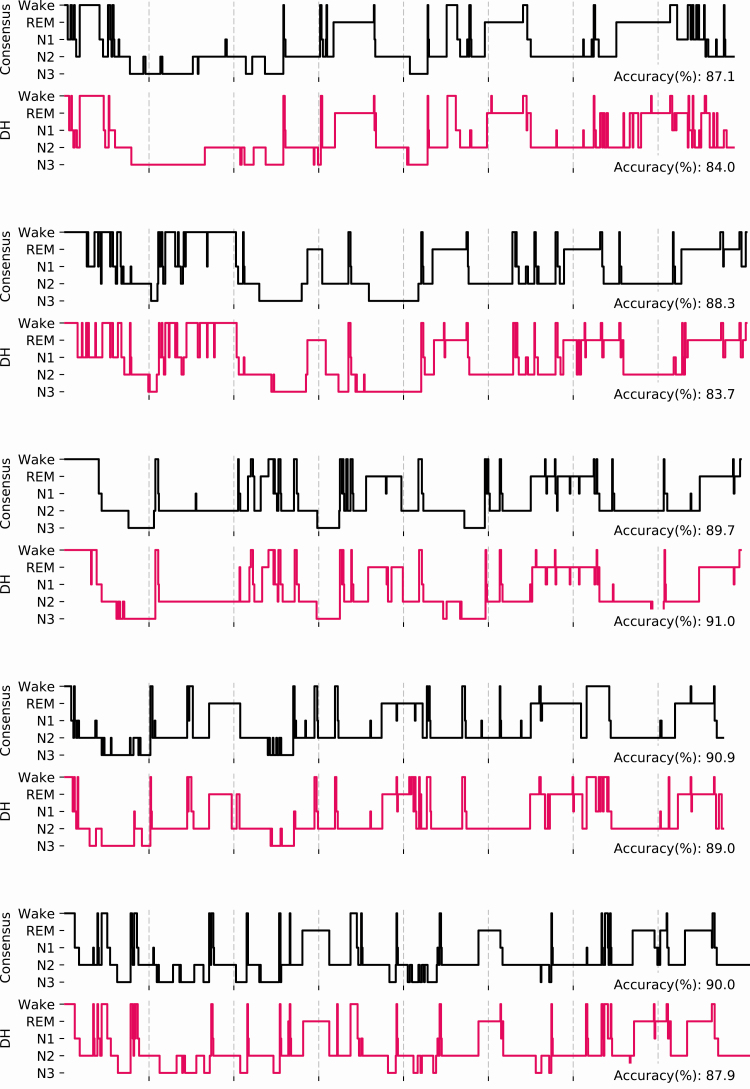
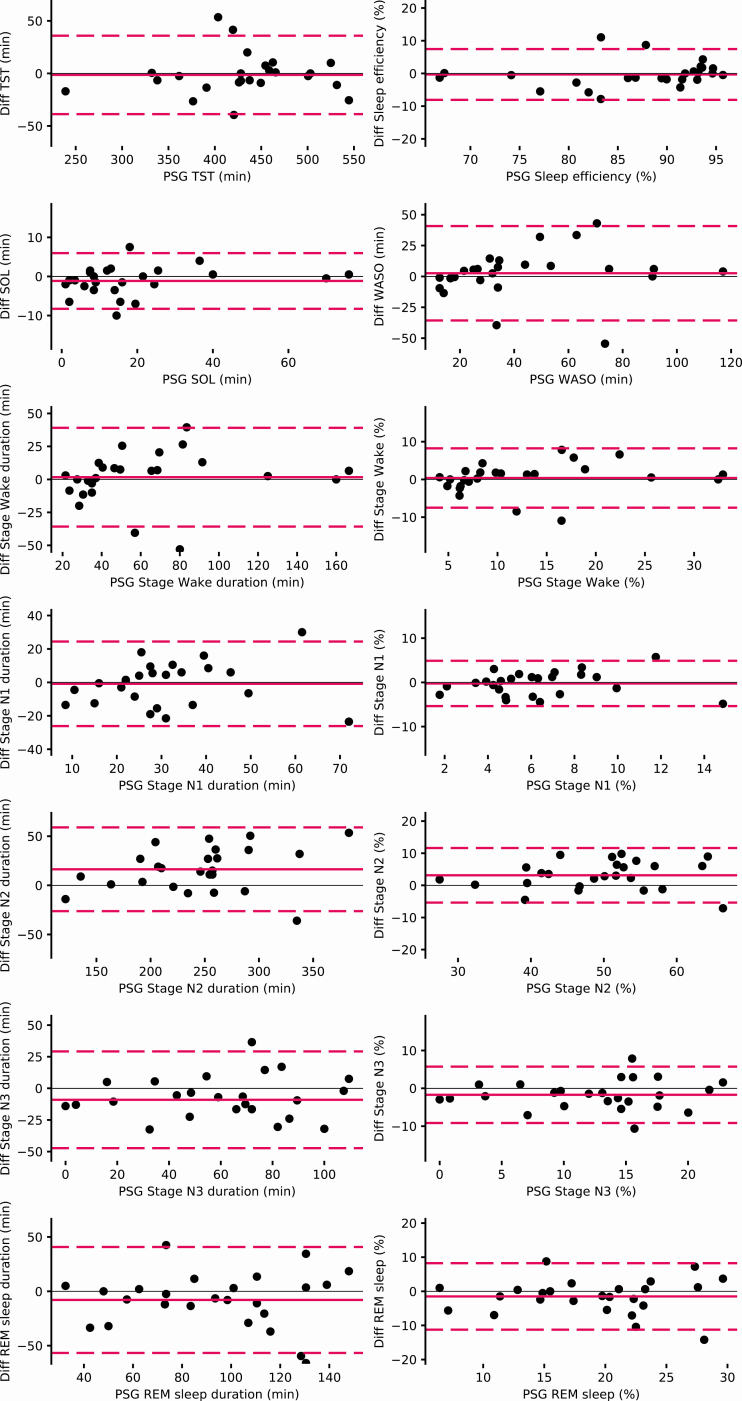
STUDY OBJECTIVES: The development of ambulatory technologies capable of monitoring brain activity during sleep longitudinally is critical for advancing sleep science. The aim of this study was to assess the signal acquisition and the performance of the automatic sleep staging algorithms of a reduced-montage dry-electroencephalographic (EEG) device (Dreem headband, DH) compared to the gold-standard polysomnography (PSG) scored by five sleep experts. METHODS: A total of 25 subjects who completed an overnight sleep study at a sleep center while wearing both a PSG and the DH simultaneously have been included in the analysis. We assessed (1) similarity of measured EEG brain waves between the DH and the PSG; (2) the heart rate, breathing frequency, and respiration rate variability (RRV) agreement between the DH and the PSG; and (3) the performance of the DH's automatic sleep staging according to American Academy of Sleep Medicine guidelines versus PSG sleep experts manual scoring. RESULTS: The mean percentage error between the EEG signals acquired by the DH and those from the PSG for the monitoring of α was 15 ± 3.5%, 16 ± 4.3% for β, 16 ± 6.1% for λ, and 10 ± 1.4% for θ frequencies during sleep. The mean absolute error for heart rate, breathing frequency, and RRV was 1.2 ± 0.5 bpm, 0.3 ± 0.2 cpm, and 3.2 ± 0.6%, respectively. Automatic sleep staging reached an overall accuracy of 83.5 ± 6.4% (F1 score: 83.8 ± 6.3) for the DH to be compared with an average of 86.4 ± 8.0% (F1 score: 86.3 ± 7.4) for the 5 sleep experts. CONCLUSIONS: These results demonstrate the capacity of the DH to both monitor sleep-related physiological signals and process them accurately into sleep stages. This device paves the way for, large-scale, longitudinal sleep studies. CLINICAL TRIAL REGISTRATION: NCT03725943.
Overview
The claims and statistics of this paper haven’t been checked yet.
Run the check — free, no account needed. It reads the open-access text and checks the sources it cites.
Integrity signals
Registry
Cites
Statistics
Figures
Verification
Claims the paper makes
The claims and statistics of this paper haven’t been checked yet.
Run the check — free, no account needed. It reads the open-access text and checks the sources it cites.
Claims other papers make about this one
Each is checked against this paper’s own text: does it say what the citing paper says it does?
In the citing paper
“In addition, AI can help with automated sleep stage classifiers and EEG pattern detectors with easy access to huge sleep datasets, such as the National Sleep Research Resource [243].”
From The emergence of AI-based wearable sensors for digital health technology: a review (2023) · cites this paper as [243]
Self-check
Percentages, sums and reported differences re-computed from the paper’s own numbers.
The self-check needs the paper’s full text.
Citations
Cites
Hochreiter, S., & Schmidhuber, J. (1997) · Neural Computation · doi:10.1162/neco.1997.9.8.1735 · Cited by 102,318
The Measurement of Observer Agreement for Categorical Data
Landis, J. R., & Koch, G. G. (1977) · Biometrics · doi:10.2307/2529310 · Cited by 81,148
A Brief Measure for Assessing Generalized Anxiety Disorder: The GAD-7
Spitzer, R. L., Kroenke, K., Williams, J. B. W., & Löwe, B. (2006) · Archives of Internal Medicine · doi:10.1001/archinte.166.10.1092 · Cited by 31,765
A New Method for Measuring Daytime Sleepiness: The Epworth Sleepiness Scale
Johns, M. W. (1991) · Sleep · doi:10.1093/sleep/14.6.540 · Cited by 17,364
(2017) · Cited by 11,625
Validation of the Insomnia Severity Index as an outcome measure for insomnia research
Bastien, C. (2001) · Sleep Medicine · doi:10.1016/s1389-9457(00)00065-4 · Cited by 8,067
(2007) · Cited by 6,530
The PHQ-9: A New Depression Diagnostic and Severity Measure
Kroenke, K., & Spitzer, R. L. (2002) · Psychiatric Annals · doi:10.3928/0048-5713-20020901-06 · Cited by 5,898
Evaluation: from precision, recall and F-measure to ROC, informedness, markedness and correlation
Powers, D. M. W. (2020) · arXiv · doi:10.48550/arxiv.2010.16061 · Cited by 5,440
International Classification of Sleep Disorders-Third Edition
Sateia, M. J. (2014) · Chest · doi:10.1378/chest.14-0970 · Cited by 3,860
Marino, M., Li, Y., Rueschman, M. N., Winkelman, J. W., Ellenbogen, J. M., Solet, J. M., Dulin, H., Berkman, L. F., & Buxton, O. M. (2013) · Sleep · doi:10.5665/sleep.3142 · Cited by 1,056
Chambon, S., Galtier, M. N., Arnal, P. J., Wainrib, G., & Gramfort, A. (2018) · IEEE Transactions on Neural Systems and Rehabilitation Engineering · doi:10.1109/tnsre.2018.2813138 · Cited by 657
The American Academy of Sleep Medicine Inter-scorer Reliability Program: Sleep Stage Scoring
Rosenberg, R. S., & Van Hout, S. (2013) · Journal of Clinical Sleep Medicine · doi:10.5664/jcsm.2350 · Cited by 456
Neural network analysis of sleep stages enables efficient diagnosis of narcolepsy
Stephansen, J. B., Olesen, A. N., Olsen, M., Ambati, A., Leary, E. B., Moore, H. E., Carrillo, O., Lin, L., Han, F., Yan, H., et al. (2018) · Nature Communications · doi:10.1038/s41467-018-07229-3 · Cited by 453
López-Gordo, M. A., Morillo, D., & Valle, F. (2014) · Sensors · doi:10.3390/s140712847 · Cited by 447
DANKER‐HOPFE, H., ANDERER, P., ZEITLHOFER, J., BOECK, M., DORN, H., GRUBER, G., HELLER, E., LORETZ, E., MOSER, D., PARAPATICS, S., et al. (2009) · Journal of Sleep Research · doi:10.1111/j.1365-2869.2008.00700.x · Cited by 417
Epidemiological Overview of sleep Disorders in the General Population
Ohayon, M. M. (2011) · Sleep Medicine Research · doi:10.17241/smr.2011.2.1.1 · Cited by 311
Movement toward a novel activity monitoring device
Montgomery-Downs, H. E., Insana, S. P., & Bond, J. A. (2012) · Sleep and Breathing · doi:10.1007/s11325-011-0585-y · Cited by 301
Depner, C. M., Cheng, P., Devine, J. K., Khosla, S., de Zambotti, M., Robillard, R., Vakulin, A., & Drummond, S. P. A. (2019) · SLEEP · doi:10.1093/sleep/zsz254 · Cited by 245
Quantifying the Arousal Threshold Using Polysomnography in Obstructive Sleep Apnea
Sands, S. A., Terrill, P. I., Edwards, B. A., Taranto‐Montemurro, L., Azarbarzin, A., Marques, M., de Melo, C. M., Loring, S. H., Butler, J. P., White, D. P., et al. (2017) · SLEEP · doi:10.1093/sleep/zsx183 · Cited by 242
Validation of an automated wireless system to monitor sleep in healthy adults
SHAMBROOM, J. R., FÁBREGAS, S. E., & JOHNSTONE, J. (2012) · Journal of Sleep Research · doi:10.1111/j.1365-2869.2011.00944.x · Cited by 216
EEG Recorded from the Ear: Characterizing the Ear-EEG Method
Mikkelsen, K. B., Kappel, S. L., Mandic, D. P., & Kidmose, P. (2015) · Frontiers in Neuroscience · doi:10.3389/fnins.2015.00438 · Cited by 198
An end-to-end framework for real-time automatic sleep stage classification
Patanaik, A., Ong, J. L., Gooley, J. J., Ancoli‐Israel, S., & Chee, M. W. L. (2018) · SLEEP · doi:10.1093/sleep/zsy041 · Cited by 170
The variability of the apnoea–hypopnoea index
Bittencourt, L., Suchecki, D., Tufik, S. B., Peres, C., Togeiro, S. M., Bagnato, M. D. C., & Nery, L. E. (2001) · Journal of Sleep Research · doi:10.1046/j.1365-2869.2001.00255.x · Cited by 161
SLEEPNET: Automated Sleep Staging System via Deep LearningPreprint
Biswal, S., Kulas, J. A., Sun, H., Goparaju, B., Westover, M. B., Bianchi, M. T., & Sun, J. (2017) · arXiv (Cornell University) · doi:10.48550/arxiv.1707.08262 · Cited by 151
The American Academy of Sleep Medicine Inter-scorer Reliability Program: Respiratory Events
Rosenberg, R. S., & Hout, S. V. (2014) · Journal of Clinical Sleep Medicine · doi:10.5664/jcsm.3630 · Cited by 144
Debellemanière, E., Chambon, S., Pinaud, C., Thorey, V., Dehaene, D., Léger, D., Chennaoui, M., Arnal, P. J., & Galtier, M. N. (2018) · Frontiers in Human Neuroscience · doi:10.3389/fnhum.2018.00088 · Cited by 124
Skoručak, J., Arbon, E. L., Dijk, D., & Achermann, P. (2018) · SLEEP · doi:10.1093/sleep/zsy078 · Cited by 115
Large-Scale Automated Sleep Staging
Sun, H., Jia, J., Goparaju, B., Huang, G.-B., Sourina, O., Bianchi, M. T., & Westover, M. B. (2017) · SLEEP · doi:10.1093/sleep/zsx139 · Cited by 110
Respiratory rate variability in sleeping adults without obstructive sleep apnea
Gutiérrez, G., Williams, J. D., Alrehaili, G. A., McLean, A., Pirouz, R., AMDUR, R. L., Jain, V., Ahari, J., Bawa, A. S., & Kimbro, S. (2016) · Physiological Reports · doi:10.14814/phy2.12949 · Cited by 99
Agreement in Computer-Assisted Manual Scoring of Polysomnograms across Sleep Centers
Kuna, S. T., Benca, R. M., Kushida, C. A., Walsh, J. K., Younes, M. K., Staley, B. A., Hanlon, A. L., Pack, A. I., Pien, G. W., & Malhotra, A. (2013) · SLEEP · doi:10.5665/sleep.2550 · Cited by 96
DOSED: A deep learning approach to detect multiple sleep micro-events in EEG signal
Chambon, S., Thorey, V., Arnal, P. J., Mignot, E. J.-M., & Gramfort, A. (2019) · Journal of Neuroscience Methods · doi:10.1016/j.jneumeth.2019.03.017 · Cited by 92
Sterr, A., Ebajemito, J. K., Mikkelsen, K. B., Bonmatí‐Carrión, M., Santhi, N., della Monica, C., Grainger, L., Atzori, G., Revell, V. L., Debener, S., et al. (2018) · Frontiers in Human Neuroscience · doi:10.3389/fnhum.2018.00452 · Cited by 91
Finan, P. H., Richards, J. M., Gamaldo, C. E., Han, D., Leoutsakos, J. M., Salas, R., Irwin, M. R., & Smith, M. T. (2016) · Journal of Clinical Sleep Medicine · doi:10.5664/jcsm.6262 · Cited by 90
White, L. H., Lyons, O. D., Yadollahi, A., Ryan, C. M., & Bradley, T. D. (2015) · Journal of Clinical Sleep Medicine · doi:10.5664/jcsm.4462 · Cited by 83
Closed-loop system to enhance slow-wave activity
Garcia‐Molina, G., Tsoneva, T., Jasko, J., Steele, B., Aquino, A., Baher, K., Pastoor, S., Pfundtner, S., Ostrowski, L., Miller, B., et al. (2018) · Journal of Neural Engineering · doi:10.1088/1741-2552/aae18f · Cited by 79
Limitations of Oximetry to Measure Heart Rate Variability Measures
Lü, G., & Yang, F. (2009) · Cardiovascular Engineering An International Journal · doi:10.1007/s10558-009-9082-3 · Cited by 65
2011 National Institutes of Health Sleep Disorders Research Plan
(2011) · PsycEXTRA Dataset · doi:10.1037/e532422012-001 · Cited by 50
Lajnef, T. (2016) · Frontiers in Neuroinformatics · doi:10.3389/fninf.2017.00015 · Cited by 35
Automatic differentiation in prose
Pfeiffer, F. W. (1987) · ACM SIGNUM Newsletter · doi:10.1145/24680.24681 · Cited by 22
Dry electrodes for bio-potential measurement in wearable systems
Srinivasa, M. G., & Pandian, P. S. (2017) · IEEE International Conference on Recent Trends in Electronics, Information & Communication Technology · doi:10.1109/rteict.2017.8256600 · Cited by 19
Cited by
Sorted by citations
The emergence of AI-based wearable sensors for digital health technology: a review
Shajari, S., Kuruvinashetti, K., Komeili, A., & Sundararaj, U. (2023) · Sensors · doi:10.3390/s23239498 · Cited by 535
U-Sleep: resilient high-frequency sleep staging
Perslev, M., Darkner, S., Kempfner, L., Nikolic, M., Jennum, P., & Igel, C. (2021) · npj Digital Medicine · doi:10.1038/s41746-021-00440-5 · Cited by 403
Wireless EEG: A survey of systems and studies
Niso, G., Romero, E., Moreau, J. T., Araújo, Á., & Krol, L. R. (2022) · NeuroImage · doi:10.1016/j.neuroimage.2022.119774 · Cited by 254
Recent advances in wearable sensors and portable electronics for sleep monitoring
Kwon, S., Kim, H., & Yeo, W.-H. (2021) · iScience · doi:10.1016/j.isci.2021.102461 · Cited by 209
Zheng, N. S., Annis, J. S., Master, H., Han, L., Gleichauf, K., Ching, J., Nasser, M., Coleman, P. L., Desine, S., Ruderfer, D. M., et al. (2024) · Nature Medicine · doi:10.1038/s41591-024-03155-8 · Cited by 212
Metadata
- Authors
- Arnal, P. J., Thorey, V., Debellemaniere, E., Ballard, M. E., Bou Hernandez, A., Guillot, A., Jourde, H., Harris, M., Guillard, M., Van Beers, P., Chennaoui, M., & Sauvet, F.
- Affiliations
- Dreem, Science Team, New York, NY
- Dreem, Algorithm Team, Paris, France
- Université Paris Descartes (FR)
- French Armed Forces Biomedical Research Institute (IRBA), Fatigue and Vigilance Unit, Bretigny-sur-Orge, France
- Corresponding author
- Arnal, Pierrick J
- Venue
- SLEEP
- Publisher
- Oxford University Press (OUP)
- Published
- 2020-05-20
- Volume
- 43
- Issue
- 11
- ISSN
- 0161-8105 (ISSN-L)
- 1550-9109
- PMC
- PMC7751170
- OpenAlex
- W3026648951
- Cited by
- 394
- References
- 40
- Citations by year
- 2026: 63 · 2025: 74 · 2024: 77 · 2023: 72 · 2022: 57 · 2021: 36 · 2020: 12
- FWCI
- 23.78
- Type
- journal article
- Language
- en
- Open access
- hybrid
- doi.org
- Licence
- Locations
- SLEEP (publishedVersion, cc-by-nc-nd)
- bioRxiv (Cold Spring Harbor Laboratory) (acceptedVersion, cc-by-nc-nd)
- PubMed Central (publishedVersion, cc-by-nc-nd)
- PubMed (publishedVersion)
- Funders
- Dreem sas
- Dreem, Inc
- Topics
- Life Sciences › Neuroscience › Cognitive Neuroscience › EEG and Brain-Computer Interfaces
- Physical Sciences › Engineering › Biomedical Engineering › Non-Invasive Vital Sign Monitoring
- Social Sciences › Psychology › Experimental and Cognitive Psychology › Sleep and related disorders
- Keywords
- automatic sleep staging, polysomnography comparison, EEG signal acquisition, sleep monitoring, heart rate
- MeSH terms
- Algorithms, Electroencephalography, Sleep, Sleep Stages, Polysomnography
About these checks
Registry, retraction, Cites and statistics results are computed, not judged, with one exception: a printed reference that no index lists is read once by a model before it counts as a citation error. Claims are extracted by a model and kept only when their quote appears verbatim in the text; each cited source is then checked, with a model’s help, for whether it says what the claim relies on. Those verdicts can be wrong — read the claim’s quote and the cited source before relying on one.
Statistics and arithmetic are recomputed, not judged.
Confidence bands are shown only for fields calibrated on our annotated test set. None is calibrated yet, so no band is shown.
What counts as a claim ›How we measure confidence ›How we check this ›
Are you an author, or do you see a problem with this page? Request a review
