

Terrace Aware Data Structure for Phylogenomic Inference from Supermatrices
Open accessThe DOI matches its Crossref record; 42 of the 42 references it cites were found in a registry or an index.
Abstract
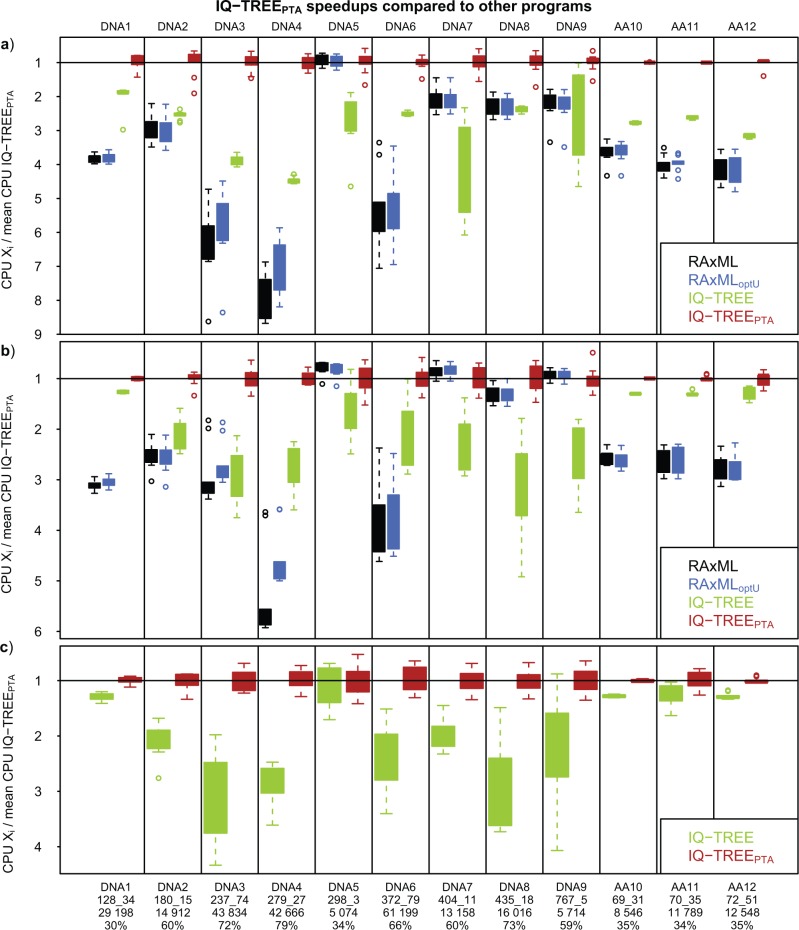
In phylogenomics the analysis of concatenated gene alignments, the so-called supermatrix, is commonly accompanied by the assumption of partition models. Under such models each gene, or more generally partition, is allowed to evolve under its own evolutionary model. Although partition models provide a more comprehensive analysis of supermatrices, missing data may hamper the tree search algorithms due to the existence of phylogenetic (partial) terraces. Here, we introduce the phylogenetic terrace aware (PTA) data structure for the efficient analysis under partition models. In the presence of missing data PTA exploits (partial) terraces and induced partition trees to save computation time. We show that an implementation of PTA in IQ-TREE leads to a substantial speedup of up to 4.5 and 8 times compared with the standard IQ-TREE and RAxML implementations, respectively. PTA is generally applicable to all types of partition models and common topological rearrangements thus can be employed by all phylogenomic inference software.
Overview
The claims and statistics of this paper haven’t been checked yet.
Free: it reads the open-access text and checks the first 5 claims that cite a source we can check. Create a free account to check every claim.
Integrity signals
Registry
Cites
Statistics
Figures



Verification
Claims the paper makes
The claims and statistics of this paper haven’t been checked yet.
Free: it reads the open-access text and checks the first 5 claims that cite a source we can check. Create a free account to check every claim.
Claims other papers make about this one
Each is checked against this paper’s own text: does it say what the citing paper says it does?
The source backs part of the claim, not all of it — or backs it for a different population, condition or comparison.
In the citing paper
“IQ-TREE 2 exploits partial terraces to improve tree search under partitioned models and achieves up to 4.5- and 8-fold speedups compared with IQ-TREE 1 and RAxML, respectively (Chernomor et al. 2016).”
From IQ-TREE 2: New Models and Efficient Methods for Phylogenetic Inference in the Genomic Era (2020) · cites this paper as Chernomor et al. 2016
Experimental — accuracy not yet measuredIn the citing paper
“This finding might not be entirely surprising because IQ-TREE represents the latest development in fast phylogenetic programs and has implemented a novel data structure to facilitate concatenation analysis (Chernomor et al. 2016).”
From Evaluating fast maximum likelihood-based phylogenetic programs using empirical phylogenomic data sets (2018) · cites this paper as Chernomor et al. 2016
Self-check
Percentages, sums and reported differences re-computed from the paper’s own numbers.
The self-check needs the paper’s full text.
Citations
Cites
1 retracted
RETRACTED ARTICLE: TREEFINDER: a powerful graphical analysis environment for molecular phylogenetics
Jobb, G., von Haeseler, A., & Strimmer, K. (2004) · BMC Evolutionary Biology · doi:10.1186/1471-2148-4-18 · Cited by 1,112
RetractedRAxML version 8: a tool for phylogenetic analysis and post-analysis of large phylogenies
Stamatakis, A. (2014) · Bioinformatics · doi:10.1093/bioinformatics/btu033 · Cited by 32,291
IQ-TREE: A Fast and Effective Stochastic Algorithm for Estimating Maximum-Likelihood Phylogenies
Nguyen, L.-T., Schmidt, H. A., von Haeseler, A., & Minh, B. Q. (2015) · Molecular Biology and Evolution · doi:10.1093/molbev/msu300 · Cited by 26,046
Self-citationGuindon, S., Dufayard, J.-F., Lefort, V., Anisimova, M., Hordijk, W., & Gascuel, O. (2010) · Systematic Biology · doi:10.1093/sysbio/syq010 · Cited by 18,376
RAxML-VI-HPC: maximum likelihood-based phylogenetic analyses with thousands of taxa and mixed models
Stamatakis, A. (2006) · Bioinformatics · doi:10.1093/bioinformatics/btl446 · Cited by 15,582
Zwickl, D. J. (2006) · Texas ScholarWorks (Texas Digital Library) · Cited by 3,530
An Improved General Amino Acid Replacement Matrix
Le, S. Q., & Gascuel, O. (2008) · Molecular Biology and Evolution · doi:10.1093/molbev/msn067 · Cited by 3,127
Yang, Z. (1994) · Journal of Molecular Evolution · doi:10.1007/bf00160154 · Cited by 2,960 · cited 3×
“1984; Yang 1994) and the LG+ (Yang 1994; Le and Gascuel 2008) models for all genes in the DNA and the AA alignments, respectively.”
BackgroundMethodBroad phylogenomic sampling improves resolution of the animal tree of life
Dunn, C. W., Hejnol, A., Matus, D. Q., Pang, K., Browne, W. E., Smith, S. A., Seaver, E., Rouse, G. W., Obst, M., Edgecombe, G. D., et al. (2008) · Nature · doi:10.1038/nature06614 · Cited by 1,921
Genome-scale approaches to resolving incongruence in molecular phylogenies.
Rokas, A., Williams, B. L., King, N., & Carroll, S. B. (2003) · Nature · doi:10.1038/nature02053 · Cited by 1,512
RAxML-III: a fast program for maximum likelihood-based inference of large phylogenetic trees
Stamatakis, A., Ludwig, T., & Meier, H. (2005) · Bioinformatics · doi:10.1093/bioinformatics/bti191 · Cited by 1,438
A new method for calculating evolutionary substitution rates
Lanave, C., Preparata, G., Sacone, C., & Serio, G. (1984) · Journal of Molecular Evolution · doi:10.1007/bf02101990 · Cited by 1,415
Phylogenomics and the reconstruction of the tree of life
Delsuc, F., Brinkmann, H., & Philippe, H. (2005) · Nature Reviews Genetics · doi:10.1038/nrg1603 · Cited by 1,236
Phylogenomics: Improving Functional Predictions for Uncharacterized Genes by Evolutionary Analysis
Eisen, J. A. (1998) · Genome Research · doi:10.1101/gr.8.3.163 · Cited by 640
Performance of maximum parsimony and likelihood phylogenetics when evolution is heterogeneous
Kolaczkowski, B., & Thornton, J. W. (2004) · Nature · doi:10.1038/nature02917 · Cited by 615
BININDA-EMONDS, O. R. P., GITTLEMAN, J. L., & PURVIS, A. (1999) · Biological Reviews of the Cambridge Philosophical Society · doi:10.1017/s0006323199005307 · Cited by 589
Springer, M. S., Meredith, R. W., Gatesy, J., Emerling, C. A., Park, J., Rabosky, D. L., Stadler, T., Steiner, C., Ryder, O. A., Janečka, J. E., et al. (2012) · PLoS ONE · doi:10.1371/journal.pone.0049521 · Cited by 520
SEPARATE VERSUS COMBINED ANALYSIS OF PHYLOGENETIC EVIDENCE
de Queiroz, A., Donoghue, M. J., & Kim, J. (1995) · Annual Review of Ecology and Systematics · doi:10.1146/annurev.es.26.110195.003301 · Cited by 516
Nyakatura, K., & Bininda-Emonds, O. R. (2012) · BMC Biology · doi:10.1186/1741-7007-10-12 · Cited by 474
Phylogenetic supertrees: Assembling the trees of life
Sanderson, M. J., Purvis, A., & Henze, C. (1998) · Trends in Ecology & Evolution · doi:10.1016/s0169-5347(97)01242-1 · Cited by 429
Maximum-likelihood models for combined analyses of multiple sequence data
Yang, Z. (1996) · Journal of Molecular Evolution · doi:10.1007/bf02352289 · Cited by 413
Heterotachy, an Important Process of Protein Evolution
Lopez, P., Casane, D., & Philippe, H. (2002) · Molecular Biology and Evolution · doi:10.1093/oxfordjournals.molbev.a003973 · Cited by 350
Heterotachy and long-branch attraction in phylogenetics
Philippe, H., Zhou, Y., Brinkmann, H., Rodrigue, N., & Delsuc, F. (2005) · BMC Evolutionary Biology · doi:10.1186/1471-2148-5-50 · Cited by 339
A Phylogenomic Approach to Resolve the Arthropod Tree of Life
Meusemann, K., von Reumont, B. M., Simon, S., Roeding, F., Strauss, S., Kuck, P., Ebersberger, I., Walzl, M., Pass, G., Breuers, S., et al. (2010) · Molecular Biology and Evolution · doi:10.1093/molbev/msq130 · Cited by 324
Pyron, R. A., Burbrink, F. T., Colli, G. R., de Oca, A. N. M., Vitt, L. J., Kuczynski, C. A., & Wiens, J. J. (2011) · Molecular Phylogenetics and Evolution · doi:10.1016/j.ympev.2010.11.006 · Cited by 321
Statistics and Truth in Phylogenomics
Kumar, S., Filipski, A. J., Battistuzzi, F. U., Kosakovsky Pond, S. L., & Tamura, K. (2012) · Molecular Biology and Evolution · doi:10.1093/molbev/msr202 · Cited by 287
The (Super)Tree of Life: Procedures, Problems, and Prospects
Bininda-Emonds, O. R. P., Gittleman, J. L., & Steel, M. A. (2002) · Annual Review of Ecology and Systematics · doi:10.1146/annurev.ecolsys.33.010802.150511 · Cited by 259
Bouchenak-Khelladi, Y., Salamin, N., Savolainen, V., Forest, F., Bank, M. V. D., Chase, M. W., & Hodkinson, T. R. (2008) · Molecular Phylogenetics and Evolution · doi:10.1016/j.ympev.2008.01.035 · Cited by 235
Fabre, P. H., Rodrigues, A., & Douzery, E. J. P. (2009) · Molecular Phylogenetics and Evolution · doi:10.1016/j.ympev.2009.08.004 · Cited by 211
The Phylogenetic Likelihood Library
Flouri, T., Izquierdo-Carrasco, F., Darriba, D., Aberer, A. J., Nguyen, L.-T., Minh, B. Q., Von Haeseler, A., & Stamatakis, A. (2015) · Systematic Biology · doi:10.1093/sysbio/syu084 · Cited by 202
Self-citationA supermatrix-based molecular phylogeny of the family Drosophilidae
van der Linde, K., Houle, D., Spicer, G. S., & Steppan, S. J. (2010) · Genetics Research · doi:10.1017/s001667231000008x · Cited by 145
Terraces in phylogenetic tree space
Sanderson, M. J., McMahon, M. M., & Steel, M. (2011) · Science · doi:10.1126/science.1206357 · Cited by 144 · cited 4×
“The EUL partition model, where each partition has its own set of branch lengths, is the most However, due to missing data an EUL model may general. lead 997 (Sanderson et al. 2011), where different tree topologies have the same score (likelihood parsimony).”
BackgroundMethodInfluentialDell’Ampio, E., Meusemann, K., Szucsich, N. U., Peters, R. S., Meyer, B., Borner, J., Petersen, M., Aberer, A. J., Stamatakis, A., Walzl, M. G., et al. (2013) · Molecular Biology and Evolution · doi:10.1093/molbev/mst196 · Cited by 143
Self-citationStamatakis, A., & Alachiotis, N. (2010) · Bioinformatics · doi:10.1093/bioinformatics/btq205 · Cited by 122
Helaers, R., & Milinkovitch, M. C. (2010) · BMC Bioinformatics · doi:10.1186/1471-2105-11-379 · Cited by 106
Stamatakis, A., & Ott, M. (2008) · Philosophical Transactions of the Royal Society B Biological Sciences · doi:10.1098/rstb.2008.0163 · Cited by 101
Using Supermatrices for Phylogenetic Inquiry: An Example Using the Sedges
Hinchliff, C. E., & Roalson, E. H. (2012) · Systematic Biology · doi:10.1093/sysbio/sys088 · Cited by 94
Algorithms, data structures, and numerics for likelihood-based phylogenetic inference of huge trees
Izquierdo-Carrasco, F., Smith, S. A., & Stamatakis, A. (2011) · BMC Bioinformatics · doi:10.1186/1471-2105-12-470 · Cited by 60
Accuracy of phylogeny reconstruction methods combining overlapping gene data sets
Kupczok, A., Schmidt, H. A., & von Haeseler, A. (2010) · Algorithms for Molecular Biology · doi:10.1186/1748-7188-5-37 · Cited by 56
Impacts of Terraces on Phylogenetic Inference
Sanderson, M. J., McMahon, M. M., Stamatakis, A., Zwickl, D. J., & Steel, M. (2015) · Systematic Biology · doi:10.1093/sysbio/syv024 · Cited by 55
The Divisible Load Balance Problem and Its Application to Phylogenetic Inference
Kobert, K., Flouri, T., Aberer, A. J., & Stamatakis, A. (2014) · Lecture notes in computer science · doi:10.1007/978-3-662-44753-6_16 · Cited by 19
Consequences of Common Topological Rearrangements for Partition Trees in Phylogenomic Inference
Chernomor, O., Minh, B. Q., & von Haeseler, A. (2015) · Journal of Computational Biology · doi:10.1089/cmb.2015.0146 · Cited by 16
Self-citation
Cited by
IQ-TREE 2: New Models and Efficient Methods for Phylogenetic Inference in the Genomic Era
Minh, B. Q., Schmidt, H. A., Chernomor, O., Schrempf, D., Woodhams, M. D., von Haeseler, A., & Lanfear, R. (2020) · Molecular Biology and Evolution · doi:10.1093/molbev/msaa015 · Cited by 16,873
Self-citationUFBoot2: Improving the Ultrafast Bootstrap Approximation
Hoang, D. T., Chernomor, O., von Haeseler, A., Minh, B. Q., & Vinh, L. S. (2018) · Molecular Biology and Evolution · doi:10.1093/molbev/msx281 · Cited by 10,881
“Figure 2 shows the ML tree inferred with IQTREE under edge-unlinked partition model (Chernomor et al. 2016), which allows separate sets of branch lengths across partitions.”
MethodSelf-citationPhylogenomics reveals the evolutionary timing and pattern of butterflies and moths
Kawahara, A. Y., Plotkin, D., Espeland, M., Meusemann, K., Toussaint, E. F. A., Donath, A., Gimnich, F., Frandsen, P. B., Zwick, A., dos Reis, M., et al. (2019) · Proceedings of the National Academy of Sciences · doi:10.1073/pnas.1907847116 · Cited by 517
Alves, R. J. E., Minh, B. Q., Urich, T., von Haeseler, A., & Schleper, C. (2018) · Nature Communications · doi:10.1038/s41467-018-03861-1 · Cited by 344
Self-citationA Comprehensive and Dated Phylogenomic Analysis of Butterflies
Espeland, M., Breinholt, J., Willmott, K. R., Warren, A. D., Vila, R., Toussaint, E. F. A., Maunsell, S. C., Aduse-Poku, K., Talavera, G., Eastwood, R., et al. (2018) · Current Biology · doi:10.1016/j.cub.2018.01.061 · Cited by 337
Metadata
- Authors
- Chernomor, O., von Haeseler, A., & Minh, B. Q.
- Affiliations
- University of Vienna (AT)
- ORCID
- Chernomor, Olga
- Venue
- Systematic Biology
- Publisher
- Oxford University Press (OUP)
- Published
- 2016-04-26
- Volume
- 65
- Issue
- 6
- Pages
- 997-1008
- ISSN
- 1063-5157 (ISSN-L)
- 1076-836X
- PMC
- PMC5066062
- OpenAlex
- W2344940607
- Cited by
- 2,252
- References
- 41
- Citations by year
- 2026: 240 · 2025: 285 · 2024: 328 · 2023: 322 · 2022: 289 · 2021: 331 · 2020: 214 · 2019: 134 · 2018: 75 · 2017: 31 · 2016: 3
- FWCI
- 42.08
- Type
- journal article
- Language
- en
- Open access
- hybrid
- doi.org
- Licence
- cc-by-nc
- Locations
- Systematic Biology (publishedVersion, cc-by-nc)
- PubMed Central (publishedVersion, cc-by-nc)
- PubMed (publishedVersion)
- HighWire Press Open Archive (submittedVersion)
- Funders
- Austrian Science Fund (I-2805-B29, I-1824-B22)
- Topics
- Life Sciences › Biochemistry, Genetics and Molecular Biology › Molecular Biology › Genomics and Phylogenetic Studies
- Life Sciences › Biochemistry, Genetics and Molecular Biology › Molecular Biology › RNA and protein synthesis mechanisms
- Life Sciences › Agricultural and Biological Sciences › Ecology, Evolution, Behavior and Systematics › Plant Diversity and Evolution
- Keywords
- partition model, supermatrix, missing data, phylogenetic tree search, IQ-TREE, RAxML, data structures
- MeSH terms
- Algorithms, Classification, Biological Evolution, Models, Biological, Phylogeny, Software, Sequence Analysis, DNA
About these checks
Registry, retraction, Cites and statistics results are computed, not judged, with one exception: a printed reference that no index lists is read once by a model before it counts as a citation error. Claims are extracted by a model and kept only when their quote appears verbatim in the text; each cited source is then checked, with a model’s help, for whether it says what the claim relies on. Those verdicts can be wrong — read the claim’s quote and the cited source before relying on one.
Statistics and arithmetic are recomputed, not judged.
Confidence bands are shown only for fields calibrated on our annotated test set. None is calibrated yet, so no band is shown.
What counts as a claim ›How we measure confidence ›How we check this ›
Are you an author, or do you see a problem with this page? Request a review
Data sources
Bibliographic data: Semantic Scholar, OpenAlex, Crossref.
Contains information from the Semantic Scholar Academic Graph Datasets, made available under the ODC Attribution License (ODC-BY 1.0).
Semantic Scholar’s data is described in: Kinney, R., et al. (2023). The Semantic Scholar Open Data Platform. arXiv:2301.10140.
