

The DOI matches its Crossref record; 32 of the 34 references it cites were found in a registry or an index; 9 of the 27 sources its claims cite were checked for support.
Advances in Difference-in-differences Methods for Policy Evaluation Research
Open accessAbstract
Difference-in-differences (DiD) is a powerful, quasi-experimental research design widely used in longitudinal policy evaluations with health outcomes. However, DiD designs face several challenges to ensuring reliable causal inference, such as when policy settings are more complex. Recent economics literature has revealed that DiD estimators may exhibit bias when heterogeneous treatment effects, a common consequence of staggered policy implementation, are present. To deepen our understanding of these advancements in epidemiology, in this methodologic primer, we start by presenting an overview of DiD methods. We then summarize fundamental problems associated with DiD designs with heterogeneous treatment effects and provide guidance on recently proposed heterogeneity-robust DiD estimators, which are increasingly being implemented by epidemiologists. We also extend the discussion to violations of the parallel trends assumption, which has received less attention. Last, we present results from a simulation study that compares the performance of several DiD estimators under different scenarios to enhance understanding and application of these methods.
Overview
CoChat Summary
## TL;DR
This paper is a methodologic primer on difference-in-differences (DiD) for health policy evaluation, focusing on why two-way fixed effects can be biased under heterogeneous treatment effects and on newer heterogeneity-robust alternatives. It also discusses violations of the parallel trends assumption and reports a Monte Carlo simulation comparing estimator performance across several scenarios.
## Key findings
- Two-way fixed effects DiD can produce biased estimates when treatment effects are heterogeneous across groups or over time; the paper explains this via “negative weights” and “forbidden comparisons.”
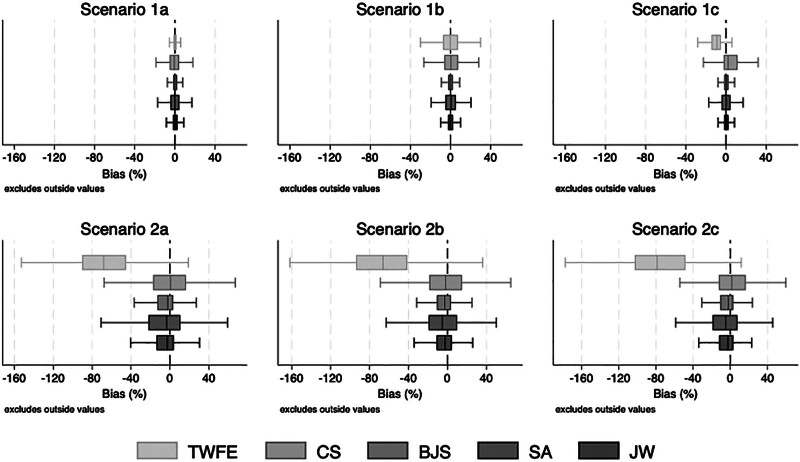
- In the simulation study, with constant and homogeneous effects, two-way fixed effects had the lowest bias (−0.01%) and RMSE (0.12).
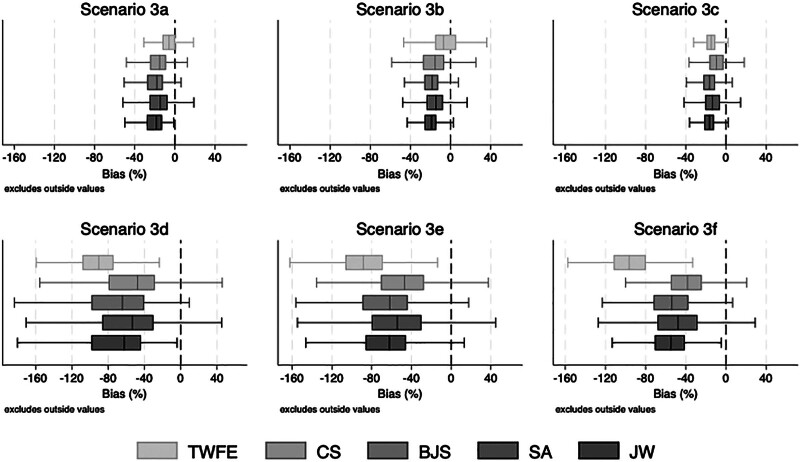
- With dynamic treatment effects, two-way fixed effects had much larger bias (−66.40% to −78.62%), while Callaway and Sant’Anna had the lowest bias (0.64%–4.14%); Borusyak et al., Sun and Abraham, and Wooldridge were around −6% bias.
- Under parallel trends violations, bias and RMSE increased across all estimators; among heterogeneity-robust methods, Callaway and Sant’Anna and Sun and Abraham outperformed Borusyak et al. and Wooldridge.
## Methods
- Methodologic primer/review of DiD designs, including the basic 2 × 2 setup, generalized/two-way fixed effects DiD for staggered adoption, heterogeneity-robust estimators, and approaches to parallel trends violations.
- Monte Carlo simulation study comparing two-way fixed effects with four heterogeneity-robust estimators across 500 runs per estimator in each scenario.
- Simulation scenarios varied along three dimensions: constant vs dynamic treatment effects, homogeneous vs heterogeneous treatment effects, and presence vs absence of parallel trends violations; performance was assessed by percent bias and RMSE.
## Limitations
- The paper notes that traditional pretrend testing has low power and is not a reliable indicator of parallel trends violations.
- The paper states that some covariate-adjustment solutions are still under development; for example, code for conditioning on the untreated potential value of covariates is “still under development.”
- Evidence evident from the text: the simulation results are based on specified scenarios and a data-generating process described in the supplement, so their applicability depends on those assumptions and may not generalize to all empirical settings.
Model-written summary. Check it against the paper before relying on it.
Integrity signals
Registry
Cites
Statistics
Figures
Verification
Claims the paper makes
4 Valid · 4 Not valid · 9 Not checked · 31 Own results and interpretations
The cited sources support only part of this claim — read each source’s verdict below.
In the paper
“Under the parallel trends assumption, de Chaisemartin and D’Haultfœuille25 show that the two-way fixed effects DiD estimator δ in Eq. (2) can be written as the weighted average of treatment effects from multiple 2 × 2 DiDs:14,25”
§ Advances in Difference-in-differences Methods for Policy Evaluation Research > KEY LIMITATIONS OF TWO-WAY FIXED EFFECTS DiD > “Negative Weights” and “Forbidden Comparisons”
What the sources say
- Could not verifycites [14] sourceExperimental — accuracy not yet measured
The Methods sections on Primary Analysis and DiD Assumptions describe this paper’s DiD model and its parallel-trends assumption. Neither states that a two-way fixed effects estimator is a weighted average of effects from multiple 2 × 2 DiDs; searches for that decomposition found no passage in our copy. The supplied passages have no page numbers. (LLM, conf=0.74)
- Partly supportedcites [25] sourceExperimental — accuracy not yet measured
The Introduction reports that the two-way fixed-effects DiD estimate is a weighted average of two-group, two-period DiD comparisons. It also cautions that, under parallel trends, those comparisons can reflect changes over time in treatment effects—not just a weighted average of treatment effects. The paper credits the 2 × 2 decomposition to Goodman-Bacon, while describing de Chaisemartin and D’Haultfœuille’s result as a weighting of group- and period-specific effects. (LLM, conf=0.86)
plain- Asserted: passes — The authors put it forward as true.
- Checkable: passes — It can be checked against evidence.
- Load-bearing: passes — The paper’s conclusions depend on it.
- Based: passes — The paper gives a reason why it holds.
- Rests on an assumption not shown here.
- Could not verify
The cited sources that could be checked couldn’t confirm or dispute this claim.
In the paper
“However, recent literature argues that the traditional parallel trends test often has low power, causing under-rejection of the null hypothesis that there are no differences between trends in treated and comparison groups (i.e., type II error).24,34”
§ Advances in Difference-in-differences Methods for Policy Evaluation Research > VIOLATIONS OF THE PARALLEL TRENDS ASSUMPTION
What the sources say
- Could not verifycites [24] sourceExperimental — accuracy not yet measured
The ‘To the Editor’ section discusses violations of the parallel trends assumption and bias in two-way fixed effects estimates, but not the power of a test for parallel trends. Searches for low power, pre-trends tests, and type II error found no passage addressing under-rejection of the null hypothesis. Page numbers were not available in our copy. (LLM, conf=0.76)
- Not matchedcites [34]
Couldn’t be matched to a paper in Crossref, so it can’t be checked.
plainstates a cause- Asserted: passes — The authors put it forward as true.
- Checkable: passes — It can be checked against evidence.
- Load-bearing: passes — The paper’s conclusions depend on it.
- Based: passes — The paper gives a reason why it holds.
- Rests on an assumption not shown here.
- Could not verify
The cited sources support only part of this claim — read each source’s verdict below.
In the paper
“Recent work has shown that the two-way fixed effects design requires an additional assumption to generate unbiased DiD estimates. Specifically, it requires that treatment effects are constant across treated groups and over time.”
§ Advances in Difference-in-differences Methods for Policy Evaluation Research > INTRODUCTION
What the sources say
- Not checked — no full text of the sourcecites [12] source
- Partly supportedcites [13] sourceExperimental — accuracy not yet measured
Section 3.2 says constant treatment effects across units and time make the static TWFE coefficient equal to the treatment effect under parallel trends and no anticipation. But it does not say this assumption is required for every TWFE design: Section 2.4 states that canonical two-period TWFE estimates the treatment effect on the treated without assuming constant effects. The claim overgeneralizes a condition discussed for the staggered static specification. (LLM, conf=0.89)
plainstates a cause- Asserted: passes — The authors put it forward as true.
- Checkable: passes — It can be checked against evidence.
- Load-bearing: passes — The paper’s conclusions depend on it.
- Based: passes — The paper gives a reason why it holds.
The cited sources that could be checked couldn’t confirm or dispute this claim.
In the paper
“Several articles have proposed alternative approaches to detect pretreatment violations of parallel trends, including tools to conduct power analyses and “noninferiority” approaches testing the likelihood of rejecting the null hypothesis of a large pretrend.15,24,34”
§ Advances in Difference-in-differences Methods for Policy Evaluation Research > VIOLATIONS OF THE PARALLEL TRENDS ASSUMPTION
What the sources say
- Not checked — no full text of the sourcecites [15] source
- Could not verifycites [24] sourceExperimental — accuracy not yet measured
The 'To the Editor' section discusses parallel-trends violations caused by dynamic treatment effects and describes estimators for addressing bias; no page number is available in our copy. Searches for pretreatment power analyses and noninferiority tests found no passage describing either approach to detecting pretrend violations. (LLM, conf=0.76)
- Not matchedcites [34]
Couldn’t be matched to a paper in Crossref, so it can’t be checked.
plain- Asserted: passes — The authors put it forward as true.
- Checkable: passes — It can be checked against evidence.
- Load-bearing: passes — The paper’s conclusions depend on it.
- Based: passes — The paper gives a reason why it holds.
- Rests on an assumption not shown here.
The cited sources support only part of this claim — read each source’s verdict below.
In the paper
“Callaway and Sant’Anna13 and Sun and Abraham27 estimators impose a weaker parallel trends assumption, which only requires parallel trends from the last pretreated period until the last time period.”
§ Advances in Difference-in-differences Methods for Policy Evaluation Research > ALTERNATIVE HETEROGENEOUS TREATMENT EFFECTS-ROBUST DiD ESTIMATORS > Differences in the Parallel Trends Assumption and Covariate Adjustment
What the sources say
- Partly supportedcites [13] sourceExperimental — accuracy not yet measured
Section 3.3 says the Callaway–Sant’Anna estimator relies on post-treatment parallel trends and, in its example, only on trends between the last pre-treatment period and the next period. Section 3.1 describes a weaker parallel-trends variant associated with both Callaway–Sant’Anna and Sun–Abraham, but our copy does not establish that the Sun–Abraham estimator requires parallel trends only from the last pre-treatment period through the final period. (LLM, conf=0.82)
- Could not verifycites [27] sourceExperimental — accuracy not yet measured
The Introduction’s “Parallel trends” section describes a strict assumption across every pair of time points and says it can be relaxed. It does not discuss the Callaway–Sant’Anna or Sun–Abraham estimators, or state that their assumption runs from the last pretreatment period to the last time period; searches for those terms found no such passage. (LLM, conf=0.75)
plain- Asserted: passes — The authors put it forward as true.
- Checkable: passes — It can be checked against evidence.
- Load-bearing: passes — The paper’s conclusions depend on it.
- Based: passes — The paper gives a reason why it holds.
- Partly supported
30 more claims · 1 with their cited sources checked
Create a free account to see all 48 claims and every source verdict.
- It may state two separate claims as one. 10
- Probably not a substantial claim. 3
Citations
Cites
Difference-in-Differences with multiple time periods
Callaway, B., & Sant’Anna, P. H. C. (2021) · Journal of Econometrics · doi:10.1016/j.jeconom.2020.12.001 · Cited by 9,126
Difference-in-differences with variation in treatment timing
Goodman-Bacon, A. (2021) · Journal of Econometrics · doi:10.1016/j.jeconom.2021.03.014 · Cited by 8,046 · cited 1×
“12,13 Heterogeneous treatment effects threaten the validity of many research designs, potentially biasing two-way fixed effects estimates.”
Estimating dynamic treatment effects in event studies with heterogeneous treatment effects
Sun, L., & Abraham, S. (2021) · Journal of Econometrics · doi:10.1016/j.jeconom.2020.09.006 · Cited by 5,518
Two-Way Fixed Effects Estimators with Heterogeneous Treatment Effects
de Chaisemartin, C., & D’Haultfœuille, X. (2020) · American Economic Review · doi:10.1257/aer.20181169 · Cited by 5,031 · cited 8×
“(2) can be written as the weighted average of treatment effects from multiple 2 × 2 DiDs: 14,25 where τ g , t represents the estimated ATT of group g at period t .”
InfluentialHow Much Should We Trust Staggered Difference-in-Differences Estimates?
Baker, A. C., Larcker, D. F., & Wang, C. C. Y. (2022) · Journal of Financial Economics · doi:10.1016/j.jfineco.2022.01.004 · Cited by 3,149
The Effect of Minimum Wages on Low-Wage Jobs*
Cengiz, D., Dube, A., Lindner, A., & Zipperer, B. (2019) · The Quarterly Journal of Economics · doi:10.1093/qje/qjz014 · Cited by 2,688
Revisiting Event-Study Designs: Robust and Efficient Estimation
Borusyak, K., Jaravel, X., & Spiess, J. (2024) · Review of Economic Studies · doi:10.1093/restud/rdae007 · Cited by 2,280
What's trending in difference-in-differences? A synthesis of the recent econometrics literature
Roth, J., Sant’Anna, P. H. C., Bilinski, A., & Poe, J. (2023) · Journal of Econometrics · doi:10.1016/j.jeconom.2023.03.008 · Cited by 2,027 · cited 3×
“14,15 Nonetheless, we recommend researchers to carefully evaluate which method to employ based on the specific context of their study, including factors discussed below.”
A More Credible Approach to Parallel Trends
Rambachan, A., & Roth, J. (2023) · Review of Economic Studies · doi:10.1093/restud/rdad018 · Cited by 1,559
Designing Difference in Difference Studies: Best Practices for Public Health Policy Research
Wing, C., Simon, K., & Bello-Gomez, R. A. (2018) · Annual Review of Public Health · doi:10.1146/annurev-publhealth-040617-013507 · Cited by 1,470
Cited by
Liu, K., Huang, T., Xia, Z., et al. (2024) · Applied Energy · doi:10.1016/j.apenergy.2024.124489 · Cited by 45
Luo, M., Li, H., Li, R., Wu, Y., Lan, Y., & Xie, S. (2025) · Frontiers in Public Health · doi:10.3389/fpubh.2025.1563204 · Cited by 29
Poverty and Childhood Obesity: Current Evidence and Methodologies for Future Research
Liang, R., Goto, R., Okubo, Y., Rehkopf, D. H., & Inoue, K. (2025) · Current Obesity Reports · doi:10.1007/s13679-025-00627-x · Cited by 21
“A DiD analysis takes advantage of the time before and after a treat-ment (intervention or policy) is implemented to compare outcomes between the treated and untreated groups [84].”
Zhu, R., Dong, Y., Guo, J., He, J., Chen, H., Wang, R., Ren, F., Raben, A., & Martínez, J. A. (2025) · Clinical Nutrition · doi:10.1016/j.clnu.2025.10.009 · Cited by 17
Turner, P., Rushby, T., Manfren, M., James, P. A. B., Gauthier, S., Bahaj, A. S., Sweetnam, T., Kim, S., & Ridett, E. M. (2025) · Applied Energy · doi:10.1016/j.apenergy.2025.125705 · Cited by 14
“…comparison group approach is used by Glass et al. [72] for Demand Response (DR) performance evaluation at scale, where the underlying methodology is based on Difference in Differences (DID) technique; DID is used also with time series in the context of policy evaluation [73] and econometrics [74].”
Metadata
- Authors
- Wang, G., Hamad, R., & White, J. S.
- Affiliations
- Harvard University (US)
- Boston University (US)
- Corresponding author
- White, Justin S.
- Venue
- Epidemiology
- Published
- 2024-07-05
- Volume
- 35
- Issue
- 5
- Pages
- 628-637
- ISSN
- 1044-3983 (ISSN-L)
- 1531-5487
- PMC
- PMC11305929
- OpenAlex
- W4400349012
- Cited by
- 117
- References
- 34
- Citations by year
- 2026: 57 · 2025: 56 · 2024: 4
- FWCI
- 40.15
- Type
- journal article
- Language
- en
- Open access
- hybrid
- doi.org
- Licence
- Locations
- Epidemiology (publishedVersion, cc-by-nc-nd)
- PubMed Central (publishedVersion, cc-by-nc-nd)
- PubMed (publishedVersion)
- eScholarship (California Digital Library) (submittedVersion, cc-by-nc-nd)
- Funders
- National Institutes of Health
- National Heart, Lung, and Blood Institute (R01HL151638)
- Topics
- Physical Sciences › Mathematics › Statistics and Probability › Advanced Causal Inference Techniques
- Social Sciences › Public Administration › Evaluation and Performance Assessment
- Physical Sciences › Mathematics › Statistics and Probability › Statistical Methods in Clinical Trials
- Keywords
- difference-in-differences, policy evaluation, staggered treatment effects, treatment effect heterogeneity, parallel trends assumption, causal inference, health outcomes, simulation study
- MeSH terms
- Computer Simulation, Health Policy, Humans, Research Design, Models, Statistical, Bias
About these checks
Registry, retraction, Cites and statistics results are computed, not judged, with one exception: a printed reference that no index lists is read once by a model before it counts as a citation error. Claims are extracted by a model and kept only when their quote appears verbatim in the text; each cited source is then checked, with a model’s help, for whether it says what the claim relies on. Those verdicts can be wrong — read the claim’s quote and the cited source before relying on one.
The claim verdicts this report counts are experimental: their accuracy is not yet measured.
A language model drew the claims from the paper on 2026-09-30, under version 3 of the claim definition (model deepseek-v4.1-flash, prompt extract-v3).
A second model labelled each claim on 2026-09-30 (model jev-1.13-20260917, definition revision gold-guideline-v0.2).
Cited sources are checked with a language model’s help (gpt-6-sol).
Statistics and arithmetic are recomputed, not judged.
Confidence bands are shown only for fields calibrated on our annotated test set. None is calibrated yet, so no band is shown.
What counts as a claim ›How we measure confidence ›How we check this ›
Are you an author, or do you see a problem with this page? Request a review
How to cite
Cite CoChat for the checks on this page, and the paper for its own findings.
- This page
- CoChat. (2026). Citation check: Advances in Difference-in-differences Methods for Policy Evaluation Research. https://app.cochat.ai/papers/10.1097/ede.0000000000001755
- The paper
- Wang, G., Hamad, R., & White, J. S. (2024). Advances in Difference-in-differences Methods for Policy Evaluation Research. Epidemiology. https://doi.org/10.1097/ede.0000000000001755
Data sources
Bibliographic data: Semantic Scholar, OpenAlex, Crossref.
Contains information from the Semantic Scholar Academic Graph Datasets, made available under the ODC Attribution License (ODC-BY 1.0).
Semantic Scholar’s data is described in: Kinney, R., et al. (2023). The Semantic Scholar Open Data Platform. arXiv:2301.10140.
