

The DOI matches its Crossref record; 84 of the 85 references it cites were found in a registry or an index.
Wide-field optical mapping of neural activity and brain haemodynamics: considerations and novel approaches
Open accessAbstract
Although modern techniques such as two-photon microscopy can now provide cellular-level three-dimensional imaging of the intact living brain, the speed and fields of view of these techniques remain limited. Conversely, two-dimensional wide-field optical mapping (WFOM), a simpler technique that uses a camera to observe large areas of the exposed cortex under visible light, can detect changes in both neural activity and haemodynamics at very high speeds. Although WFOM may not provide single-neuron or capillary-level resolution, it is an attractive and accessible approach to imaging large areas of the brain in awake, behaving mammals at speeds fast enough to observe widespread neural firing events, as well as their dynamic coupling to haemodynamics. Although such wide-field optical imaging techniques have a long history, the advent of genetically encoded fluorophores that can report neural activity with high sensitivity, as well as modern technologies such as light emitting diodes and sensitive and high-speed digital cameras have driven renewed interest in WFOM. To facilitate the wider adoption and standardization of WFOM approaches for neuroscience and neurovascular coupling research, we provide here an overview of the basic principles of WFOM, considerations for implementation of wide-field fluorescence imaging of neural activity, spectroscopic analysis and interpretation of results. This article is part of the themed issue ‘Interpreting BOLD: a dialogue between cognitive and cellular neuroscience’.
Overview
The claims and statistics of this paper haven’t been checked yet.
Run the check — free, no account needed. It reads the open-access text and checks the sources it cites.
Integrity signals
Registry
Cites
Statistics
Figures
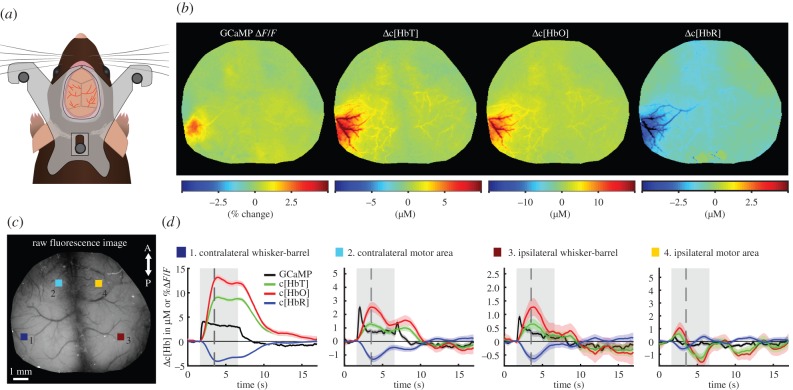
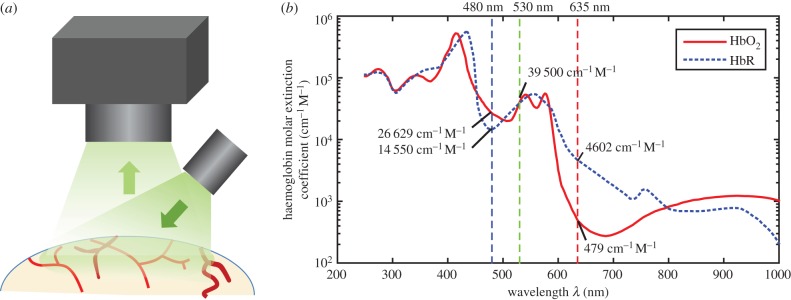
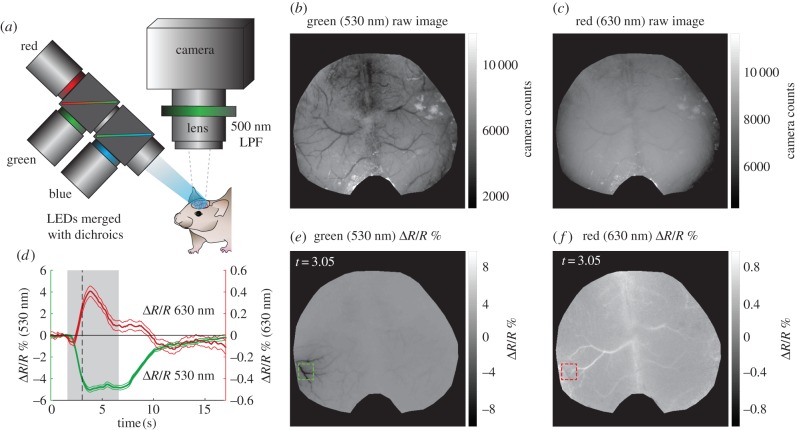
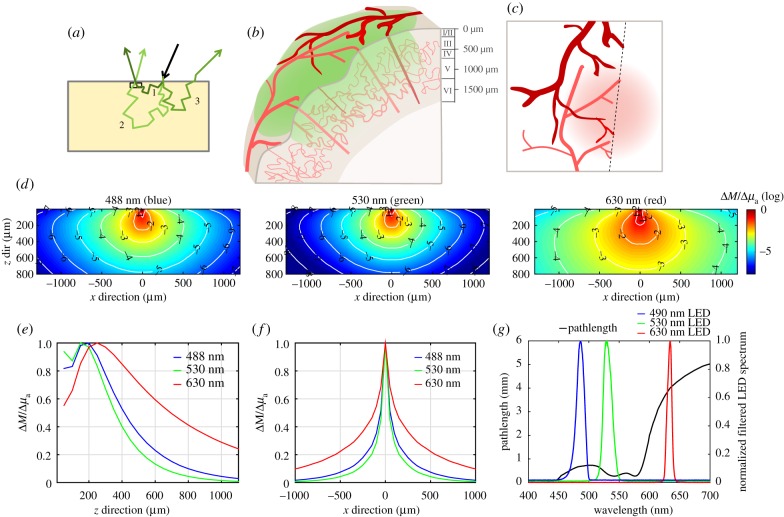
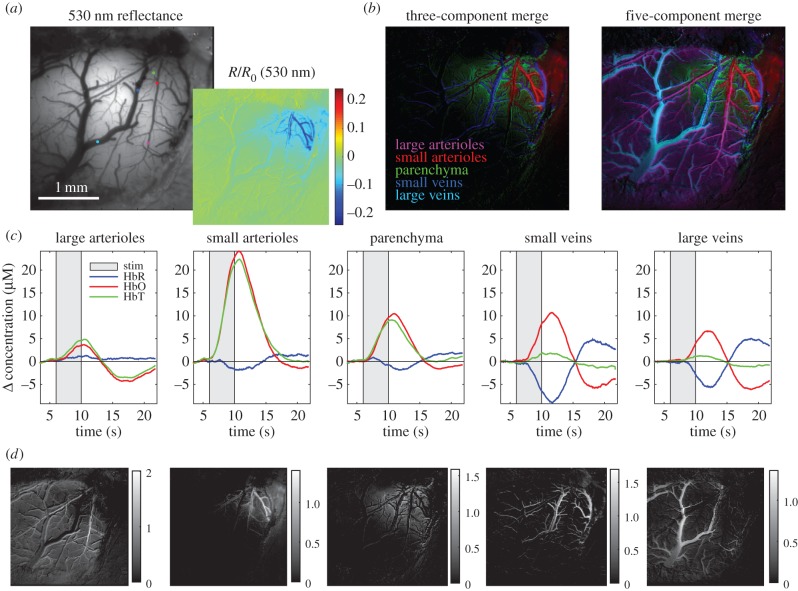
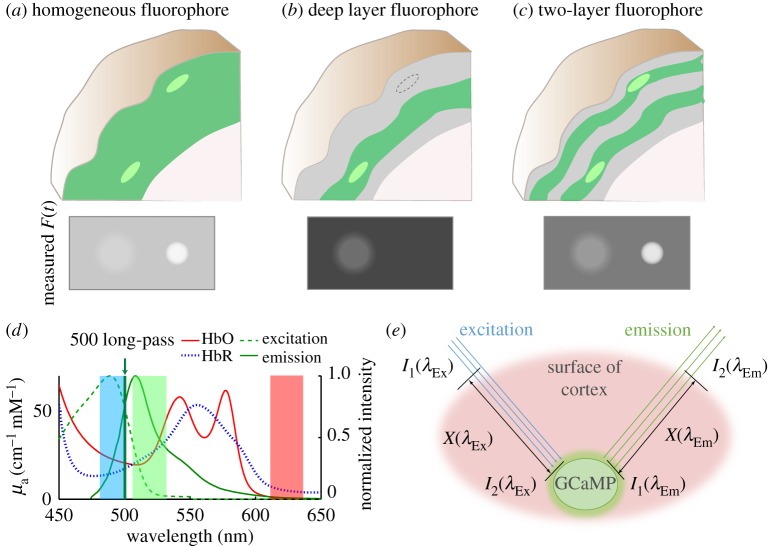
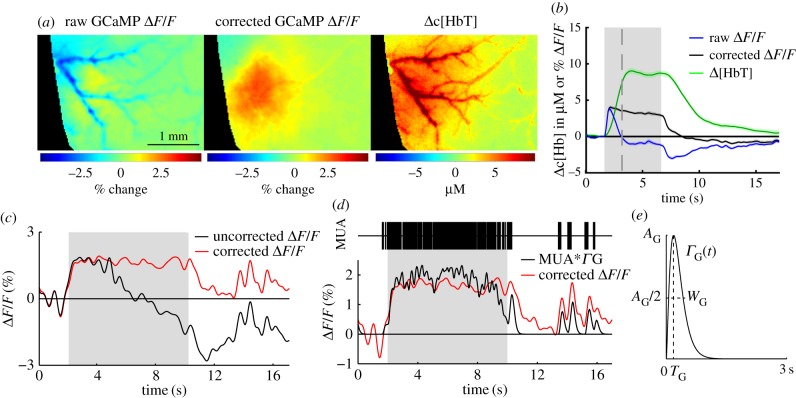
Verification
Claims the paper makes
The claims and statistics of this paper haven’t been checked yet.
Run the check — free, no account needed. It reads the open-access text and checks the sources it cites.
Claims other papers make about this one
Each is checked against this paper’s own text: does it say what the citing paper says it does?
The source backs part of the claim, not all of it — or backs it for a different population, condition or comparison.
In the citing paper
“Violet to yellow excitation and emission light are well absorbed by the blood within the vasculature. Therefore, when fluorescent proteins are diffusely expressed in brain cells, blood vessels that lack these proteins appear as dark shadows36,37.”
From Energy paradox in REM sleep: balancing supply and consumption in brain metabolism (2026) · cites this paper as [37]
Experimental — accuracy not yet measuredThe cited source says what the claim attributes to it.
In the citing paper
“Vessel dilation consequently reduces the detectable parenchymal fluorescence.”
From Energy paradox in REM sleep: balancing supply and consumption in brain metabolism (2026) · cites this paper as [37]
Self-check
Percentages, sums and reported differences re-computed from the paper’s own numbers.
The self-check needs the paper’s full text.
Citations
Cites
Ultrasensitive fluorescent proteins for imaging neuronal activity
Chen, T.-W., Wardill, T. J., Sun, Y., Pulver, S. R., Renninger, S. L., Baohan, A., Schreiter, E. R., Kerr, R. A., Orger, M. B., Jayaraman, V., et al. (2013) · Nature · doi:10.1038/nature12354 · Cited by 6,474
Millisecond-timescale, genetically targeted optical control of neural activity
Boyden, E. S., Zhang, F., Bamberg, E., Nagel, G., & Deisseroth, K. A. (2005) · Nature Neuroscience · doi:10.1038/nn1525 · Cited by 5,015
MCML—Monte Carlo modeling of light transport in multi-layered tissues
Wang, L. V., Jacques, S. L., & Zheng, L. (1995) · Computer Methods and Programs in Biomedicine · doi:10.1016/0169-2607(95)01640-f · Cited by 3,330
Capillary pericytes regulate cerebral blood flow in health and disease
Hall, C. N., Reynell, C., Gesslein, B., Hamilton, N. B., Mishra, A., Sutherland, B. A., O’Farrell, F. M., Buchan, A. M., Lauritzen, M., & Attwell, D. (2014) · Nature · doi:10.1038/nature13165 · Cited by 1,870
Functional architecture of cortex revealed by optical imaging of intrinsic signals
Grinvald, A., Lieke, E. E., Frostig, R. D., Gilbert, C. D., & Wiesel, T. N. (1986) · Nature · doi:10.1038/324361a0 · Cited by 1,243
Diversity of astrocyte functions and phenotypes in neural circuits
Khakh, B. S., & Sofroniew, M. V. (2015) · Nature Neuroscience · doi:10.1038/nn.4043 · Cited by 1,239
Functional imaging with cellular resolution reveals precise micro-architecture in visual cortex
Ohki, K., Chung, S., Ch'ng, Y. H., Kara, P., & Reid, R. C. (2005) · Nature · doi:10.1038/nature03274 · Cited by 1,191
Miniaturized integration of a fluorescence microscope
Ghosh, K. K., Burns, L. D., Cocker, E. D., Nimmerjahn, A., Ziv, Y., Gamal, A. E., & Schnitzer, M. J. (2011) · Nature Methods · doi:10.1038/nmeth.1694 · Cited by 1,130
Malonek, D., & Grinvald, A. (1996) · Science · doi:10.1126/science.272.5261.551 · Cited by 1,109
Akerboom, J., Calderón, N. C., Tian, L., Wabnig, S., Prigge, M., Tolö, J., Gordus, A. G., Orger, M. B., Severi, K. E., Macklin, J. J., et al. (2013) · Frontiers in Molecular Neuroscience · doi:10.3389/fnmol.2013.00002 · Cited by 736
Cited by
Sorted by citations
Ma, Y., Shaik, M. A., Kozberg, M. G., Kim, S. H., Portes, J., Timerman, D., & Hillman, E. M. C. (2016) · Proceedings of the National Academy of Sciences · doi:10.1073/pnas.1525369113 · Cited by 325
Self-citationGlymphatic influx and clearance are accelerated by neurovascular coupling
Holstein-Rønsbo, S., Gan, Y., Giannetto, M. J., Rasmussen, M. K., Sigurdsson, B., Beinlich, F. R. M., Rose, L., Untiet, V., Hablitz, L. M., Kelley, D. H., et al. (2023) · Nature Neuroscience · doi:10.1038/s41593-023-01327-2 · Cited by 248
Task-Dependent Changes in the Large-Scale Dynamics and Necessity of Cortical Regions
Pinto, L., Rajan, K., DePasquale, B., Thiberge, S. Y., Tank, D. W., & Brody, C. D. (2019) · Neuron · doi:10.1016/j.neuron.2019.08.025 · Cited by 244
Renaudin, N., Demené, C., Dizeux, A., Ialy-Radio, N., Pezet, S., & Tanter, M. (2022) · Nature Methods · doi:10.1038/s41592-022-01549-5 · Cited by 204
Linking brain vascular physiology to hemodynamic response in ultra-high field MRI
Uludaǧ, K., & Blinder, P. (2017) · NeuroImage · doi:10.1016/j.neuroimage.2017.02.063 · Cited by 175
Metadata
- Authors
- Ma, Y., Shaik, M. A., Kim, S. H., Kozberg, M. G., Thibodeaux, D. N., Zhao, H. T., Yu, H., & Hillman, E. M. C.
- Affiliations
- Mortimer B. Zuckerman Mind Brain Behavior Institute (US)
- Corresponding author
- Hillman, Elizabeth M. C.
- ORCID
- Venue
- Philosophical Transactions of the Royal Society B: Biological Sciences
- Publisher
- The Royal Society
- Published
- 2016-10-05
- Volume
- 371
- Issue
- 1705
- Pages
- 20150360
- ISSN
- 0962-8436 (ISSN-L)
- 1471-2970
- PMC
- PMC5003860
- OpenAlex
- W2513047215
- Cited by
- 335
- References
- 85
- Citations by year
- 2026: 24 · 2025: 54 · 2024: 52 · 2023: 47 · 2022: 40 · 2021: 31 · 2020: 24 · 2019: 21 · 2018: 24 · 2017: 15 · 2016: 3
- FWCI
- 3.25
- Type
- journal article
- Language
- en
- Update notices
- correction (2017-02-19)
- Open access
- hybrid
- doi.org
- Locations
- Philosophical Transactions of the Royal Society B Biological Sciences (publishedVersion, cc-by)
- PubMed Central (publishedVersion, cc-by)
- PubMed (publishedVersion)
- Funders
- National Science Foundation (0954796)
- U.S. Department of Defense (MURI W911NF-12-1-0594)
- National Institute of Neurological Disorders and Stroke (1R01NS063226, 5U01NS094296, 1R21NS053684, 1R01NS076628)
- National Eye Institute (1R01EY019500)
- Topics
- Health Sciences › Medicine › Radiology, Nuclear Medicine and Imaging › Optical Imaging and Spectroscopy Techniques
- Life Sciences › Biochemistry, Genetics and Molecular Biology › Biophysics › Advanced Fluorescence Microscopy Techniques
- Life Sciences › Neuroscience › Cognitive Neuroscience › Neural dynamics and brain function
- Keywords
- neuronal activity imaging, neurovascular coupling, genetically encoded fluorescent indicators, wide-field fluorescence imaging, spectroscopic analysis, cortical imaging, BOLD signal
- MeSH terms
- Animals, Brain, Brain Mapping, Hemodynamics, Humans, Neurons, Mice, Rats, Optical Imaging
About these checks
Registry, retraction, Cites and statistics results are computed, not judged, with one exception: a printed reference that no index lists is read once by a model before it counts as a citation error. Claims are extracted by a model and kept only when their quote appears verbatim in the text; each cited source is then checked, with a model’s help, for whether it says what the claim relies on. Those verdicts can be wrong — read the claim’s quote and the cited source before relying on one.
Statistics and arithmetic are recomputed, not judged.
Confidence bands are shown only for fields calibrated on our annotated test set. None is calibrated yet, so no band is shown.
What counts as a claim ›How we measure confidence ›How we check this ›
Are you an author, or do you see a problem with this page? Request a review
