Student or educator? Sign up with your school email and get 6 months of Pro free.
PreprintCited by 19

The DOI matches its Crossref record; 17 of the 17 references it cites were found in a registry or an index.

Compartment-Specific Neurexin Nanodomains Orchestrate Tripartite Synapse Assembly

Trotter, Justin H., Dargaei, Zahra, Sclip, Alessandra, Essayan-Perez, Sofia, Liakath-Ali, Kif, Raju, Karthik, Nabet, Amber, Liu, Xinran, Wöhr, Markus, Südhof, Thomas C.·2020

Abstract

At tripartite synapses, astrocytes enmesh synaptic contacts, but how astrocytes contribute to the formation, maturation and plasticity of synapses remains elusive. Here we show that both astrocytes and neurons abundantly express neurexin-1, a presynaptic adhesion molecule that controls synaptic properties. Using super-resolution imaging, we demonstrate that presynaptic neuronal and astrocytic neurexin-1 form discrete nanoclusters at excitatory synapses. We find that distinct patterns of heparan sulfate modification and alternative splicing confer onto astrocytic and neuronal neurexin-1 different ligand specificities, thereby enabling compartment-specific signaling by neurexin-1. At hippocampal Schaffer-collateral synapses, deletion of neurexin-1 from either astrocytes or neurons did not alter synapse numbers, but differentially impaired synapse function. Neuronal neurexin-1 was essential for NMDA-receptor-mediated synaptic responses, whereas astrocytic neurexin-1 was required for maturation of silent synapses, AMPA-receptor recruitment, and long-term potentiation. Thus, astrocytes and neurons surprisingly use the same synaptic adhesion molecule to control distinct synapse properties.

Overview

The claims and statistics of this paper haven’t been checked yet.

Run the check — free, no account needed. It reads the open-access text and checks the sources it cites.

A few free checks a day · papers already verified open instantly · results are public

Integrity signals

Registry

Crossref · 10.1101/2020.08.21.262097

Cites

17 of 17 references verified0 citation errors · 0 not checkable

Statistics

Figures

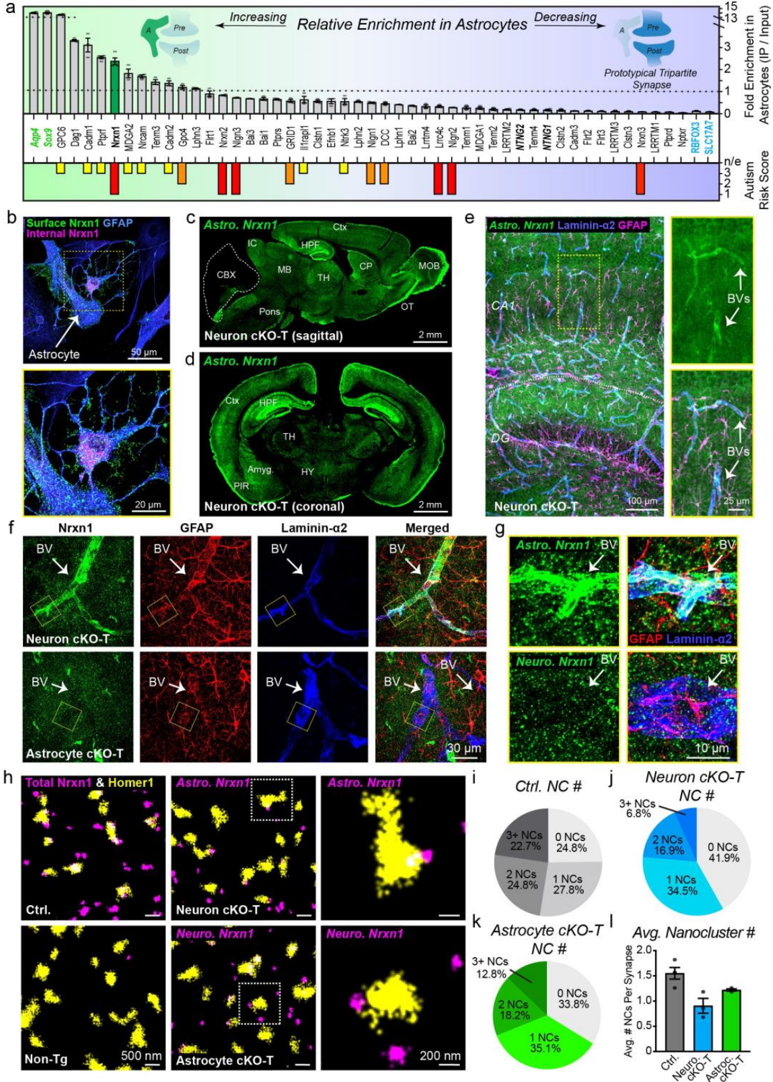
Figure 1 Astrocytes express and target the major synapse organizer Nrxn1 to vascular endfeet and synapses. a, Profile of synapse adhesion molecule enrichment in ribosome-bound
Figure 1 Astrocytes express and target the major synapse organizer Nrxn1 to vascular endfeet and synapses. a, Profile of synapse adhesion molecule enrichment in ribosome-boundCC-BY-NC-ND · From the PDF
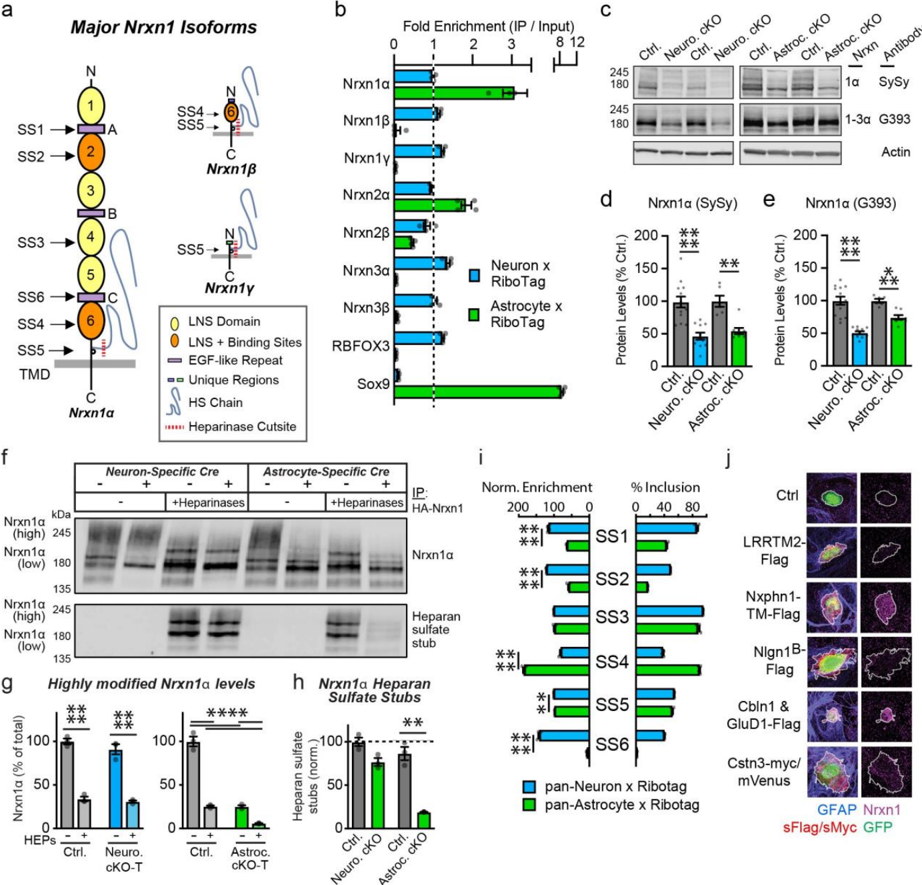
Figure 2 Astrocytes and neurons employ distinct molecular programs that involve Nrxn1. a, Cartoon of major Nrxn1 isoforms (i.e.,  ,  , and  ). The location of splice sites 1-6 (SS1-SS6) are indicated to the left. Bottom right, key of major structural features. b, Quantifications of major neurexin isoform transcripts via quantitative RT-PCR using either astrocyte- or neuron-specific ribosome-bound mRNAs (targeted using 'RiboTag') and compared to total RNA (input). c, Representative immunoblots of Nrxn1  or Nrxn1/2/3  using antibodies with different degrees of specificity. Total brain lysates from neuron- and astrocyte-specific Nrxn1 cKO mice and littermate controls were examined. d-e , Summary graphs of Nrxn1  ( d ) or pan-Nrxn1/2/3  ( e ) levels
Figure 2 Astrocytes and neurons employ distinct molecular programs that involve Nrxn1. a, Cartoon of major Nrxn1 isoforms (i.e.,  ,  , and  ). The location of splice sites 1-6 (SS1-SS6) are indicated to the left. Bottom right, key of major structural features. b, Quantifications of major neurexin isoform transcripts via quantitative RT-PCR using either astrocyte- or neuron-specific ribosome-bound mRNAs (targeted using 'RiboTag') and compared to total RNA (input). c, Representative immunoblots of Nrxn1  or Nrxn1/2/3  using antibodies with different degrees of specificity. Total brain lysates from neuron- and astrocyte-specific Nrxn1 cKO mice and littermate controls were examined. d-e , Summary graphs of Nrxn1  ( d ) or pan-Nrxn1/2/3  ( e ) levelsCC-BY-NC-ND · From the PDF
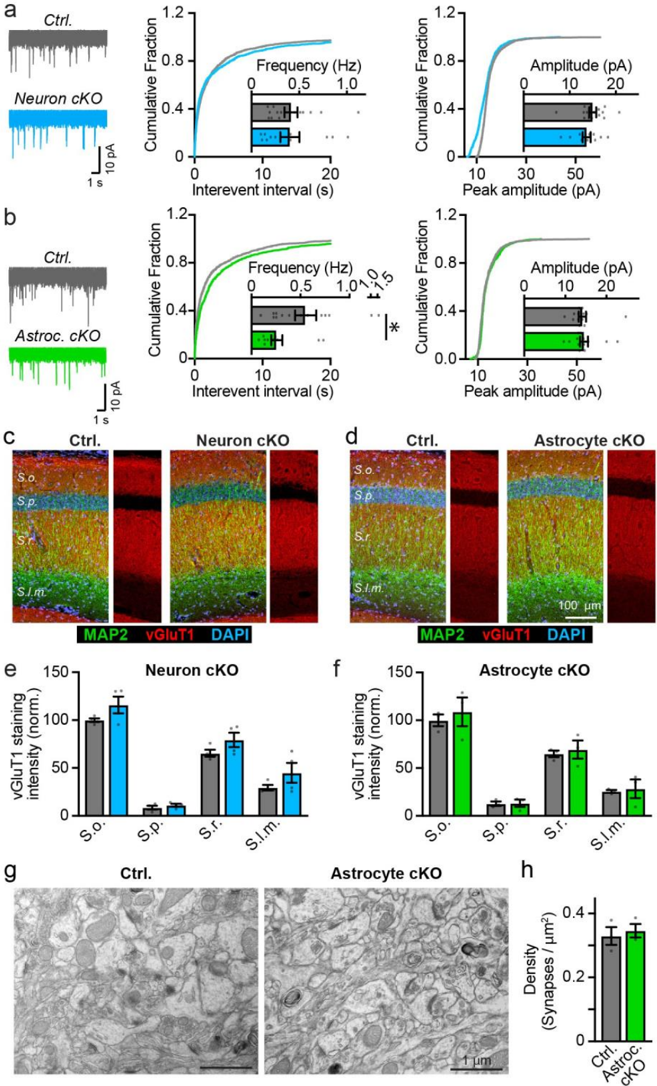
Figure 3 Deletion of Nrxn1 from astrocytes suppresses spontaneous excitatory synaptic transmission without altering synapse numbers. a-b, Astrocyte- but not neuron-specific deletion of Nrxn1 in cKO mice reduces the mEPSC frequency without changing the mEPSC amplitude. mEPSCs were recorded at P22-P26 in acute slices from CA1 pyramidal neurons
Figure 3 Deletion of Nrxn1 from astrocytes suppresses spontaneous excitatory synaptic transmission without altering synapse numbers. a-b, Astrocyte- but not neuron-specific deletion of Nrxn1 in cKO mice reduces the mEPSC frequency without changing the mEPSC amplitude. mEPSCs were recorded at P22-P26 in acute slices from CA1 pyramidal neuronsCC-BY-NC-ND · From the PDF
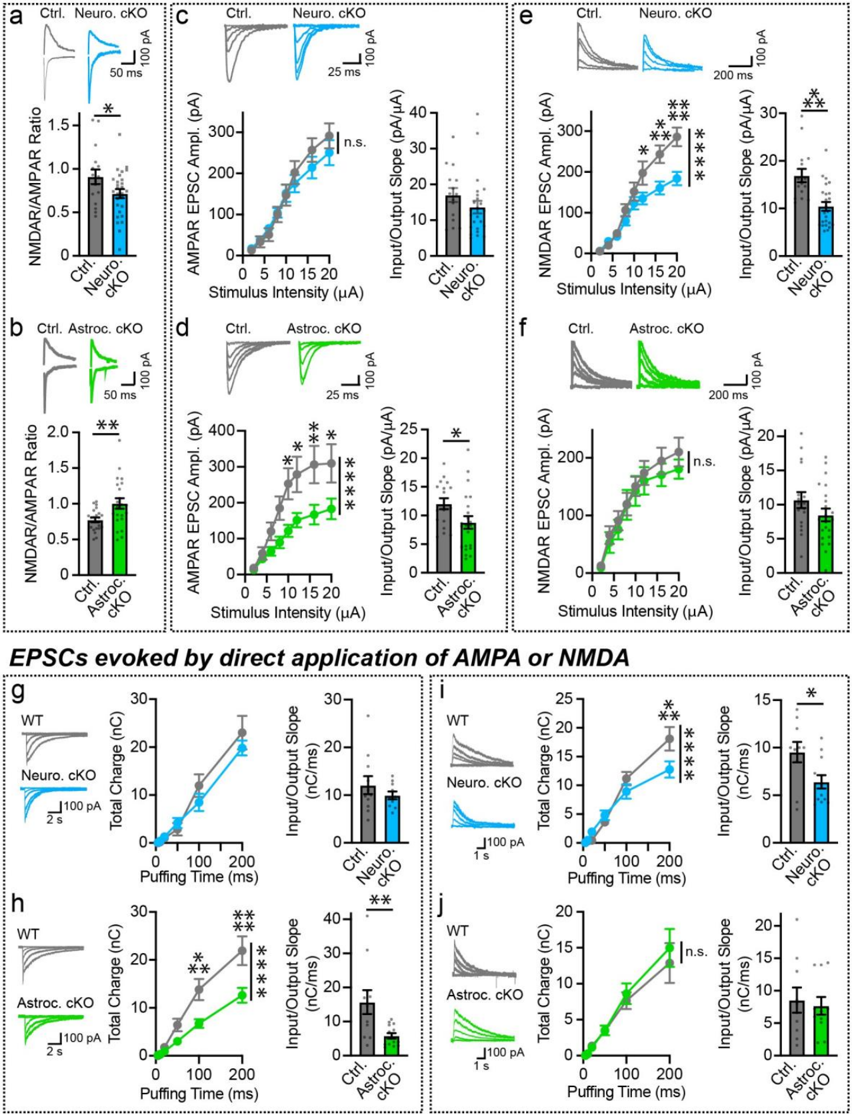
Figure 4 Neuronal and astrocytic Nrxn1 regulate distinct postsynaptic functions. a-f, EPSCs were evoked by electrical stimulation of the Schaffer collaterals, and recorded from hippocampal CA1 pyramidal neurons in acute slices from P22-P26 mice of the indicated genotypes. Sample
Figure 4 Neuronal and astrocytic Nrxn1 regulate distinct postsynaptic functions. a-f, EPSCs were evoked by electrical stimulation of the Schaffer collaterals, and recorded from hippocampal CA1 pyramidal neurons in acute slices from P22-P26 mice of the indicated genotypes. SampleCC-BY-NC-ND · From the PDF
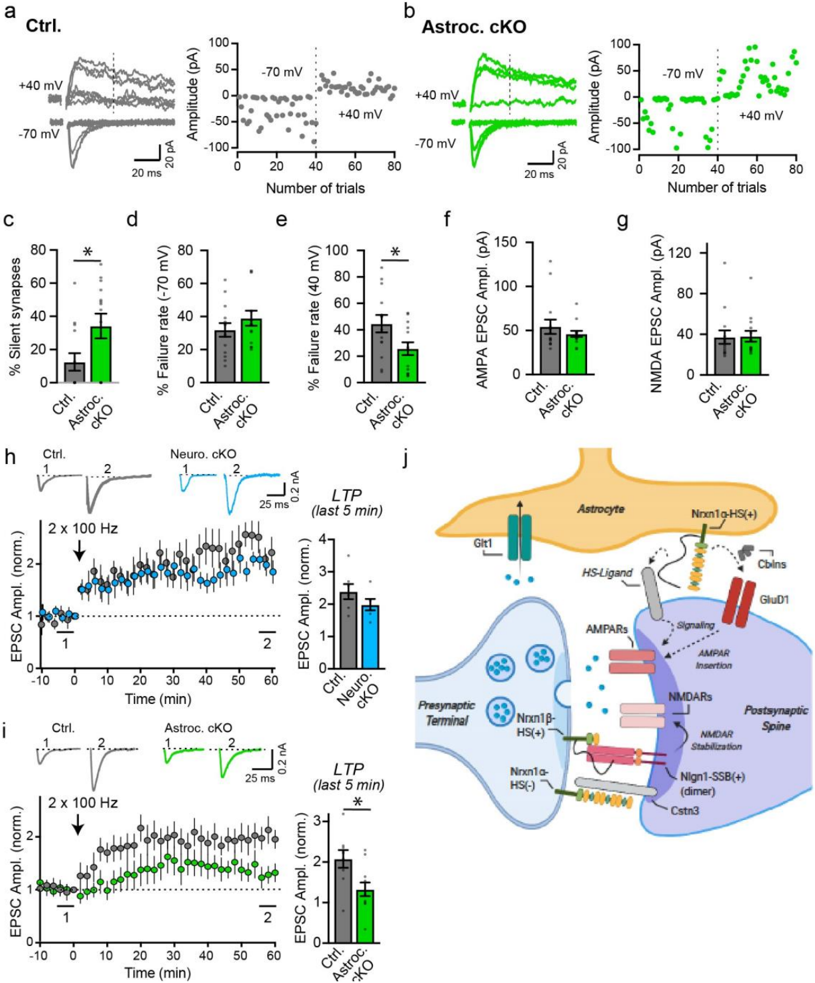
Figure 5 Astrocytes promote synapse unsilencing and long-term potentiation in a Nrxn1-
Figure 5 Astrocytes promote synapse unsilencing and long-term potentiation in a Nrxn1-CC-BY-NC-ND · From the PDF
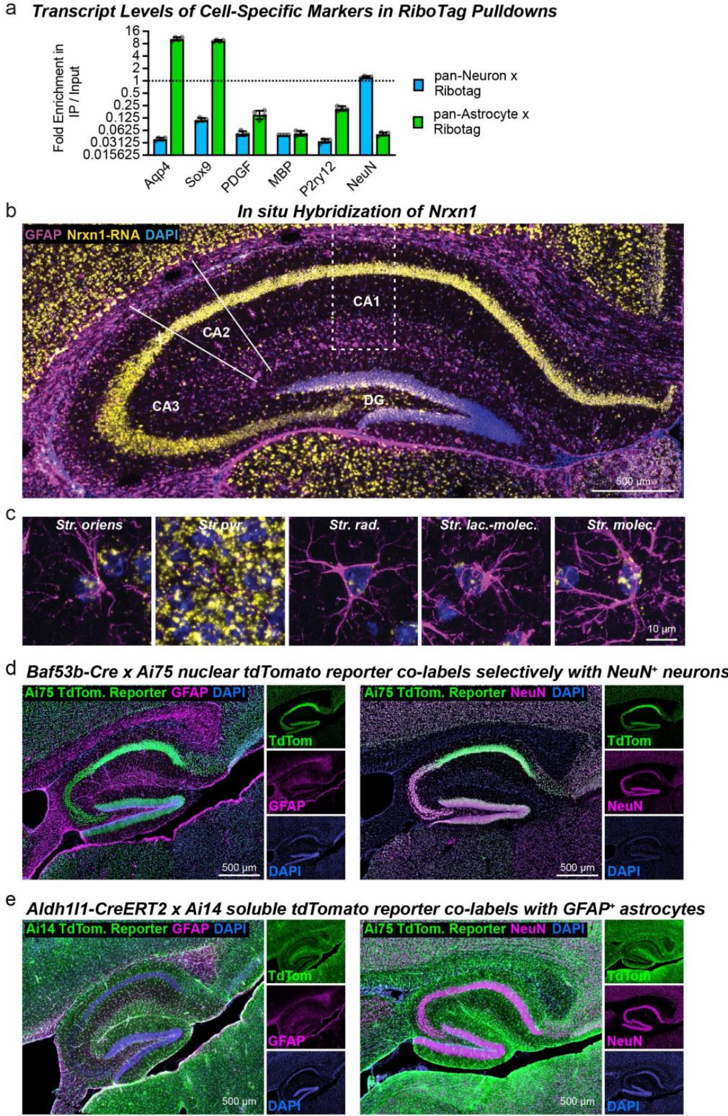
Extended Data Figure 1 | Confirmation of RiboTag pulldown purity by quantitative RTPCR (a), In situ hybridization for Nrxn1 in the hippocampus, and validation of neuron- and
Extended Data Figure 1 | Confirmation of RiboTag pulldown purity by quantitative RTPCR (a), In situ hybridization for Nrxn1 in the hippocampus, and validation of neuron- andCC-BY-NC-ND · From the PDF
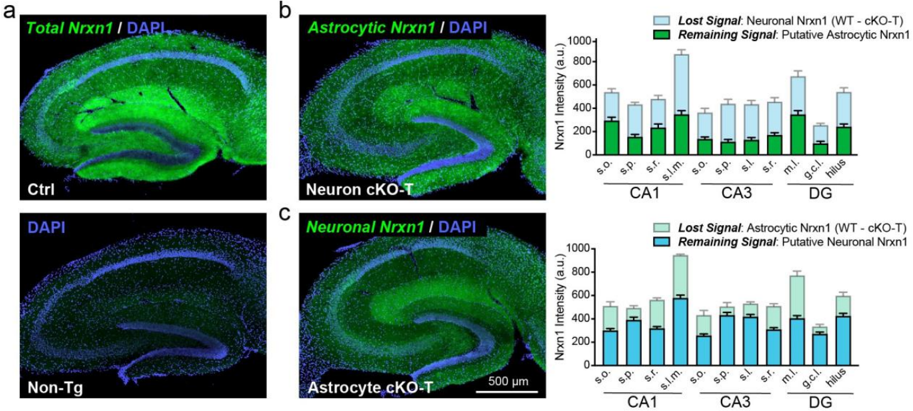
Extended Data Figure 2 | Astrocytes Contribute Significantly to Nrxn1 Levels in Hippocampal Neuropil (data complement those shown in Figure 1). a , Nrxn1 (green) was visualized using a dye-conjugated HA antibody in lightly fixed hippocampal slices (i.e. 15 minute post-fixation). Nuclei (blue) were stained using DAPI. Ctrl mice (top) have abundant and layerspecific labeling in the hippocampus, which is entirely absent in sections from non-transgenic mice (bottom). b-c , Representative images (left) and summary graphs (right) of HA-Nrxn1 levels detected in sections from Nrxn1 neuron cKO-T ( b ) and astrocyte cKO-T mice ( c ). Background was subtracted based on fluorescence levels detected in labelled non-transgenic sections. Nrxn1 levels were then quantified in major synaptic subfields of CA1 ( Stratum oriens or s.o ., Stratum pyramidale or s.p. , Stratum radiatum or s.r. , and Stratum lacunosum moleculare or s.l.m. ), CA3 ( s.o. , s.p. , Stratum lucidum or s.l. , and s.r. ), and the dentate gyrus (DG; molecular layer or m.l. , granule cell layer or g.c.l., and the hilus). Remaining Nrxn1 levels in neuron cKO-T ( b ) and astrocyte cKO-T mice ( c ) are considered to be putative astrocyte and neuron Nrxn1 signal, respectively. The loss of signal corresponding to the cKO-T mice is calculated by subtracting cKOT levels from WT levels. Data are means ± SEM. n = 8 sections / 3 WT mice, 11 sections / 4 neuron cKO mice ( b ); 9 sections / 3 WT mice, 18 sections / 6 astrocyte cKO mice ( c ).
Extended Data Figure 2 | Astrocytes Contribute Significantly to Nrxn1 Levels in Hippocampal Neuropil (data complement those shown in Figure 1). a , Nrxn1 (green) was visualized using a dye-conjugated HA antibody in lightly fixed hippocampal slices (i.e. 15 minute post-fixation). Nuclei (blue) were stained using DAPI. Ctrl mice (top) have abundant and layerspecific labeling in the hippocampus, which is entirely absent in sections from non-transgenic mice (bottom). b-c , Representative images (left) and summary graphs (right) of HA-Nrxn1 levels detected in sections from Nrxn1 neuron cKO-T ( b ) and astrocyte cKO-T mice ( c ). Background was subtracted based on fluorescence levels detected in labelled non-transgenic sections. Nrxn1 levels were then quantified in major synaptic subfields of CA1 ( Stratum oriens or s.o ., Stratum pyramidale or s.p. , Stratum radiatum or s.r. , and Stratum lacunosum moleculare or s.l.m. ), CA3 ( s.o. , s.p. , Stratum lucidum or s.l. , and s.r. ), and the dentate gyrus (DG; molecular layer or m.l. , granule cell layer or g.c.l., and the hilus). Remaining Nrxn1 levels in neuron cKO-T ( b ) and astrocyte cKO-T mice ( c ) are considered to be putative astrocyte and neuron Nrxn1 signal, respectively. The loss of signal corresponding to the cKO-T mice is calculated by subtracting cKOT levels from WT levels. Data are means ± SEM. n = 8 sections / 3 WT mice, 11 sections / 4 neuron cKO mice ( b ); 9 sections / 3 WT mice, 18 sections / 6 astrocyte cKO mice ( c ).CC-BY-NC-ND · From the PDF
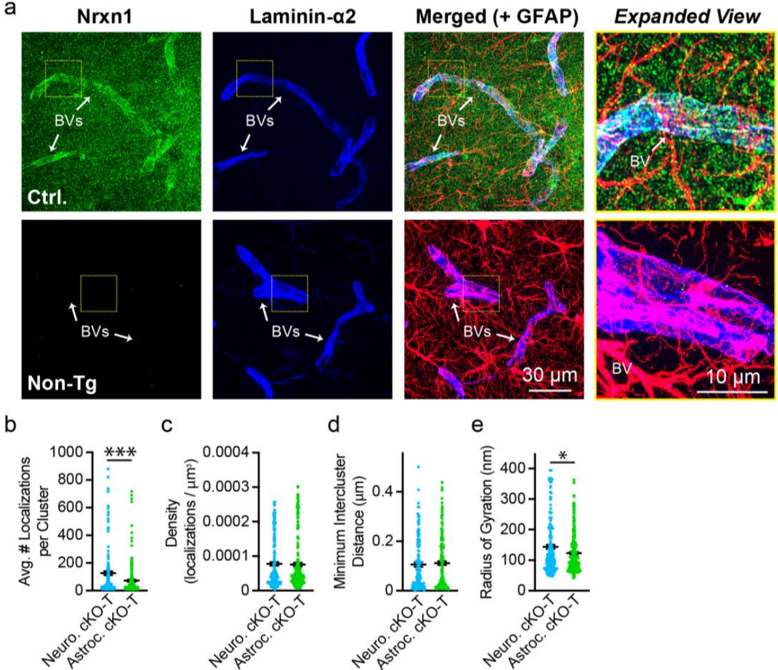
Extended Data Figure 3 | Control stains for Nrxn1 labeling of blood vessels (BVs) (a) and comparison of Nrnx1 nanocluster properties in Nrxn1 neuron and astrocyte cKO-T mice (be; data complement those shown in figure 1). a , Representative images of Nrxn1 labeling in sections from HA-Nrxn1 cKI (i.e. Ctrl) and non-transgenic mice. Brains were lightly fixed (i.e. 15 minutes post-fixation) and stained for HA-Nrxn1 (green) with dye-conjugated primary antibody, GFAP (astrocytes, magenta), and laminin-alpha2 (blood vessels, blue). Yellow box, enlarged on right. b-e , Summary graphs comparing the properties of putative astrocytic Nrxn1 nanoclusters (found in neuron cKO-T mice) and presynaptic Nrxn1 nanoclusters (found in astrocyte cKO-T mice). Properties measured include the average number of localizations per Nrxn1 nanocluster ( b ), the density of localizations per Nrxn1 nanocluster ( c ), the minimum intercluster distance between Nrxn1 and Homer1 clusters ( d ), and Nrxn1 nanocluster size measured as the radius of gyration ( e ). Numerical data are means ± SEM. n = 190 synapses / 3 neuron cKO-T mice, 227 synapses / 3 astrocyte cKO-T mice ( b-c, e ) and 130 synapses / 3 neuron cKO-T mice, 190 synapses / 3 astrocyte
Extended Data Figure 3 | Control stains for Nrxn1 labeling of blood vessels (BVs) (a) and comparison of Nrnx1 nanocluster properties in Nrxn1 neuron and astrocyte cKO-T mice (be; data complement those shown in figure 1). a , Representative images of Nrxn1 labeling in sections from HA-Nrxn1 cKI (i.e. Ctrl) and non-transgenic mice. Brains were lightly fixed (i.e. 15 minutes post-fixation) and stained for HA-Nrxn1 (green) with dye-conjugated primary antibody, GFAP (astrocytes, magenta), and laminin-alpha2 (blood vessels, blue). Yellow box, enlarged on right. b-e , Summary graphs comparing the properties of putative astrocytic Nrxn1 nanoclusters (found in neuron cKO-T mice) and presynaptic Nrxn1 nanoclusters (found in astrocyte cKO-T mice). Properties measured include the average number of localizations per Nrxn1 nanocluster ( b ), the density of localizations per Nrxn1 nanocluster ( c ), the minimum intercluster distance between Nrxn1 and Homer1 clusters ( d ), and Nrxn1 nanocluster size measured as the radius of gyration ( e ). Numerical data are means ± SEM. n = 190 synapses / 3 neuron cKO-T mice, 227 synapses / 3 astrocyte cKO-T mice ( b-c, e ) and 130 synapses / 3 neuron cKO-T mice, 190 synapses / 3 astrocyteCC-BY-NC-ND · From the PDF
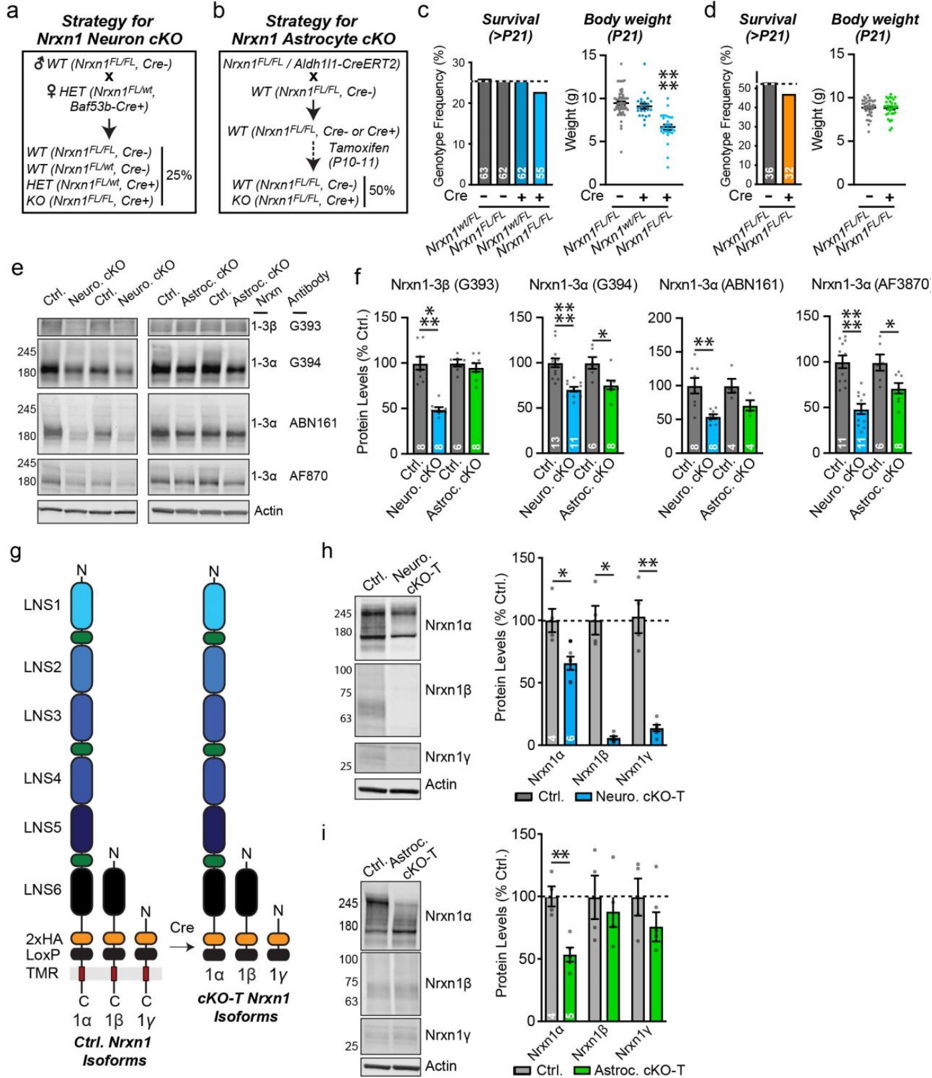
Extended Data Figure 4 | Generation of Cell-Specific Nrxn1 cKO Mice and Quantification of Neurexin Protein Levels (data complement those shown in figures 1-2). a-b, Breeding
Extended Data Figure 4 | Generation of Cell-Specific Nrxn1 cKO Mice and Quantification of Neurexin Protein Levels (data complement those shown in figures 1-2). a-b, BreedingCC-BY-NC-ND · From the PDF
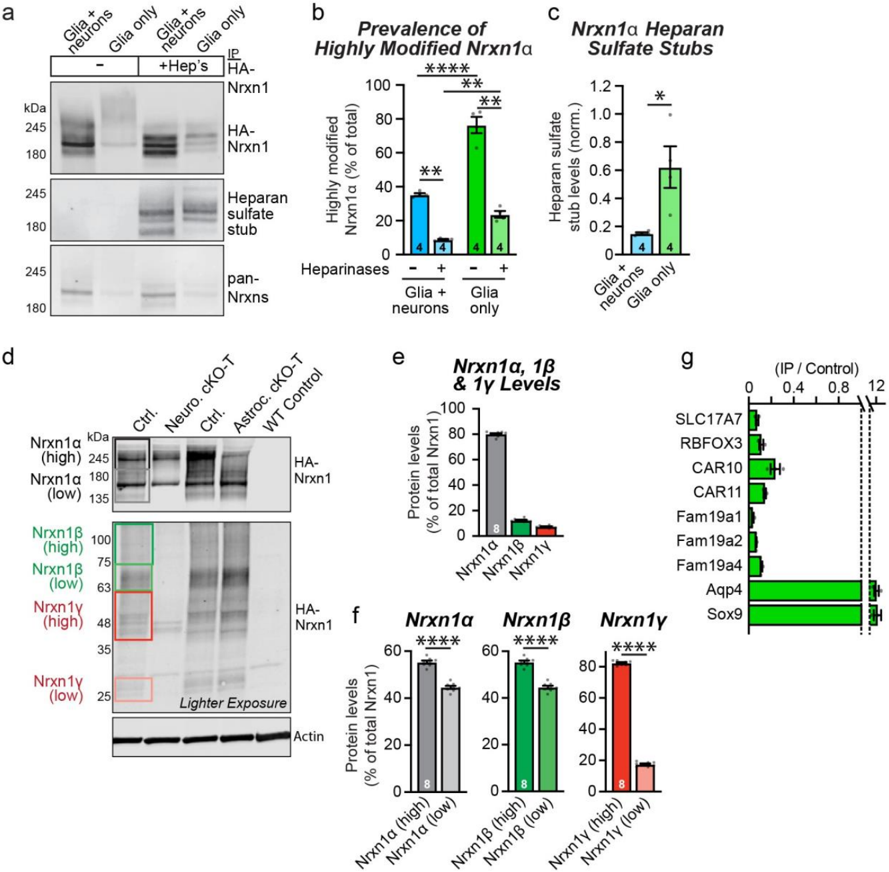
Extended Data Figure 5 | Astrocytic Nrxn1 is Preferentially Modified by Heparan Sulfate ( data complement those shown in figure 2). a-c, Nrxn1α is expressed primarily as a heparansulfate proteoglycan in cultured astrocytes, whereas Nrxn1α is present in cultured neurons mostly without the heparan-sulfate modification. Nrxn1 was immunoprecipitated at DIV14-16 from cultures of glia and neurons, or of glia alone, that were obtained from Nrxn1 HA-knockin mice. Immunoprecipitates were analyzed by immunoblotting without or with treatment with heparinases that cleave heparan-sulfate modifications, exposing a heparan-sulfate stub that can be visualized by an antibody (left, representative immunoblots; right, relative levels of heparan-sulfate stubs normalized for total Nrxn1α levels). Quantification of the amounts of Nrxn1α that are highly modified based on their apparent molecular weight as analyzed by immunoblotting of Nrxn1α
Extended Data Figure 5 | Astrocytic Nrxn1 is Preferentially Modified by Heparan Sulfate ( data complement those shown in figure 2). a-c, Nrxn1α is expressed primarily as a heparansulfate proteoglycan in cultured astrocytes, whereas Nrxn1α is present in cultured neurons mostly without the heparan-sulfate modification. Nrxn1 was immunoprecipitated at DIV14-16 from cultures of glia and neurons, or of glia alone, that were obtained from Nrxn1 HA-knockin mice. Immunoprecipitates were analyzed by immunoblotting without or with treatment with heparinases that cleave heparan-sulfate modifications, exposing a heparan-sulfate stub that can be visualized by an antibody (left, representative immunoblots; right, relative levels of heparan-sulfate stubs normalized for total Nrxn1α levels). Quantification of the amounts of Nrxn1α that are highly modified based on their apparent molecular weight as analyzed by immunoblotting of Nrxn1αCC-BY-NC-ND · From the PDF
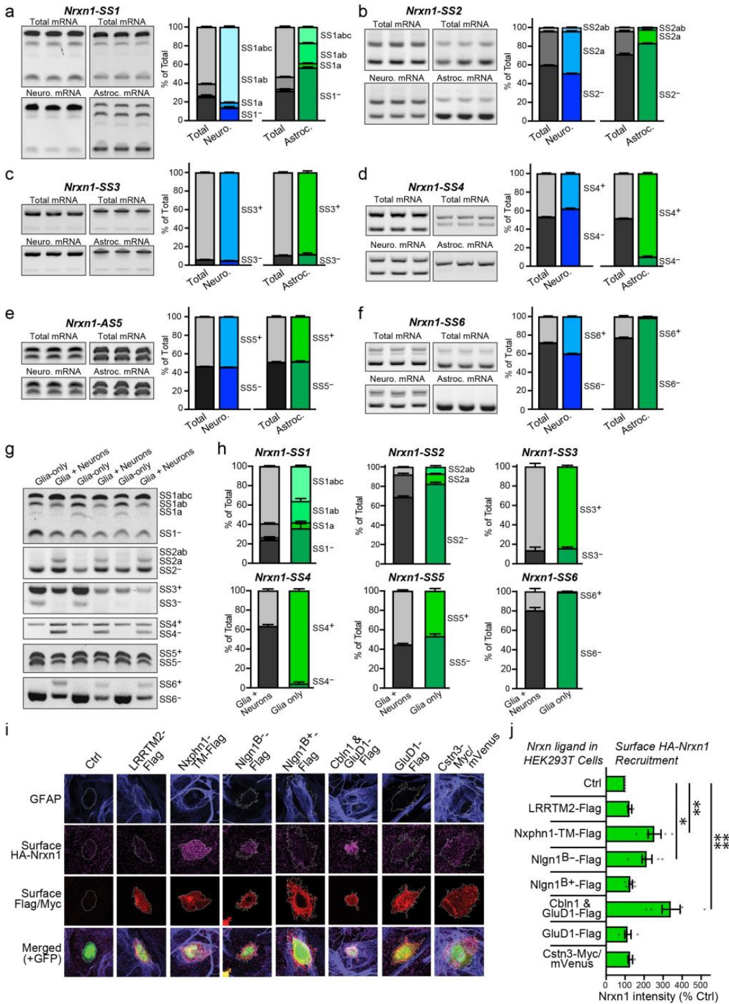
Extended Data Figure 6 | Nrxn1 alternative splicing differs between astrocytes and neurons ( data complement those shown in figure 2). a-f, Comparison of Nrxn1 alternative splicing at SS1 to SS6 in neurons vs. astrocytes reveals profound differences. Translating mRNAs were immunoprecipitated from neurons or astrocytes using Cre-dependent RiboTag mice crossed with neuron- or astrocyte-specific Cre-driver mice. Alternative splicing was quantified using junctionflanking PCR. Each panel depicts a single site of alternative splicing (left, representative gel
Extended Data Figure 6 | Nrxn1 alternative splicing differs between astrocytes and neurons ( data complement those shown in figure 2). a-f, Comparison of Nrxn1 alternative splicing at SS1 to SS6 in neurons vs. astrocytes reveals profound differences. Translating mRNAs were immunoprecipitated from neurons or astrocytes using Cre-dependent RiboTag mice crossed with neuron- or astrocyte-specific Cre-driver mice. Alternative splicing was quantified using junctionflanking PCR. Each panel depicts a single site of alternative splicing (left, representative gelCC-BY-NC-ND · From the PDF
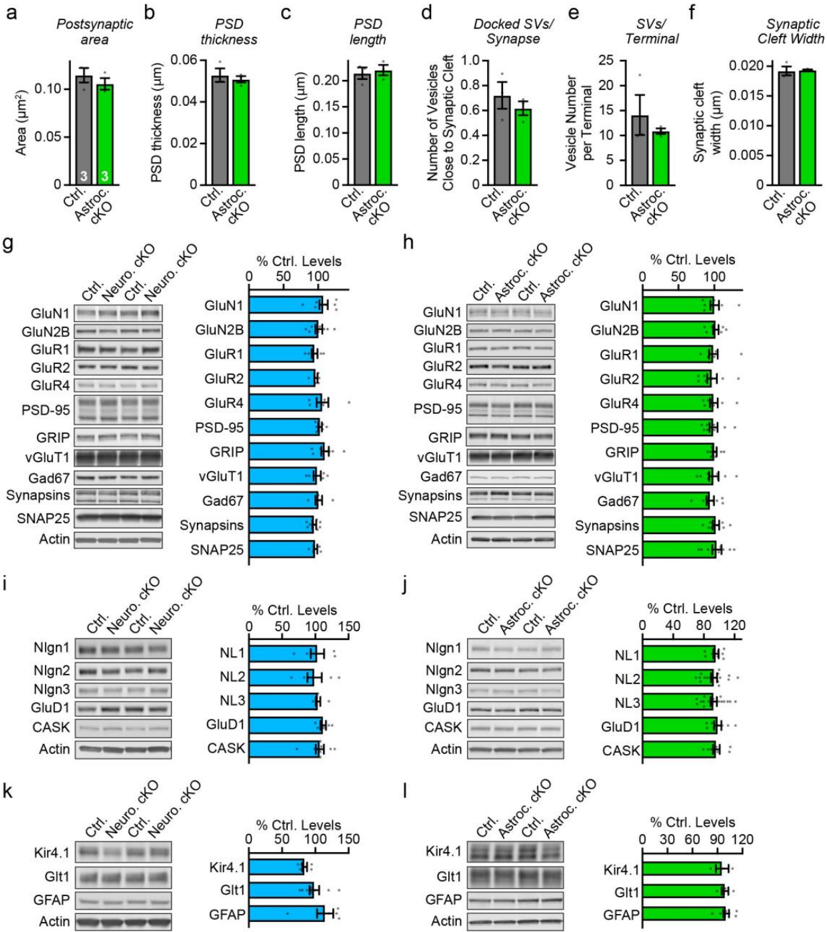
Extended Data Figure 7 | Ultrastructural parameters of excitatory synapses in the CA1 region analyzed in mice with an astrocyte-specific Nrxn1 deletion (a-f) and immunoblotting analyses of the hippocampus of mice with neuron- or astrocyte-specific Nrxn1 deletions (g-l; data complement those shown in figure 3). Ultrastructural data on excitatory synapses after astrocyte-specific deletion of Nrxn1, extending the data shown in Fig. 3g & 3h ( a , postsynaptic spine area; b , PSD thickness; c , PSD length; d , number of docked synaptic vesicles/synapse; e , number of synaptic vesicles per terminal; f , width of synaptic cleft). g-l, Immunoblotting analyses show that the neuron- ( g, i, k ) or astrocyte-specific ( h, j, l ) Nrxn1 deletions do not produce
Extended Data Figure 7 | Ultrastructural parameters of excitatory synapses in the CA1 region analyzed in mice with an astrocyte-specific Nrxn1 deletion (a-f) and immunoblotting analyses of the hippocampus of mice with neuron- or astrocyte-specific Nrxn1 deletions (g-l; data complement those shown in figure 3). Ultrastructural data on excitatory synapses after astrocyte-specific deletion of Nrxn1, extending the data shown in Fig. 3g & 3h ( a , postsynaptic spine area; b , PSD thickness; c , PSD length; d , number of docked synaptic vesicles/synapse; e , number of synaptic vesicles per terminal; f , width of synaptic cleft). g-l, Immunoblotting analyses show that the neuron- ( g, i, k ) or astrocyte-specific ( h, j, l ) Nrxn1 deletions do not produceCC-BY-NC-ND · From the PDF
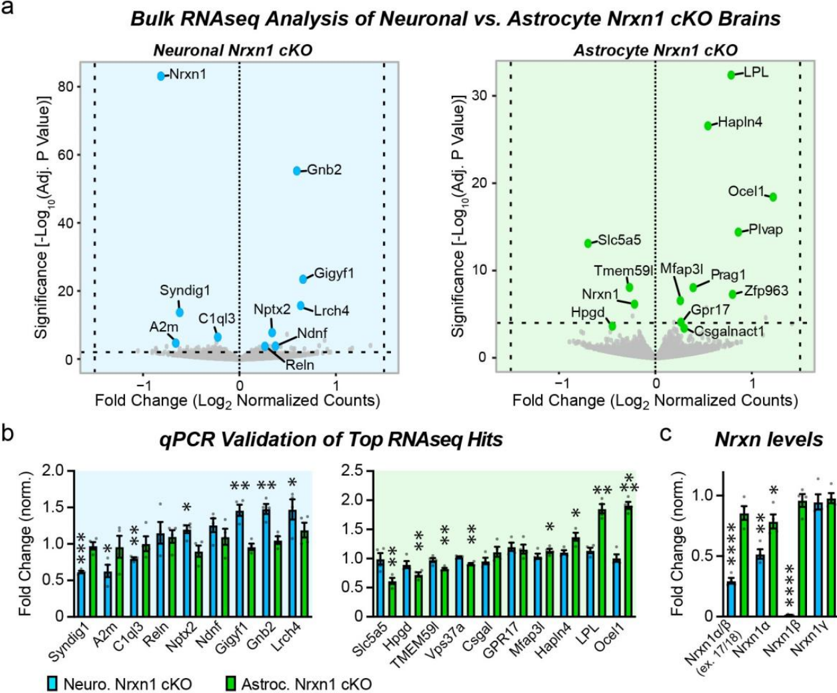
Extended Data Figure 8 | RNAseq reveals that neuronal and astrocytic Nrxn1 control distinct hippocampal transcriptional programs. a, Volcano plots of batch-normalized differential gene expression in the hippocampus of neuron- (left) and astrocyte-specific Nrxn1 cKOs (right). Bulk RNAseq analysis was performed at P26 in two batches with 2 control and cKO mice each (2 males and 2 females). b, qPCR validation of top differentially expressed genes emerging from RNAseq experiments (left, neuron-specific cKO; right, astrocyte-specific cKO; n = 4 per genotype). c, Plot of Nrxn1 mRNA levels as determined by RNAseq validating the quantitative RT-PCR data of Fig. 2 . Data in B and C are means ± SEM. Statistical significance was assessed with a two-tailed unpaired t-test to controls (B and C; for statistical analysis of RNAseq data, see Experimental Procedures), with * = p < 0.05; ** = p < 0.01; *** = p < 0.001; **** = p < 0.0001.
Extended Data Figure 8 | RNAseq reveals that neuronal and astrocytic Nrxn1 control distinct hippocampal transcriptional programs. a, Volcano plots of batch-normalized differential gene expression in the hippocampus of neuron- (left) and astrocyte-specific Nrxn1 cKOs (right). Bulk RNAseq analysis was performed at P26 in two batches with 2 control and cKO mice each (2 males and 2 females). b, qPCR validation of top differentially expressed genes emerging from RNAseq experiments (left, neuron-specific cKO; right, astrocyte-specific cKO; n = 4 per genotype). c, Plot of Nrxn1 mRNA levels as determined by RNAseq validating the quantitative RT-PCR data of Fig. 2 . Data in B and C are means ± SEM. Statistical significance was assessed with a two-tailed unpaired t-test to controls (B and C; for statistical analysis of RNAseq data, see Experimental Procedures), with * = p < 0.05; ** = p < 0.01; *** = p < 0.001; **** = p < 0.0001.CC-BY-NC-ND · From the PDF
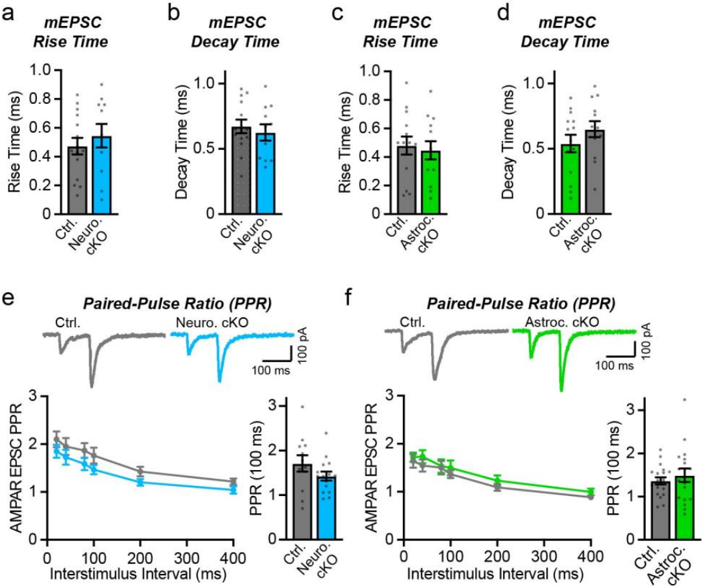
Extended Data Figure 9 | Neuron- or astrocyte-specific deletion of Nrxn1 has no effect on the kinetics of mEPSCs (a-d), and do not alter the paired-pulse ratio of evoked AMPARmediated EPSCs (e, f). a-b , mEPSC rise ( a ) and decay times ( b ) were not significantly altered by the neuron-specific deletion of Nrxn1. (c-d) Same as a-b , but for the astrocyte-specific deletion of Nrxn1. e-f, Neuron- and astrocyte-specific deletions of Nrxn1 do not change the paired-pulse ratios of Schaffer-collateral AMPAR-mediated EPSCs, suggesting that deletion of Nrxn1 in neurons has no effect on release probability (top, sample traces; left bottom, summary plot; right bottom, summary graph of the paired-pulse ratio at a 100 ms interstimulus interval). Numerical data are means ± SEM. n = 15 cells / 4 mice ctrl., 11 cells / 4 mice neuron cKO ( a-b ); 14 cells / 4 mice ctrl., 13 cells / 3 mice astrocyte cKO ( c-d ); 12 cells / 3 mice ctrl., 15 cells / 4 mice neuron cKO ( e ); 19 cells / 4 mice ctrl., 18 cells / 4 mice astrocyte cKO ( f ). Statistical significance was assessed with the two-tailed unpaired Student's t-test.
Extended Data Figure 9 | Neuron- or astrocyte-specific deletion of Nrxn1 has no effect on the kinetics of mEPSCs (a-d), and do not alter the paired-pulse ratio of evoked AMPARmediated EPSCs (e, f). a-b , mEPSC rise ( a ) and decay times ( b ) were not significantly altered by the neuron-specific deletion of Nrxn1. (c-d) Same as a-b , but for the astrocyte-specific deletion of Nrxn1. e-f, Neuron- and astrocyte-specific deletions of Nrxn1 do not change the paired-pulse ratios of Schaffer-collateral AMPAR-mediated EPSCs, suggesting that deletion of Nrxn1 in neurons has no effect on release probability (top, sample traces; left bottom, summary plot; right bottom, summary graph of the paired-pulse ratio at a 100 ms interstimulus interval). Numerical data are means ± SEM. n = 15 cells / 4 mice ctrl., 11 cells / 4 mice neuron cKO ( a-b ); 14 cells / 4 mice ctrl., 13 cells / 3 mice astrocyte cKO ( c-d ); 12 cells / 3 mice ctrl., 15 cells / 4 mice neuron cKO ( e ); 19 cells / 4 mice ctrl., 18 cells / 4 mice astrocyte cKO ( f ). Statistical significance was assessed with the two-tailed unpaired Student's t-test.CC-BY-NC-ND · From the PDF

Verification

Claims the paper makes

The claims and statistics of this paper haven’t been checked yet.

Run the check — free, no account needed. It reads the open-access text and checks the sources it cites.

A few free checks a day · papers already verified open instantly · results are public

Claims other papers make about this one

Each is checked against this paper’s own text: does it say what the citing paper says it does?

Self-check

Percentages, sums and reported differences re-computed from the paper’s own numbers.

The self-check needs the paper’s full text.

Citations

Cites

Show all 17 references

Research works printed but not linked: 68

  1. Ventura, R. & Harris, K. M . Three-dimensional relationships between hippocampal synapses and astrocytes. J. Neurosci. (1999). · DOI
  2. 10.1093/cercor/bhz343 · DOI
  3. 10.1002/glia.20946 · DOI
  4. 10.1038/nn.4043 · DOI · Paper page
  5. 10.1016/j.neuron.2017.09.056 · DOI · Paper page
  6. 2018, Astrocyte-Secreted Chordin-like 1 Drives Synapse Maturation and Limits Plasticity by Increasing Synaptic GluA2 AMPA Receptors, Neuron, 100, 1116, 10.1016/j.neuron.2018.09.043 · DOI
  7. 10.1016/j.cell.2004.12.020 · DOI · Paper page
  8. 10.1074/jbc.M112.380824 · DOI
  9. 2019, Hyperactivity with Disrupted Attention by Activation of an Astrocyte Synaptogenic Cue, Cell, 177, 1280, 10.1016/j.cell.2019.03.019 · DOI
  10. 10.1523/JNEUROSCI.3618-17.2018 · DOI
  11. 2020, Chemico-genetic discovery of astrocytic control of inhibition in vivo, Nature, 588, 296, 10.1038/s41586-020-2926-0 · DOI
  12. 10.1016/j.neuron.2018.09.040 · DOI · Paper page
  13. 10.1016/j.cell.2020.04.008 · DOI
  14. 10.1016/j.neures.2017.10.012 · DOI
  15. 10.1016/j.cell.2017.10.024 · DOI · Paper page
  16. 10.1073/pnas.90.14.6410 · DOI
  17. 1994, Conserved domain structure of beta-neurexins. Unusual cleaved signal sequences in receptor-like neuronal cell-surface proteins, J. Biol. Chem, 269, 11987, 10.1016/S0021-9258(17)32671-6 · DOI
  18. 10.1126/science.1621094 · DOI
  19. 10.1073/pnas.1621321114 · DOI
  20. 10.1073/pnas.1502849112 · DOI
  21. 10.1016/j.cell.2018.07.002 · DOI
  22. 2014, Targeted combinatorial alternative splicing generates brain region-specific repertoires of neurexins, Neuron, 84, 386, 10.1016/j.neuron.2014.09.011 · DOI
  23. 10.1016/0896-6273(95)90306-2 · DOI
  24. 10.1016/j.neuron.2015.06.028 · DOI
  25. 10.1016/j.celrep.2019.05.090 · DOI
  26. 10.1083/jcb.201812076 · DOI
  27. 10.1083/jcb.200105003 · DOI
  28. 10.1016/j.bbrc.2011.02.108 · DOI
  29. 10.1074/jbc.271.5.2676 · DOI
  30. 10.1007/s12311-010-0186-5 · DOI
  31. 10.1021/bi0614131 · DOI
  32. 10.1016/j.neuron.2017.08.001 · DOI
  33. 10.1016/j.cell.2010.04.035 · DOI · Paper page
  34. 10.1016/j.neuron.2013.07.016 · DOI
  35. 10.1016/0092-8674(95)90396-8 · DOI
  36. 10.1016/j.neuron.2009.12.012 · DOI
  37. 10.1523/JNEUROSCI.0470-10.2010 · DOI
  38. 10.1016/j.neuron.2017.04.011 · DOI
  39. 10.15252/embj.2019103208 · DOI
  40. 10.1016/j.cell.2015.06.056 · DOI
  41. Luo, F. , Sclip, A. , Merrill, S. & Südhof, T. C . Neurexins regulate presynaptic GABAB-receptors at central synapses. Nat. Commun. 12, (2021). · DOI
  42. 10.1016/j.cell.2013.05.060 · DOI
  43. 10.1016/j.neuron.2019.03.032 · DOI
  44. 10.1002/dvg.22866 · DOI
  45. 10.1038/s41593-020-0602-1 · DOI · Paper page
  46. 10.1016/j.neuron.2017.06.029 · DOI · Paper page
  47. 10.1038/s41467-019-13889-6 · DOI · Paper page
  48. 10.1002/glia.20415 · DOI
  49. 10.1016/j.neuron.2020.01.003 · DOI
  50. Montoliu-Gaya, L. et al. CA10 regulates neurexin heparan sulfate addition via a direct binding in the secretory pathway. EMBO Rep. 22, (2021). · DOI
  51. 10.1083/JCB.202004164 · DOI
  52. 10.1016/j.cell.2004.11.035 · DOI
  53. 10.1523/JNEUROSCI.3880-12.2013 · DOI
  54. 10.1016/0896-6273(95)90046-2 · DOI · Paper page
  55. 10.1038/375325a0 · DOI
  56. 10.1073/pnas.1506488112 · DOI
  57. 2020, LTP Induction Boosts Glutamate Spillover by Driving Withdrawal of Perisynaptic Astroglia, Neuron, 108, 919, 10.1016/j.neuron.2020.08.030 · DOI
  58. 10.1523/JNEUROSCI.2401-14.2014 · DOI · Paper page
  59. 10.1073/pnas.2431073100 · DOI · Paper page
  60. 10.1523/JNEUROSCI.5779-12.2013 · DOI
  61. 10.1016/j.neuron.2005.08.026 · DOI · Paper page
  62. 10.1083/jcb.85.3.890 · DOI
  63. 2013, Rapid single-step induction of functional neurons from human pluripotent stem cells, Neuron, 78, 785, 10.1016/j.neuron.2013.05.029 · DOI · Paper page
  64. 10.1073/pnas.0907143106 · DOI · Paper page
  65. 10.7554/eLife.22757.001 · DOI
  66. Mlodzianoski, M. J. , Juette, M. F. , Beane, G. L. & Bewersdorf, J . Experimental characterization of 3D localization techniques for particle-tracking and super-resolution microscopy. Opt. Express 17, 8264 (2009). · DOI
  67. 10.1038/nmeth.1211 · DOI
  68. Love, M. I. , Huber, W. & Anders, S . Moderated estimation of fold change and dispersion for RNA-seq data with DESeq2. Genome Biol. 15, (2014). · DOI · Paper page

Cited by

Metadata

Authors
Trotter, J. H., Dargaei, Z., Sclip, A., Essayan-Perez, S., Liakath-Ali, K., Raju, K., Nabet, A., Liu, X., Wöhr, M., & Südhof, T. C.
Publisher
openRxiv
Published
2020-08-21
Cited by
19
References
17
Type
Preprint

About these checks

Registry, retraction, Cites and statistics results are computed, not judged, with one exception: a printed reference that no index lists is read once by a model before it counts as a citation error. Claims are extracted by a model and kept only when their quote appears verbatim in the text; each cited source is then checked, with a model’s help, for whether it says what the claim relies on. Those verdicts can be wrong — read the claim’s quote and the cited source before relying on one.

Statistics and arithmetic are recomputed, not judged.

Confidence bands are shown only for fields calibrated on our annotated test set. None is calibrated yet, so no band is shown.

What counts as a claim ›How we measure confidence ›How we check this ›

Are you an author, or do you see a problem with this page? Request a review

Data sources

Bibliographic data: Semantic Scholar, OpenAlex, Crossref.

Contains information from the Semantic Scholar Academic Graph Datasets, made available under the ODC Attribution License (ODC-BY 1.0).

Semantic Scholar’s data is described in: Kinney, R., et al. (2023). The Semantic Scholar Open Data Platform. arXiv:2301.10140.