

The DOI matches its Crossref record; 80 of the 80 references it cites were found in a registry or an index.
Benchmarking AlphaFold for protein complex modeling reveals accuracy determinants
Open accessPreprint — published as 10.1002/pro.4379 · Paper page
Abstract
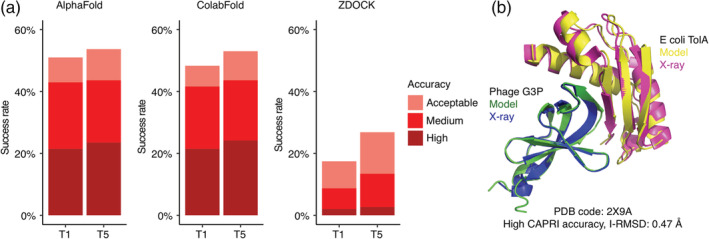
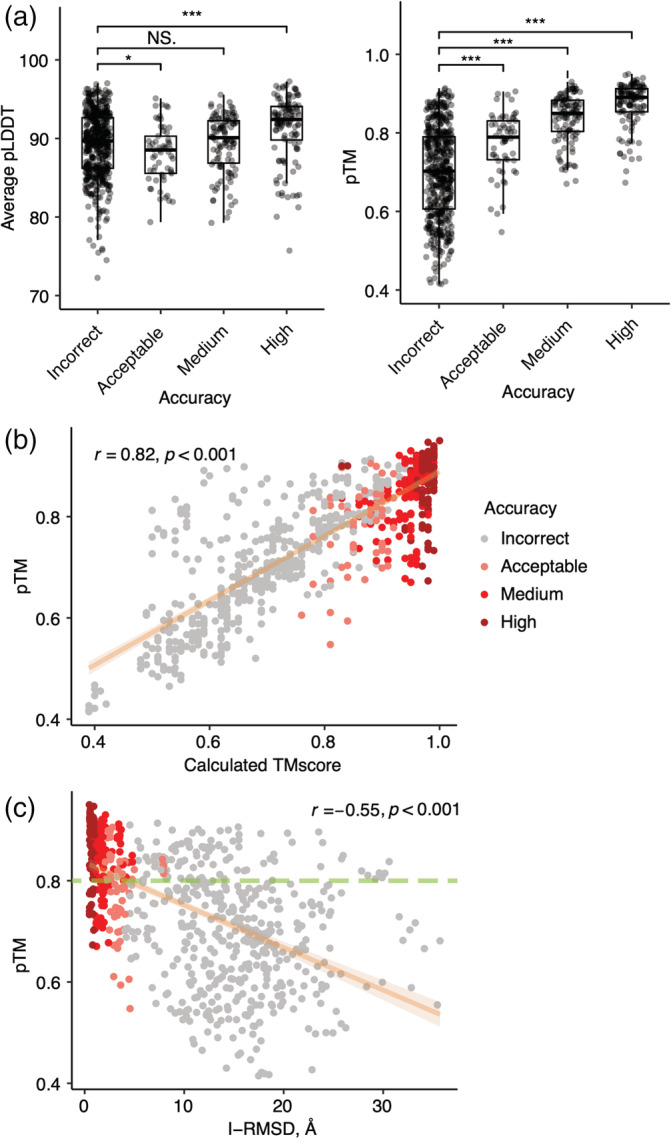
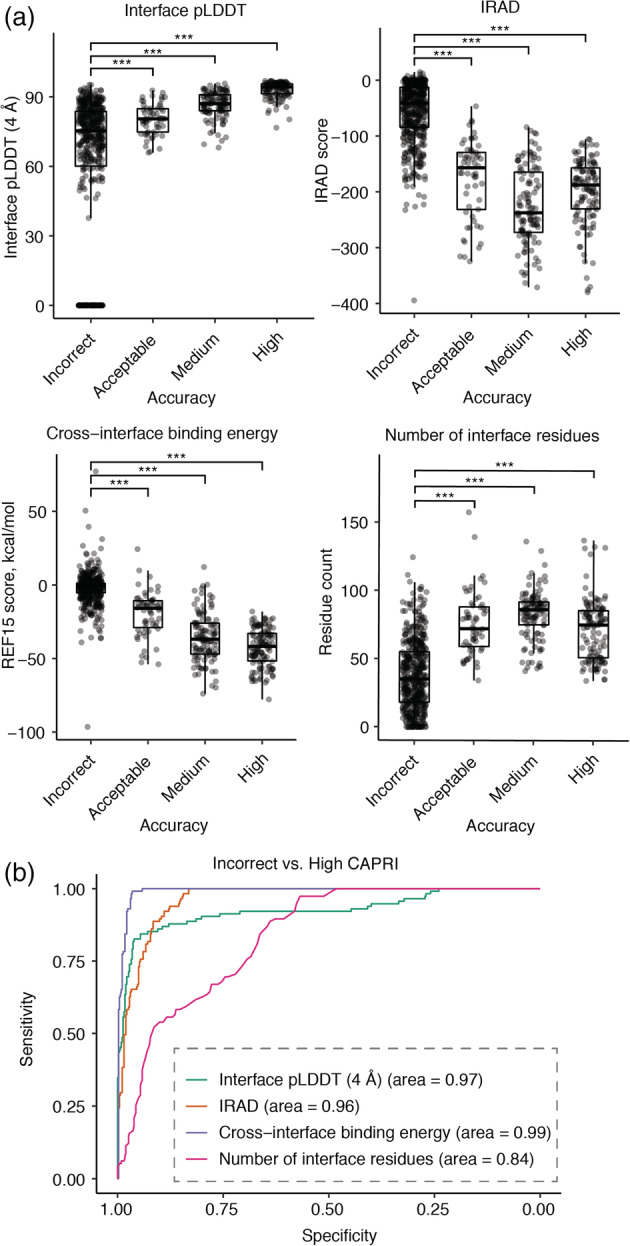
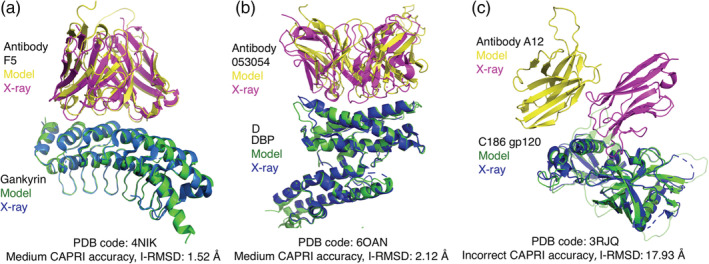
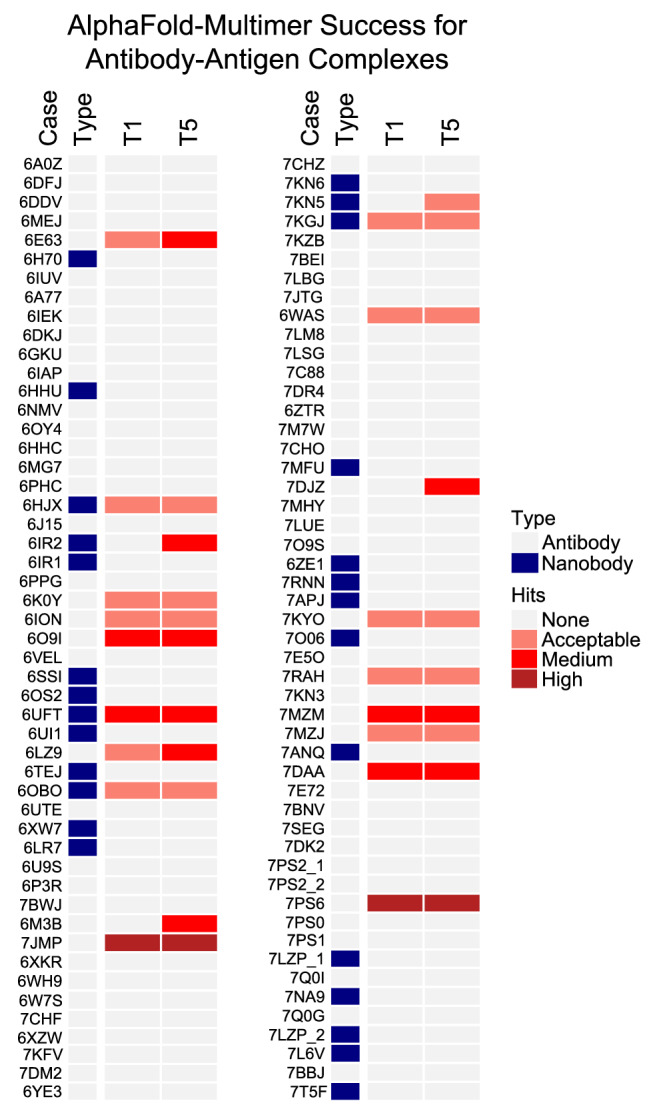
High resolution experimental structural determination of protein-protein interactions has led to valuable mechanistic insights, yet due to the massive number of interactions and experimental limitations there is a need for computational methods that can accurately model their structures. Here we explore the use of the recently developed deep learning method, AlphaFold, to predict structures of protein complexes from sequence. With a benchmark of 152 diverse heterodimeric protein complexes, multiple implementations and parameters of AlphaFold were tested for accuracy. Remarkably, many cases had highly accurate models generated as top-ranked predictions, greatly surpassing the performance of unbound protein-protein docking, whereas antibody-antigen docking was largely unsuccessful. While AlphaFold-generated accuracy predictions were able to discriminate near-native models, previously developed scoring protocols improved performance. Our study demonstrates that end-to-end deep learning can accurately model transient protein complexes, and identifies areas for improvement to guide future developments to reliably model any protein-protein interaction of interest.
Overview
The claims and statistics of this paper haven’t been checked yet.
Run the check — free, no account needed. It reads the open-access text and checks the sources it cites.
Integrity signals
Registry
Cites
Statistics
Figures
Verification
Claims the paper makes
The claims and statistics of this paper haven’t been checked yet.
Run the check — free, no account needed. It reads the open-access text and checks the sources it cites.
Self-check
Percentages, sums and reported differences re-computed from the paper’s own numbers.
The self-check needs the paper’s full text.
Citations
Cites
Highly accurate protein structure prediction with AlphaFold
Jumper, J., Evans, R., Pritzel, A., Green, T., Figurnov, M., Ronneberger, O., Tunyasuvunakool, K., Bates, R., Žídek, A., Potapenko, A., et al. (2021) · Nature · doi:10.1038/s41586-021-03819-2 · Cited by 43,764
Wickham, H. (2016) · Use R! · doi:10.1007/978-3-319-24277-4 · Cited by 34,873
BLAST+: architecture and applications
Camacho, C., Coulouris, G., Avagyan, V., Ma, N., Papadopoulos, J., Bealer, K., & Madden, T. L. (2009) · BMC Bioinformatics · doi:10.1186/1471-2105-10-421 · Cited by 22,074
pROC: an open-source package for R and S+ to analyze and compare ROC curves
Robin, X., Turck, N., Hainard, A., Tiberti, N., Lisacek, F., Sanchez, J.-C., & Müller, M. (2011) · BMC Bioinformatics · doi:10.1186/1471-2105-12-77 · Cited by 13,697
Cd-hit: Accelerated for clustering the next-generation sequencing data
Fu, L., Niu, B., Zhu, Z., Wu, S., & Li, W. (2012) · Bioinformatics · doi:10.1093/bioinformatics/bts565 · Cited by 11,175
Complex heatmaps reveal patterns and correlations in multidimensional genomic data
Gu, Z., Eils, R., & Schlesner, M. (2016) · Bioinformatics · doi:10.1093/bioinformatics/btw313 · Cited by 10,037
The Amber biomolecular simulation programs
Case, D. A., Cheatham, T. E., Darden, T., Gohlke, H., Luo, R., Merz, K. M., Onufriev, A., Simmerling, C., Wang, B., & Woods, R. J. (2005) · Journal of Computational Chemistry · doi:10.1002/jcc.20290 · Cited by 9,535
ColabFold - Making protein folding accessible to all
Mirdita, M., Schütze, K., Moriwaki, Y., Heo, L., Ovchinnikov, S., & Steinegger, M. (2021) · doi:10.1101/2021.08.15.456425 · Cited by 9,391
Varadi, M., Anyango, S., Deshpande, M., Nair, S., Natassia, C., Yordanova, G., Yuan, D., Stroe, O., Wood, G., Laydon, A., et al. (2022) · Nucleic Acids Research · doi:10.1093/nar/gkab1061 · Cited by 7,850
Bootstrap Methods and their Application
Davison, A. C., & Hinkley, D. V. (1997) · doi:10.1017/cbo9780511802843 · Cited by 7,350
Research works printed but not linked: 3
- 10.1126/science.abj8754 · DOI · Paper page
- Guest JD , Vreven T , Zhou J , Moal I , Jeliazkov JR , Gray JJ , et al. An expanded benchmark for antibody-antigen docking and affinity prediction reveals insights into antibody recognition determinants. Structure. 2021. · DOI
- 10.1002/pro.687 · DOI
Cited by
Sorted by citations
Items 301–334 of 334
Ackmann, J., Brüge, A., Gotina, L., Lim, S., Jahreis, K., Vollbrecht, A.-L., Kim, Y. K., Pae, A. N., Labus, J., & Ponimaskin, E. G. (2024) · Figshare · doi:10.6084/m9.figshare.26709143
Ackmann, J., Brüge, A., Gotina, L., Lim, S., Jahreis, K., Vollbrecht, A.-L., Kim, Y. K., Pae, A. N., Labus, J., & Ponimaskin, E. G. (2024) · Figshare · doi:10.6084/m9.figshare.26709146
Ackmann, J., Brüge, A., Gotina, L., Lim, S., Jahreis, K., Vollbrecht, A.-L., Kim, Y. K., Pae, A. N., Labus, J., & Ponimaskin, E. G. (2024) · Figshare · doi:10.6084/m9.figshare.25656151
Ackmann, J., Brüge, A., Gotina, L., Lim, S., Jahreis, K., Vollbrecht, A.-L., Kim, Y. K., Pae, A. N., Labus, J., & Ponimaskin, E. G. (2024) · Figshare · doi:10.6084/m9.figshare.26709125
Ackmann, J., Brüge, A., Gotina, L., Lim, S., Jahreis, K., Vollbrecht, A.-L., Kim, Y. K., Pae, A. N., Labus, J., & Ponimaskin, E. G. (2024) · Figshare · doi:10.6084/m9.figshare.26709152
Ackmann, J., Brüge, A., Gotina, L., Lim, S., Jahreis, K., Vollbrecht, A.-L., Kim, Y. K., Pae, A. N., Labus, J., & Ponimaskin, E. G. (2024) · Figshare · doi:10.6084/m9.figshare.26709140
Ackmann, J., Brüge, A., Gotina, L., Lim, S., Jahreis, K., Vollbrecht, A.-L., Kim, Y. K., Pae, A. N., Labus, J., & Ponimaskin, E. G. (2024) · Figshare · doi:10.6084/m9.figshare.26709128
Ackmann, J., Brüge, A., Gotina, L., Lim, S., Jahreis, K., Vollbrecht, A.-L., Kim, Y. K., Pae, A. N., Labus, J., & Ponimaskin, E. G. (2024) · Figshare · doi:10.6084/m9.figshare.26709116
Regulation of AP1 adaptor assembly by the bi-handed chaperone MEA1
Wan, C., Wu, J., Ouyang, Y., Puscher, H., Tian, Y., Li, S., Yin, Q., & Shen, J. (2026) · Nature Communications · doi:10.1038/s41467-026-68662-3
Loomis, J. F., Chandan, N. R., Burroughs, M., Abraham, S. T., Zhang, R., Cao, Y., Brody, M. J., Tall, G. G., & Smrcka, A. V. (2026) · Journal of Biological Chemistry · doi:10.1016/j.jbc.2026.111322
Barik, S. (2026) · International Journal of Molecular Sciences · doi:10.3390/ijms27052437
Li, Y., Zhang, X., Wang, Z., Lin, M., Wang, S., Zhang, C., Zhao, L., Zou, J., & Zhou, H. (2026) · Veterinary Microbiology · doi:10.1016/j.vetmic.2026.110982
Structural basis of serine protease inhibition by antibodies from biased Fab phage-display libraries
Anderson, K. J., Lee, M. S., Sevillano, N., Chen, G., Hornsby, M. J., Sidhu, S. S., & Craik, C. S. (2026) · Biological Chemistry · doi:10.64898/2026.03.12.711446
Structural prediction of protein assemblies with deep learning
Bret, H. (2023) · theses.fr (ABES) · doi:10.70675/b3849091zce01z4ab0z91efz2b71d9cc754d
Pachter, R., Kim, S., Xu, Y. C., Liu, G., Kim, S., & Goddard, W. A., III (2026) · European Biophysics Journal · doi:10.1007/s00249-026-01841-8 · Cited by 1
Jagannath, M., Sunderesan, A., Gupta, M. K., & Sudandiradoss, C. (2026) · Frontiers in Immunology · doi:10.3389/fimmu.2026.1869543
Integrating experimental and computational approaches for protein–protein interaction discovery
Rapti, A., Janssen, B. J. C., & Bonvin, A. M. J. J. (2026) · Nature Reviews Bioengineering · doi:10.1038/s44222-026-00464-0
Jaishwal, P., & Singh, S. P. (2026) · Biophysica · doi:10.3390/biophysica6040055
Yang, Y., & Déméné, H. (2026) · European Biophysics Journal · doi:10.1007/s00249-026-01854-3
Ensembles of in silico structures enable T cell peptide-MHC binding predictionPreprint
Lyudovyk, O., Levine, J., Pathil, M., Martis, S., Streltsov, A., Sethna, Z. M., Elhanati, Y., Balachandran, V., Morris, Q., & Greenbaum, B. D. (2026) · bioRxiv (Cold Spring Harbor Laboratory) · doi:10.64898/2026.07.14.738340
Marien, J., Sritharan, S., Caviglia, B., Versini, R., Auclair, L., Barraud, P., Tisné, C., Reguei, A., Murail, S., Leclerc, F., et al. (2026) · bioRxiv (Cold Spring Harbor Laboratory) · doi:10.64898/2026.07.24.740587
Benchmarking Deep Learning Predictions of Mutation-Induced Fold SwitchingPreprint
Felbinger, N. R., Carillo, K. J., Chen, Y., Orban, J. P., & Pierce, B. G. (2026) · bioRxiv (Cold Spring Harbor Laboratory) · doi:10.64898/2026.08.02.742283
Self-citationXiang, H., Liu, Y., Feng, J., & Wen, W. (2026) · bioRxiv (Cold Spring Harbor Laboratory) · doi:10.64898/2026.08.01.740968
Scaffold-Constrained Generative Design Overcomes Failure Modes in Computational Protein EngineeringPreprint
Pourbaghi, M., Elemento, O., & Bradbury, M. S. (2026) · bioRxiv (Cold Spring Harbor Laboratory) · doi:10.64898/2026.08.07.743551
Combining AI Structure Prediction and Integrative Modeling for Nanobody-Antigen Complexes
Sánchez-Marín, M., Giulini, M., & Bonvin, A. M. J. J. (2026) · Journal of Chemical Information and Modeling · doi:10.1021/acs.jcim.6c01301 · Cited by 2
Artificial Intelligence-Driven Multiscale Design of Protein-Based Materials
Zhou, X., Zhao, C., Zhang, Q., & Yao, Y. (2026) · Bioconjugate Chemistry · doi:10.1021/acs.bioconjchem.6c00309
Reconstructing hidden GPCR conformations and ligand binding modes through integrative DEER modeling.
Belyaeva, J., & Elgeti, M. (2026) · Structure · doi:10.1016/j.str.2026.09.003
BTNL2 As an Immunomodulatory Ligand: Delineating an Orphan Immune Checkpoint
Patidar, I., Aswthareddy, R., Lakshminarasimhan, A., & Idicula‐Thomas, S. (2026) · Journal of Molecular Recognition · doi:10.1002/jmr.70047
Perthold, J. W., Petrov, D., & Oostenbrink, C. (2026) · Journal of Chemical Information and Modeling · doi:10.1021/acs.jcim.6c01771
Narayanasamy, A., Drake, Z. C., Turzo, S. B. A., Rolland, A. D., Prell, J. S., Wysocki, V. H., & Lindert, S. (2026) · Analytical Chemistry · doi:10.1021/acs.analchem.6c01893 · Cited by 1
Suskiewicz, M. J. (2026) · Methods in molecular biology · doi:10.1007/978-1-0716-5571-9_2
Pathak, M. (2026) · European Journal of Medicinal Chemistry · doi:10.1016/j.ejmech.2026.119442 · Cited by 1
Liu, J., Li, Y., Zhan, F., Deng, M., Wang, Y., & Wang, X. (2026) · International Journal of Molecular Sciences · doi:10.3390/ijms27219599
Metadata
- Authors
- Yin, R., Feng, B. Y., Varshney, A., & Pierce, B. G.
- Affiliations
- Institute for Bioscience and Biotechnology Research (US)
- University of Maryland, College Park (US)
- University of Maryland, Baltimore (US)
- Corresponding author
- Pierce, Brian G.
- Venue
- Protein Science
- Publisher
- openRxiv
- Published
- 2021-10-24
- Volume
- 31
- Issue
- 8
- Pages
- e4379-e4379
- ISSN
- 0961-8368 (ISSN-L)
- PMC
- PMC9278006
- OpenAlex
- W4285392187
- Cited by
- 335
- References
- 80
- Citations by year
- 2026: 47 · 2025: 67 · 2024: 111 · 2023: 90 · 2022: 19
- FWCI
- 23.42
- Type
- journal article
- Language
- en
- Open access
- hybrid
- doi.org
- Licence
- cc-by
- Locations
- Protein Science (publishedVersion, cc-by)
- bioRxiv (Cold Spring Harbor Laboratory) (acceptedVersion, cc-by-nd)
- PubMed Central (publishedVersion, cc-by)
- PubMed (publishedVersion)
- University Libraries (University of Maryland) (submittedVersion)
- Digital Repository at the University of Maryland (University of Maryland College Park)
- Funders
- National Institutes of Health (NIH-R01)
- National Institute of General Medical Sciences (R01GM126299, R35GM144083)
- Topics
- Life Sciences › Biochemistry, Genetics and Molecular Biology › Molecular Biology › Protein Structure and Dynamics
- Life Sciences › Biochemistry, Genetics and Molecular Biology › Molecular Biology › Machine Learning in Bioinformatics
- Life Sciences › Biochemistry, Genetics and Molecular Biology › Structural Biology › Enzyme Structure and Function
- Keywords
- AlphaFold, AlphaFold-Multimer, protein complex structure prediction, protein-protein interaction, immune complexes, protein-protein docking, benchmarking, multiple sequence alignment, deep learning
- MeSH terms
- Algorithms, Protein Binding, Protein Conformation, Proteins, Sequence Alignment, Molecular Docking Simulation
About these checks
Registry, retraction, Cites and statistics results are computed, not judged, with one exception: a printed reference that no index lists is read once by a model before it counts as a citation error. Claims are extracted by a model and kept only when their quote appears verbatim in the text; each cited source is then checked, with a model’s help, for whether it says what the claim relies on. Those verdicts can be wrong — read the claim’s quote and the cited source before relying on one.
Statistics and arithmetic are recomputed, not judged.
Confidence bands are shown only for fields calibrated on our annotated test set. None is calibrated yet, so no band is shown.
What counts as a claim ›How we measure confidence ›How we check this ›
Are you an author, or do you see a problem with this page? Request a review
