PreprintCited by 35RNA and protein synthesis mechanismsGenomics and Chromatin DynamicsRNA Research and Splicing

The DOI matches its Crossref record; 1 of the 1 references it cites were found in a registry or an index.

False-Positive IRESes from Hoxa9 and other genes resulting from errors in mammalian 5’ UTR annotations

Open access
Akirtava, Christina, May, Gemma E., McManus, C. Joel·2022·Proceedings of the National Academy of Sciences

Preprint — published as 10.1073/pnas.2122170119

Abstract

Hyperconserved genomic sequences have great promise for understanding core biological processes. It has been recently proposed that scores of hyperconserved transcript leaders (hTLs) encode Internal Ribosome Entry Sites (IRESes) that drive cap-independent translation in part via interactions with ribosome expansion segments. However, the direct functional significance of such interactions has not yet been definitively demonstrated. We provide evidence that the putative IRESes previously reported in Hox gene hTLs are rarely included in transcript leaders. Instead, these regions function independently as transcriptional promoters. In addition, we find the proposed RNA structure of the putative Hoxa9 IRES is not conserved. Instead, sequences previously shown to be essential for putative IRES activity encode a hyperconserved transcription factor binding site (E-box) that contributes to its promoter activity by binding to the transcription factors USF1 and USF2 . Similar E-box sequences enhance the promoter activities of other putative Hoxa gene IRESes. Moreover, we provide evidence that the vast majority of hTLs with putative IRES activity overlap transcriptional promoters, enhancers, and 3’ splice sites that are most likely responsible for their reported IRES activities. These results argue strongly against recently reported widespread IRES-like activities from hTLs and contradict proposed interactions between ribosomal expansion segment ES9S and putative IRESes. Furthermore, our work underscores the importance of accurate transcript annotations, controls in bicistronic reporter assays, and the power of synthesizing publicly available data from multiple sources.

Overview

The claims and statistics of this paper haven’t been checked yet.

Run the check — free, no account needed. It reads the open-access text and checks the sources it cites.

A few free checks a day · papers already verified open instantly · results are public

Integrity signals

Registry

Crossref · 10.1101/2022.02.10.479744

Cites

1 of 1 references verified0 citation errors · 0 not checkable

Statistics

Figures

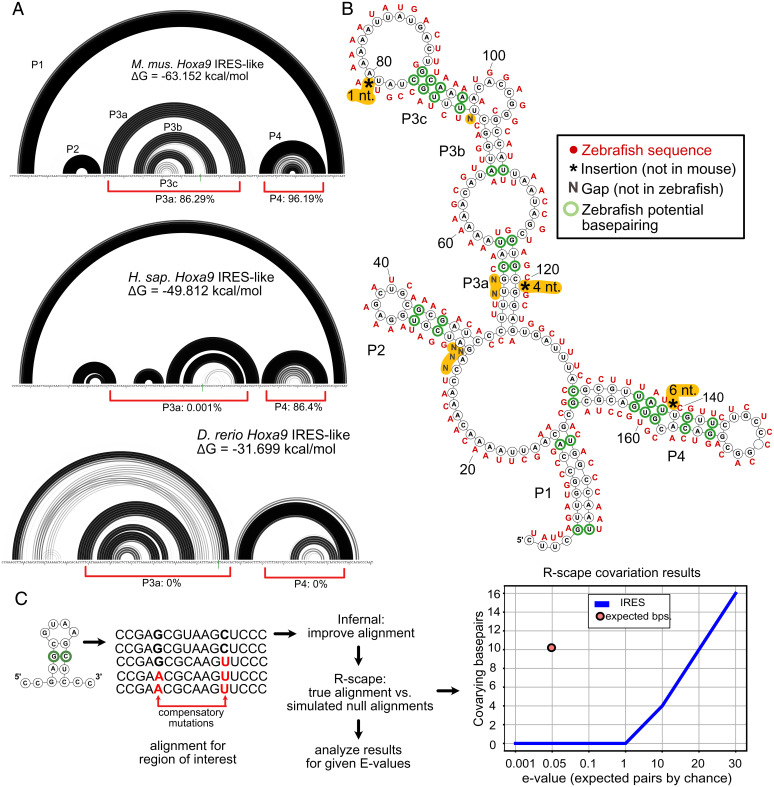
Fig. 1. The proposed structure of the putative Hoxa9 IRES element is not conserved. (A) Rainbow graphs depict the probability of base pairing for the Hoxa9 IRES-like region from mouse (Top), human (Middle), and zebrafish (Bottom). Pairing regions (stems) are numbered as in ref. 3. Base pairing probabilities were determined using RNAstructure. The mouse model is highly consistent with the published model (3). Red brackets indicate the frequency of P3a and P4 helix formation in 10,000 predicted suboptimal structures. Human and mouse Hoxa9 share P1 and P4, but lack P3, which was reported to be essential for IRES activity (3). Zebrafish Hoxa9 does not share any structural similarity with mammalian homologs, despite driving bicistronic reporter activity (3). (B) Secondary structure model of mouse Hoxa9 putative IRES region (3). Corresponding zebrafish sequences are shown in red. Most proposed base pairs are not conserved. Zebrafish has insertions (asterisks) and deletions (Ns) in the critical P3 and P4 elements. (C) Results of R-scape analysis of mutual information for the mouse Hoxa9 putative IRES region using alignments from 208 mammals and 23 other vertebrates. The number of covarying sites (y axis) is given for different e-value cutoffs (x axis). Although the alignment has the power to detect ∼10 compensatory pairs (red point; Dataset S1), covarying base pairs are less common than expected by chance in the IRES-like element (blue line).
Fig. 1. The proposed structure of the putative Hoxa9 IRES element is not conserved. (A) Rainbow graphs depict the probability of base pairing for the Hoxa9 IRES-like region from mouse (Top), human (Middle), and zebrafish (Bottom). Pairing regions (stems) are numbered as in ref. 3. Base pairing probabilities were determined using RNAstructure. The mouse model is highly consistent with the published model (3). Red brackets indicate the frequency of P3a and P4 helix formation in 10,000 predicted suboptimal structures. Human and mouse Hoxa9 share P1 and P4, but lack P3, which was reported to be essential for IRES activity (3). Zebrafish Hoxa9 does not share any structural similarity with mammalian homologs, despite driving bicistronic reporter activity (3). (B) Secondary structure model of mouse Hoxa9 putative IRES region (3). Corresponding zebrafish sequences are shown in red. Most proposed base pairs are not conserved. Zebrafish has insertions (asterisks) and deletions (Ns) in the critical P3 and P4 elements. (C) Results of R-scape analysis of mutual information for the mouse Hoxa9 putative IRES region using alignments from 208 mammals and 23 other vertebrates. The number of covarying sites (y axis) is given for different e-value cutoffs (x axis). Although the alignment has the power to detect ∼10 compensatory pairs (red point; Dataset S1), covarying base pairs are less common than expected by chance in the IRES-like element (blue line).CC BY · PubMed Central
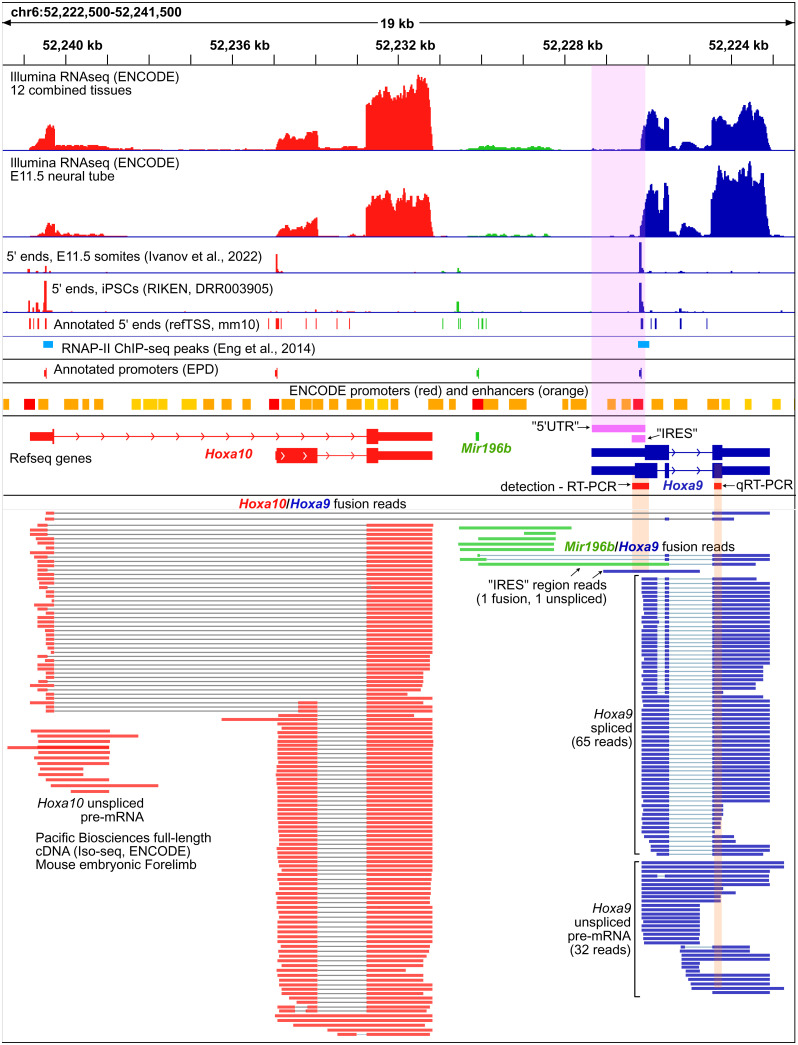
Fig. 2. The putative extended 5′ UTR and IRES regions of mouse Hoxa9 are not expressed at biologically meaningful levels. A genome browser view showing Refseq annotations of the mouse Hoxa10/Mir196b/Hoxa9 in red, green, and blue, respectively, is shown. The putative TL(5′ UTR) and IRES regions are shown in pink. Promoters from the EPD and the ENCODE project are shown above the Refseq gene models. Illumina short-read (Upper) and PacBio full-length (Lower) RNA-seq data from the ENCODE consortium show negligible levels of RNA over the putative 5′ UTR and IRES regions. Similarly, two 5′ CAGE-seq studies [Ivanov et al. (56) and Abugessaisa et al. (53)] show no TSSs at the putative 5′ UTR, and a strong TSS peak downstream of the putative IRES. ChIP-seq peaks show RNAPII is found immediately downstream of EPD Hoxa9 and Hoxa10 promoters in mouse embryonic forelimbs [Eng et al. (29)]. PacBio RNA-seq detects Hoxa9/a10 and Hoxa9/Mir196b fusion transcripts. Regions corresponding to the PCR amplicons used previously to detect (RT-PCR) the putative Hoxa9 IRES and quantify (RT-qPCR) Hoxa9 mRNA are shown in red. The Hoxa9 RT-qPCR amplicon used for expression and polysome analysis is not specific to spliced Hoxa9 mRNA, and can amplify fusion transcripts, unspliced transcripts, and truncated transcripts initiating at refTSS annotated start sites within Hoxa9 introns.
Fig. 2. The putative extended 5′ UTR and IRES regions of mouse Hoxa9 are not expressed at biologically meaningful levels. A genome browser view showing Refseq annotations of the mouse Hoxa10/Mir196b/Hoxa9 in red, green, and blue, respectively, is shown. The putative TL(5′ UTR) and IRES regions are shown in pink. Promoters from the EPD and the ENCODE project are shown above the Refseq gene models. Illumina short-read (Upper) and PacBio full-length (Lower) RNA-seq data from the ENCODE consortium show negligible levels of RNA over the putative 5′ UTR and IRES regions. Similarly, two 5′ CAGE-seq studies [Ivanov et al. (56) and Abugessaisa et al. (53)] show no TSSs at the putative 5′ UTR, and a strong TSS peak downstream of the putative IRES. ChIP-seq peaks show RNAPII is found immediately downstream of EPD Hoxa9 and Hoxa10 promoters in mouse embryonic forelimbs [Eng et al. (29)]. PacBio RNA-seq detects Hoxa9/a10 and Hoxa9/Mir196b fusion transcripts. Regions corresponding to the PCR amplicons used previously to detect (RT-PCR) the putative Hoxa9 IRES and quantify (RT-qPCR) Hoxa9 mRNA are shown in red. The Hoxa9 RT-qPCR amplicon used for expression and polysome analysis is not specific to spliced Hoxa9 mRNA, and can amplify fusion transcripts, unspliced transcripts, and truncated transcripts initiating at refTSS annotated start sites within Hoxa9 introns.CC BY · PubMed Central
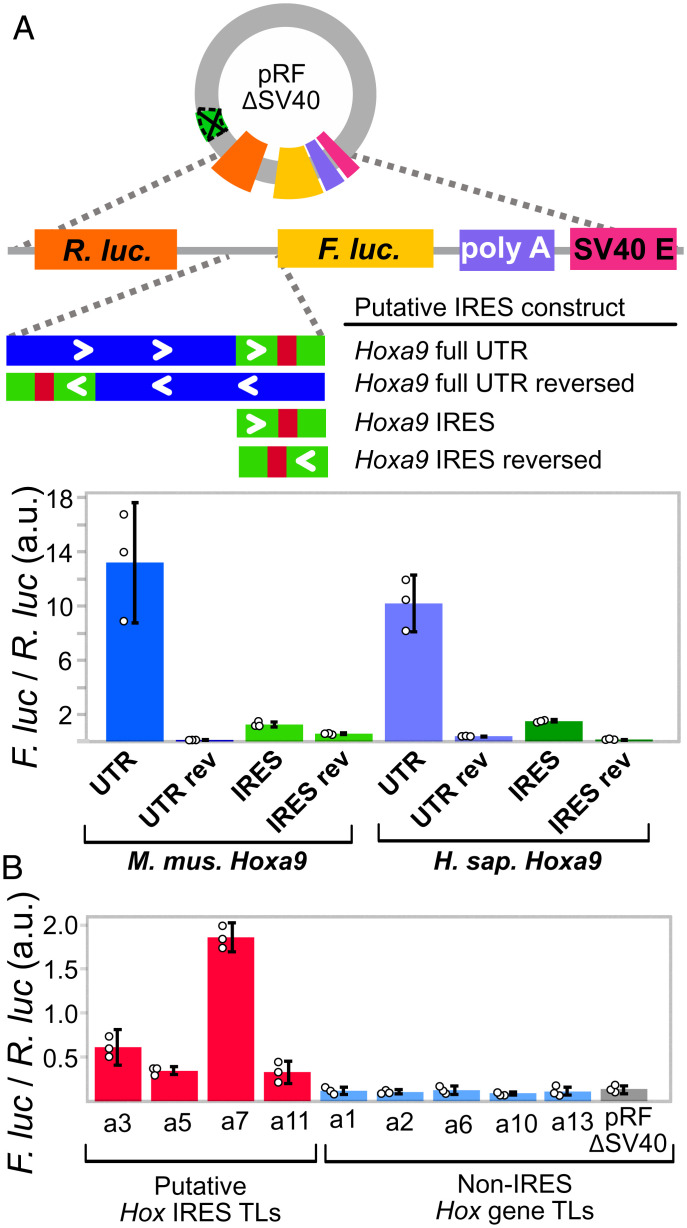
Fig. 3. The putative IRES-like domains of Hoxa9 and other Hox genes encode functional promoters. (A) The putative Hoxa9 IRES is a promoter. The SV40 promoter was deleted from the pRF bicistronic vector. Putative IRES regions were cloned between Renilla luciferase (Rluc) and Fluc and tested for activity in C3H10T1/2 cells. Bar graphs show the Fluc to Rluc ratio indicating promoter activity from mouse and human Hoxa9 regions. The extended UTR and IRES-like regions function as independent promoters in the forward orientation. (B) Putative IRES-like regions from other mouse Hoxa genes function as promoters. Annotated transcript leaders from each Hoxa gene were tested as in A. TLs containing putative IRES-like elements drove expression, while non-IRES TLs had background expression levels. Error bars show 95% CIs with n = 3.
Fig. 3. The putative IRES-like domains of Hoxa9 and other Hox genes encode functional promoters. (A) The putative Hoxa9 IRES is a promoter. The SV40 promoter was deleted from the pRF bicistronic vector. Putative IRES regions were cloned between Renilla luciferase (Rluc) and Fluc and tested for activity in C3H10T1/2 cells. Bar graphs show the Fluc to Rluc ratio indicating promoter activity from mouse and human Hoxa9 regions. The extended UTR and IRES-like regions function as independent promoters in the forward orientation. (B) Putative IRES-like regions from other mouse Hoxa genes function as promoters. Annotated transcript leaders from each Hoxa gene were tested as in A. TLs containing putative IRES-like elements drove expression, while non-IRES TLs had background expression levels. Error bars show 95% CIs with n = 3.CC BY · PubMed Central
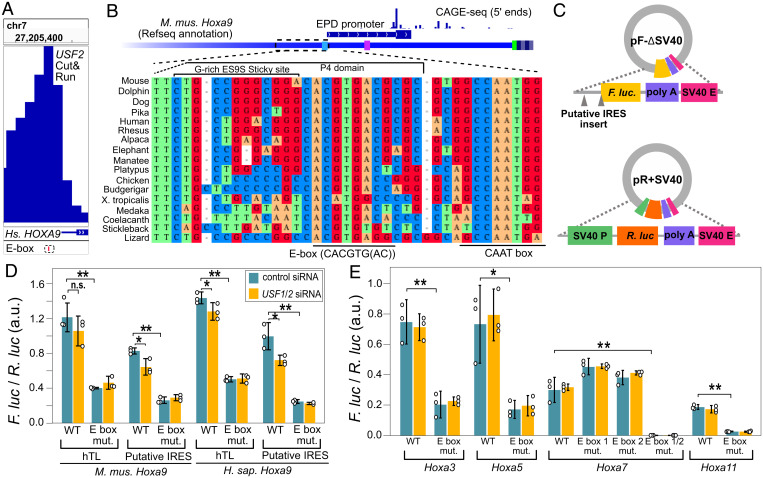
Fig. 4. Putative IRES-like elements in Hoxa genes contain functional E-boxes recognized by USF2. (A) Genome browser view of CUT&RUN sequencing data shows the binding location of human USF2 (37). The dashed box shows the location of a hyperconserved E-box motif (also see SI Appendix, Fig. S7). (B) Sequence alignment from diverse representative vertebrate genomes upstream of mouse Hoxa9, including the EPD promoter region. The diagram includes 5′ CAGE-seq data (53). The location of P4 domain sequences and the nonconserved G-rich ES9S interaction site are shown above, while the hyperconserved E-box and CAAT-box are noted below the alignment. The CAAT box and a TATA-like element are noted on the annotated Hoxa9 transcript leader in light blue and magenta, respectively (SI Appendix, Fig. S8). (C) The Fluc and Rluc reporter genes were moved to two independent plasmids to test the functions of E-box elements. (D) Mutation of the E-box motif from mouse and human Hoxa9 decreased expression in C3H10T1/2 cells. The siRNA codepletion of USF1 and USF2 decreased expression of wild-type (Welch’s one-tail t test, *P < 0.05; **P < 0.006), but not E-box mutant, reporters (n.s. signifies “not significant”). (E) Deletion of E-boxes from putative IRESes of Hoxa3, Hoxa5, Hoxa7, and Hoxa11 decrease promoter activity. Single E-box mutations show slight increases in Hoxa7 promoter activity, while the double mutation eliminated promoter function. Error bars show 95% CIs with n = 3.
Fig. 4. Putative IRES-like elements in Hoxa genes contain functional E-boxes recognized by USF2. (A) Genome browser view of CUT&RUN sequencing data shows the binding location of human USF2 (37). The dashed box shows the location of a hyperconserved E-box motif (also see SI Appendix, Fig. S7). (B) Sequence alignment from diverse representative vertebrate genomes upstream of mouse Hoxa9, including the EPD promoter region. The diagram includes 5′ CAGE-seq data (53). The location of P4 domain sequences and the nonconserved G-rich ES9S interaction site are shown above, while the hyperconserved E-box and CAAT-box are noted below the alignment. The CAAT box and a TATA-like element are noted on the annotated Hoxa9 transcript leader in light blue and magenta, respectively (SI Appendix, Fig. S8). (C) The Fluc and Rluc reporter genes were moved to two independent plasmids to test the functions of E-box elements. (D) Mutation of the E-box motif from mouse and human Hoxa9 decreased expression in C3H10T1/2 cells. The siRNA codepletion of USF1 and USF2 decreased expression of wild-type (Welch’s one-tail t test, *P < 0.05; **P < 0.006), but not E-box mutant, reporters (n.s. signifies “not significant”). (E) Deletion of E-boxes from putative IRESes of Hoxa3, Hoxa5, Hoxa7, and Hoxa11 decrease promoter activity. Single E-box mutations show slight increases in Hoxa7 promoter activity, while the double mutation eliminated promoter function. Error bars show 95% CIs with n = 3.CC BY · PubMed Central
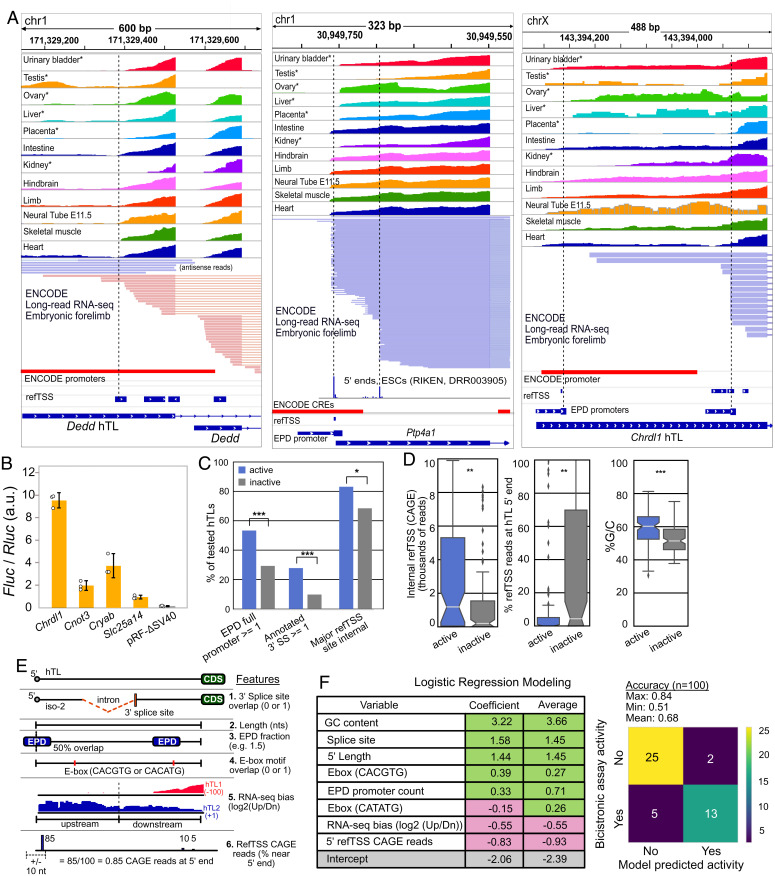
Fig. 5. Putative IRES-like hTLs can be explained by promoters and 3′ splice sites due to 5′ UTR annotation errors. (A) Examples of promoter overlap commonly seen in putative IRES-like hTLs. Short-read (Upper) and long-read (Lower) RNA-seq data show transcription often initiates internally, coinciding with annotated promoters (ENCODE and EPD) and TSSs (refTSS). (B) The hTLs from four putative mouse IRESes have promoter activity in pRF-ΔSV40 transfected C3H10T1/2 cells. Error bars show 95% CIs with n = 3. (C) The hTLs with putative IRES-like activity are enriched in EPD promoters, 3′ splice sites, and major internal TSS sites (Χ2 tests). (D) IRES-active hTLs have significantly more internal CAGE 5′ reads, a lower fraction of TSS reads at annotated 5′ ends, and higher G/C content than IRES-inactive hTLs (Wilcoxon rank-sum tests). (E) Features for logistic regression modeling. RNA-seq bias is the ratio of reads in upstream and downstream hTL halves across GWIPs-viz RNA-seq datasets. refTSS CAGE reads are the percentage of 5′ end reads mapped near the annotated TSS (data from ref. 28). (F) Logistic regression modeling of IRES-like and non-IRES hTLs. Features associated with internal promoters guanine-cytosine (GC content, EPD promoter count fraction, E-boxes) and splice sites are positively correlated with bicistronic reporter expression, while features associated with full-length TLs (CAGE reads at annotated 5′ ends and RNA-seq 5′ end bias) are negatively correlated with bicistronic reporter activity. One hundred models were generated, with an average accuracy of 68%; *, **, and *** denote P < 0.05, 0.01, and 0.001, respectively.
Fig. 5. Putative IRES-like hTLs can be explained by promoters and 3′ splice sites due to 5′ UTR annotation errors. (A) Examples of promoter overlap commonly seen in putative IRES-like hTLs. Short-read (Upper) and long-read (Lower) RNA-seq data show transcription often initiates internally, coinciding with annotated promoters (ENCODE and EPD) and TSSs (refTSS). (B) The hTLs from four putative mouse IRESes have promoter activity in pRF-ΔSV40 transfected C3H10T1/2 cells. Error bars show 95% CIs with n = 3. (C) The hTLs with putative IRES-like activity are enriched in EPD promoters, 3′ splice sites, and major internal TSS sites (Χ2 tests). (D) IRES-active hTLs have significantly more internal CAGE 5′ reads, a lower fraction of TSS reads at annotated 5′ ends, and higher G/C content than IRES-inactive hTLs (Wilcoxon rank-sum tests). (E) Features for logistic regression modeling. RNA-seq bias is the ratio of reads in upstream and downstream hTL halves across GWIPs-viz RNA-seq datasets. refTSS CAGE reads are the percentage of 5′ end reads mapped near the annotated TSS (data from ref. 28). (F) Logistic regression modeling of IRES-like and non-IRES hTLs. Features associated with internal promoters guanine-cytosine (GC content, EPD promoter count fraction, E-boxes) and splice sites are positively correlated with bicistronic reporter expression, while features associated with full-length TLs (CAGE reads at annotated 5′ ends and RNA-seq 5′ end bias) are negatively correlated with bicistronic reporter activity. One hundred models were generated, with an average accuracy of 68%; *, **, and *** denote P < 0.05, 0.01, and 0.001, respectively.CC BY · PubMed Central

Verification

Claims the paper makes

The claims and statistics of this paper haven’t been checked yet.

Run the check — free, no account needed. It reads the open-access text and checks the sources it cites.

A few free checks a day · papers already verified open instantly · results are public

Self-check

Percentages, sums and reported differences re-computed from the paper’s own numbers.

The self-check needs the paper’s full text.

Citations

Cites

Research works printed but not linked: 83

  1. 10.1126/science.aad9868 · DOI · Paper page
  2. 10.1146/annurev-biochem-013118-111042 · DOI
  3. 10.1038/nature14010 · DOI
  4. 10.1016/j.molcel.2020.10.023 · DOI
  5. K. Leppek , G. W. Byeon , K. Fujii , M. Barna , VELCRO-IP RNA-seq reveals ribosome expansion segment function in translation genome-wide. Cell Rep. 34, 108629 (2021). · DOI
  6. 10.1093/nar/gki958 · DOI
  7. 10.1007/s00018-016-2409-5 · DOI
  8. 10.1093/jmcb/mjz091 · DOI · Paper page
  9. 10.1128/MCB.22.21.7372-7384.2002 · DOI
  10. 10.1038/sj.onc.1206783 · DOI
  11. 10.1261/rna.5225204 · DOI
  12. 10.1073/pnas.0710650105 · DOI
  13. 10.1261/rna.2320506 · DOI
  14. 10.1101/cshperspect.a011569 · DOI
  15. 10.1093/nar/gks451 · DOI
  16. S. Weingarten-Gabbay , et al., Comparative genetics. Systematic discovery of cap-independent translation sequences in human and viral genomes. Science 351 (2016). · DOI · Paper page
  17. 10.1038/s41588-021-00830-1 · DOI
  18. E. Saccenti , M. H. W. B. Hendriks , A. K. Smilde , Corruption of the Pearson correlation coefficient by measurement error and its estimation, bias, and correction under different error models. Sci. Rep. 10, 438 (2020). · DOI
  19. 2012, So you want to know if your message has an IRES?, Wiley Interdiscip. Rev. RNA, 3, 697, 10.1002/wrna.1129 · DOI
  20. 10.1038/s41586-020-2876-6 · DOI · Paper page
  21. 10.1093/bioinformatics/btt509 · DOI
  22. 10.1038/nmeth.4066 · DOI
  23. 2020, Estimating the power of sequence covariation for detecting conserved RNA structure, Bioinformatics, 36, 3072, 10.1093/bioinformatics/btaa080 · DOI
  24. 10.1038/s41467-020-17206-4 · DOI
  25. 10.1083/jcb.201612160 · DOI
  26. 10.1038/nature11247 · DOI · Paper page
  27. S. N. Floor , J. A. Doudna , Tunable protein synthesis by transcript isoforms in human cells. Elife 5 (2016). · DOI · Paper page
  28. 2014, Genome-Wide Mapping of Chromatin State of Mouse Forelimbs, Open Access Bioinformatics, 6, 1
  29. 10.1101/gad.325142.119 · DOI
  30. 10.1242/dev.088492 · DOI
  31. 10.1093/bioinformatics/btr064 · DOI · Paper page
  32. 10.1101/gad.10.4.447 · DOI
  33. 10.1016/j.cell.2018.01.029 · DOI · Paper page
  34. 10.1111/j.1600-0749.2005.00262.x · DOI
  35. X. de Martin , R. Sodaei , G. Santpere , Mechanisms of Binding Specificity among bHLH Transcription Factors. Int. J. Mol. Sci. 22 (2021). · DOI
  36. H. Zhang , et al., Functional interrogation of HOXA9 regulome in MLLr leukemia via reporter-based CRISPR/Cas9 screen. Elife 9, e57858 (2020). · DOI
  37. 10.1074/jbc.M115.709386 · DOI
  38. 10.1038/nature13537 · DOI
  39. 2015, C-MYC transcriptionally amplifies SOX2 target genes to regulate self-renewal in multipotent otic progenitor cells, Stem Cell Reports, 4, 47, 10.1016/j.stemcr.2014.11.001 · DOI
  40. J. Shen , D. I. Scheffer , K. Y. Kwan , D. P. Corey , SHIELD: an integrative gene expression database for inner ear research. Database 2015, bav071 (2015). · DOI
  41. 10.1038/ncb3210 · DOI
  42. X. Tang , et al., Transcriptome regulation and chromatin occupancy by E2F3 and MYC in mice. Sci Data 3, 160008 (2016). · DOI
  43. 10.1158/0008-5472.CAN-16-0316 · DOI
  44. 10.1101/gr.226035.117 · DOI
  45. 10.1101/gr.260984.120 · DOI
  46. 10.1016/j.cell.2018.04.018 · DOI · Paper page
  47. 10.1016/J.MOLCEL.2019.04.002 · DOI
  48. A. Tesi , et al., An early Myc-dependent transcriptional program orchestrates cell growth during B-cell activation. EMBO Rep. 20, e47987 (2019). · DOI
  49. 10.1158/1078-0432.CCR-18-4140 · DOI
  50. 10.1038/s41586-020-2493-4 · DOI · Paper page
  51. 10.1093/nar/gku1111 · DOI
  52. 10.1016/j.jmb.2019.04.045 · DOI
  53. 10.1073/pnas.1413624111 · DOI
  54. 10.1101/gr.138776.112 · DOI
  55. I. P. Ivanov , et al., Evolutionarily conserved inhibitory uORFs sensitize Hox mRNA translation to start codon selection stringency. Proc. Natl. Acad. Sci. U. S. A. 119 (2022). · DOI
  56. 10.1093/nar/gkn188 · DOI
  57. 10.1016/j.cell.2011.03.028 · DOI
  58. 10.15252/embj.201593428 · DOI · Paper page
  59. 10.1016/j.cell.2013.03.012 · DOI
  60. C. M. Greco , et al., S-adenosyl-l-homocysteine hydrolase links methionine metabolism to the circadian clock and chromatin remodeling. Sci Adv 6 (2020). · DOI
  61. 10.1073/pnas.1612917113 · DOI
  62. 10.1101/gad.322198.118 · DOI
  63. 10.1038/s41590-019-0382-5 · DOI
  64. 10.1084/jem.20171704 · DOI
  65. 10.1038/ni.3694 · DOI
  66. 10.1038/384570a0 · DOI
  67. 10.1006/dbio.2000.9717 · DOI
  68. 10.1101/gad.850000 · DOI
  69. 10.1101/gad.11.14.1827 · DOI
  70. 10.1101/gad.1092303 · DOI
  71. 10.1016/S0092-8674(00)80451-1 · DOI
  72. 1996, Quantitative RT-PCR: limits and accuracy, Biotechniques, 21, 280, 10.2144/96212rr01 · DOI
  73. 2004, Pitfalls of quantitative real-time reverse-transcription polymerase chain reaction, J. Biomol. Tech, 15, 155
  74. 2012, Limits and Pitfalls of Sybr Green Detection in Quantitative Pcr, Secţiunea Genetică şi Biologie Moleculară, 13, 13
  75. A. V. Gopanenko , et al., Knockdown of the Ribosomal Protein eL38 in HEK293 Cells Changes the Translational Efficiency of Specific Genes. Int. J. Mol. Sci. 22 (2021). · DOI
  76. 2021, Structured elements drive extensive circular RNA translation, Mol. Cell, 81, 4300, 10.1016/j.molcel.2021.07.042 · DOI
  77. 10.1126/science.7536344 · DOI · Paper page
  78. 10.1016/S0378-1119(98)00014-6 · DOI
  79. 10.1128/MCB.7.10.3836 · DOI
  80. E. Rebboah , et al., Mapping and modeling the genomic basis of differential RNA isoform expression at single-cell resolution with LR-Split-seq. Genome Biol. 22, 286 (2021). · DOI · Paper page
  81. S. Y. Anvar , et al., Full-length mRNA sequencing uncovers a widespread coupling between transcription initiation and mRNA processing. Genome Biol. 19, 46 (2018). · DOI · Paper page
  82. 10.1093/nar/gkt1035 · DOI
  83. 10.1093/bioinformatics/btt128 · DOI · Paper page

Metadata

Authors
Akirtava, C., May, G. E., & McManus, C. J.
Affiliations
Carnegie Mellon University (US)
Corresponding author
McManus, C. Joel
Venue
Proceedings of the National Academy of Sciences
Publisher
openRxiv
Published
2022-02-10
Volume
119
Issue
36
Pages
e2122170119-e2122170119
ISSN
0027-8424 (ISSN-L)
OpenAlex
W4293484770
Cited by
35
References
1
Citations by year
2026: 9 · 2025: 8 · 2024: 7 · 2023: 8 · 2022: 2
FWCI
2.04
Type
journal article
Language
en
Open access
Licence
cc-by
Locations
  • Proceedings of the National Academy of Sciences (publishedVersion, cc-by)
  • bioRxiv (Cold Spring Harbor Laboratory) (acceptedVersion, cc-by-nc-nd)
  • PubMed Central (publishedVersion, cc-by)
  • PubMed (publishedVersion)
Funders
  • National Institutes of Health (NIH-R01)
  • National Institute of General Medical Sciences (R01GM121895)
Topics
  • Life Sciences › Biochemistry, Genetics and Molecular Biology › Molecular Biology › RNA and protein synthesis mechanisms
  • Life Sciences › Biochemistry, Genetics and Molecular Biology › Molecular Biology › Genomics and Chromatin Dynamics
  • Life Sciences › Biochemistry, Genetics and Molecular Biology › Molecular Biology › RNA Research and Splicing
Keywords
internal ribosome entry site, HOXA9, Hox genes, promoter activity, E-box, USF1, USF2, cap-independent translation, enhancers, 3' splice site
MeSH terms
Internal Ribosome Entry Sites, Animals, Binding Sites, Mammals, Promoter Regions, Genetic, Ribosomes, Transcription Factors, Protein Biosynthesis, Homeodomain Proteins, 5' Untranslated Regions

About these checks

Registry, retraction, Cites and statistics results are computed, not judged, with one exception: a printed reference that no index lists is read once by a model before it counts as a citation error. Claims are extracted by a model and kept only when their quote appears verbatim in the text; each cited source is then checked, with a model’s help, for whether it says what the claim relies on. Those verdicts can be wrong — read the claim’s quote and the cited source before relying on one.

Statistics and arithmetic are recomputed, not judged.

Confidence bands are shown only for fields calibrated on our annotated test set. None is calibrated yet, so no band is shown.

What counts as a claim ›How we measure confidence ›How we check this ›

Are you an author, or do you see a problem with this page? Request a review