Student or educator? Sign up with your school email and get 6 months of Pro free.
PreprintCited by 28Polysaccharides and Plant Cell WallsCellular transport and secretionPlant Surface Properties and Treatments

The DOI matches its Crossref record; 1 of the 1 references it cites were found in a registry or an index.

Directed growth and fusion of membrane-wall microdomains requires CASP-mediated inhibition and displacement of secretory foci

Open access
Barbosa, ICR, De Bellis, D, Flückiger, I, Bellani, E, Grangé-Guerment, M, Hématy, K, Geldner, N·2022·Nature Communications

Preprint — published as 10.1038/s41467-023-37265-7 · Paper page

Abstract

Summary: Casparian strips (CS), the main extracellular diffusion barrier in plant roots, are precisely localized cell wall lignin-impregnations, contrasting animal tight-junctions. The CS membrane domain (CSD) proteins 1-5 (CASP1-5) define and accumulate at the CS associated membrane domains displaying matrix adhesion and protein exclusion. A full CASP knock-out ( caspQ ) now reveals that CASPs are not needed for localization of lignification or lignin-polymerizing enzymes, since correctly aligned spots still form in the mutant. Ultra-structurally, however, these spots appear as highly disorganized secretory foci, with neither exclusion zone nor membrane attachment and excessive cell wall growth. Biotin proximity labelling identifies RabA-GTPases as potential CASP-interactors. We confirm their localisation and function at the CSD, similar to exocyst subunits, known Rab effectors. Our work reveals that CASPs enforce displacement of initial secretory foci through exclusion of vesicle tethering factors, thereby ensuring rapid fusion of microdomains and effective sealing of the cell wall space.

Overview

The claims and statistics of this paper haven’t been checked yet.

Run the check — free, no account needed. It reads the open-access text and checks the sources it cites.

A few free checks a day · papers already verified open instantly · results are public

Integrity signals

Registry

Crossref · 10.1101/2022.07.03.498613

Cites

1 of 1 references verified0 citation errors · 0 not checkable

Statistics

Figures

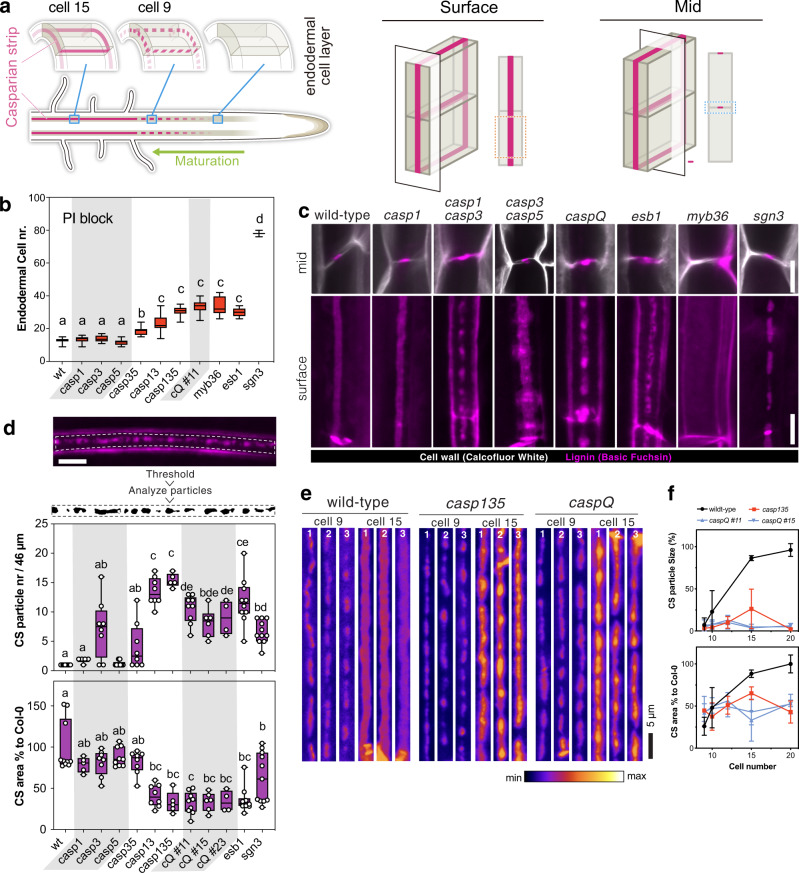
Fig. 1 Casparian Strip development arrests at initiation sites in caspQ. a Schematic of Casparian strip development (magenta). Casparian strips start to appear as centrally aligned foci in the endodermal cell layer (cell 9), progressing into a network of fused rings (cell 15) (left). Illustration of lignin accumulation patterns observed in optical sections at endodermal surface (middle panel) or median positions (right panel). (Schematic modified from Fujita et al., 2019). b Propidium iodide uptake assay, endodermal cell number indicates position at which uptake is blocked. Box-plot with 25–75th percentiles, mean, and whiskers of minima to maxima from n = 10 individuals and significant differences to wild-type shown with different letters by ONE-WAY ANOVE, Tukey test comparisons with adjusted p value < 0.05. c Mid (upper panel) and surface (lower panel) views of CS-lignin (magenta, Basic Fuchsin) and cell wall (gray, Calcofluor White) staining in wild-type, CS mutants and caspQ at endodermal cell 20. d Particle analysis in CS surface of endodermal cell 20, as described in Material and Methods, with variables Particle number and CS % area to Wild-type measured per 46 µm of CS surface. Box-plot with 25–75th percentiles, mean, and whiskers of minima to maxima from n = 8 individuals and significant differences to wild-type shown with different letter by one-way ANOVA, Tukey test comparisons with adjusted p value < 0.05. e Representative pictures of CS surface views from three individuals at endodermal cell number 9 (start of detectable Basic Fuchsin signal) and cell 15 from wild-type, casp135 and caspQ. f Particle size (%) and CS area (%), estimated as in (c), relative to mean wild-type at cell 20, shown is the mean and standard deviation from n = 6 individuals. Scale bars 5 µm.
Fig. 1 Casparian Strip development arrests at initiation sites in caspQ. a Schematic of Casparian strip development (magenta). Casparian strips start to appear as centrally aligned foci in the endodermal cell layer (cell 9), progressing into a network of fused rings (cell 15) (left). Illustration of lignin accumulation patterns observed in optical sections at endodermal surface (middle panel) or median positions (right panel). (Schematic modified from Fujita et al., 2019). b Propidium iodide uptake assay, endodermal cell number indicates position at which uptake is blocked. Box-plot with 25–75th percentiles, mean, and whiskers of minima to maxima from n = 10 individuals and significant differences to wild-type shown with different letters by ONE-WAY ANOVE, Tukey test comparisons with adjusted p value < 0.05. c Mid (upper panel) and surface (lower panel) views of CS-lignin (magenta, Basic Fuchsin) and cell wall (gray, Calcofluor White) staining in wild-type, CS mutants and caspQ at endodermal cell 20. d Particle analysis in CS surface of endodermal cell 20, as described in Material and Methods, with variables Particle number and CS % area to Wild-type measured per 46 µm of CS surface. Box-plot with 25–75th percentiles, mean, and whiskers of minima to maxima from n = 8 individuals and significant differences to wild-type shown with different letter by one-way ANOVA, Tukey test comparisons with adjusted p value < 0.05. e Representative pictures of CS surface views from three individuals at endodermal cell number 9 (start of detectable Basic Fuchsin signal) and cell 15 from wild-type, casp135 and caspQ. f Particle size (%) and CS area (%), estimated as in (c), relative to mean wild-type at cell 20, shown is the mean and standard deviation from n = 6 individuals. Scale bars 5 µm.CC BY · PubMed Central
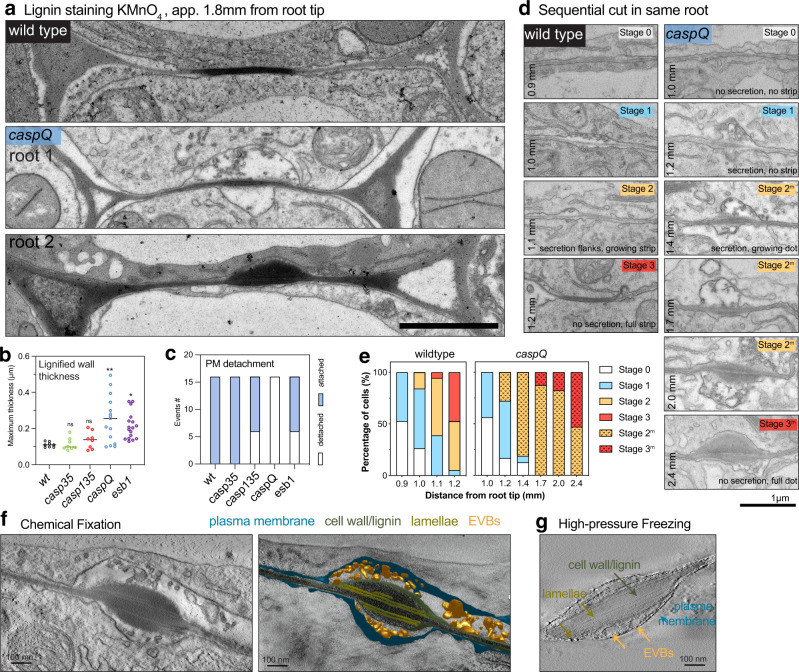
Fig. 2 caspQ foci are lignin-rich secretion hotspots. a–c Representative electron micrographs with KMnO4 lignin staining from wild-type and caspQ endodermal cell-cell junctions in transversal cuts at 1.8 mm from root tip. For caspQ two distinctive appearances are shown. Scale bar 1 µm. a Quantification of maximum thickness of lignified cell-wall stained by KmnO4, mean (line, n = 16) and significant differences to wild-type by one-way ANOVA, Tukey test comparisons with adjusted p value < 0.05. b Total number of events of plasma membrane detachment in total 16 cells from two individuals (c). d, e Developmental staging of wild-type CS and caspQ foci. Pictures were taken along one root at described positions, with 8–10 endodermal cell-cell contacts, shown are pictures of one cell-cell contact for each position representative of app. 16 cells from two roots per genotype. Scale bar 1 µm. d Stage 0 no detectable plasma membrane detachment, extracellular vesicles or cell-wall thickening; Stage 1 plasma membrane detached, extracellular vesicle bodies (Evs) and beginning of cell-wall thickening; Stage 2 wild-type CS widening: secretion stops and PM is attached to modifed cell-wall in the centre; laterally, the PM is detached and Evs are present; Mutant stage 2 (2 m) caspQ foci grow: secretion continues in centre, cell-wall thickens inwards, no PM attachment detectable. Stage 3 mature wild-type CS: no detectable secretion, PM is attached to cell wall and CS is thin and wide. Mutant stage 3 (3 m) mature caspQ foci: secretion stops, cell wall is very thick but PM remains detached. Quantification of all stages from two roots per genotype, 8–10 cell-cell contacts per root €. f, g Tomograms of caspQ foci after chemically fixation (f) and high-pressure freeze-substitution (g), representative from tomograms of three individuals. Chemical fixation induces plasmolysis, allowing visualization of PM detachment and extracellular vesicles, while in high-pressure freezing apoplastic space is compressed and vesicles are still present but squeezed. Inside the caspQ structure, thin transversal aligned lamellae are detected by both methods. Scale bar 0.1 µm.
Fig. 2 caspQ foci are lignin-rich secretion hotspots. a–c Representative electron micrographs with KMnO4 lignin staining from wild-type and caspQ endodermal cell-cell junctions in transversal cuts at 1.8 mm from root tip. For caspQ two distinctive appearances are shown. Scale bar 1 µm. a Quantification of maximum thickness of lignified cell-wall stained by KmnO4, mean (line, n = 16) and significant differences to wild-type by one-way ANOVA, Tukey test comparisons with adjusted p value < 0.05. b Total number of events of plasma membrane detachment in total 16 cells from two individuals (c). d, e Developmental staging of wild-type CS and caspQ foci. Pictures were taken along one root at described positions, with 8–10 endodermal cell-cell contacts, shown are pictures of one cell-cell contact for each position representative of app. 16 cells from two roots per genotype. Scale bar 1 µm. d Stage 0 no detectable plasma membrane detachment, extracellular vesicles or cell-wall thickening; Stage 1 plasma membrane detached, extracellular vesicle bodies (Evs) and beginning of cell-wall thickening; Stage 2 wild-type CS widening: secretion stops and PM is attached to modifed cell-wall in the centre; laterally, the PM is detached and Evs are present; Mutant stage 2 (2 m) caspQ foci grow: secretion continues in centre, cell-wall thickens inwards, no PM attachment detectable. Stage 3 mature wild-type CS: no detectable secretion, PM is attached to cell wall and CS is thin and wide. Mutant stage 3 (3 m) mature caspQ foci: secretion stops, cell wall is very thick but PM remains detached. Quantification of all stages from two roots per genotype, 8–10 cell-cell contacts per root €. f, g Tomograms of caspQ foci after chemically fixation (f) and high-pressure freeze-substitution (g), representative from tomograms of three individuals. Chemical fixation induces plasmolysis, allowing visualization of PM detachment and extracellular vesicles, while in high-pressure freezing apoplastic space is compressed and vesicles are still present but squeezed. Inside the caspQ structure, thin transversal aligned lamellae are detected by both methods. Scale bar 0.1 µm.CC BY · PubMed Central
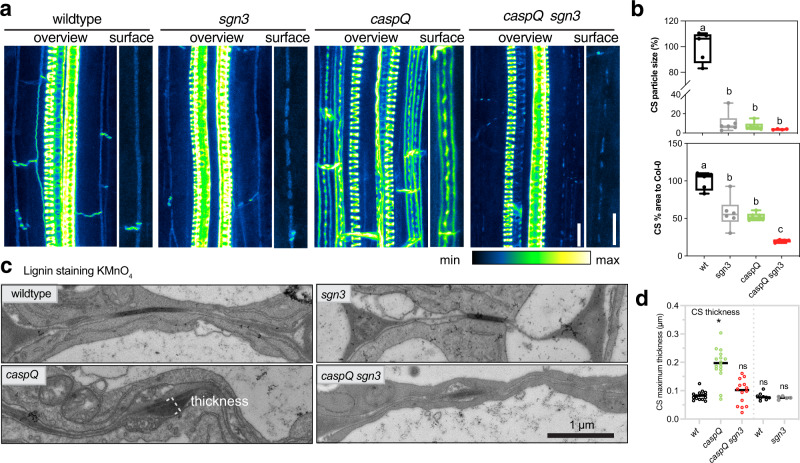
Fig. 3 Outgrowth of caspQ lignin microdomains is SGN3-dependent. a Maximum intensity projections of lignin stained 5-day old roots at endodermal cell number 24 in wild-type, sgn3, caspQ and caspQ sgn3. Scale bars 10 µm. b Particle analysis of CS surface as described in Online Methods, with variables Average particle size (%) and CS % area to wild-type measured per 46 µm of CS surface. Boxplots with minima, median, maxima and data points (n = 6) and significant differences to wild-type shown with different letter by one-way ANOVA, Dunnett’s test p value < 0.05. c, d Electron micrographs of KMnO4 lignin-stained CS of 5-day old roots at 1.5 mm from root tip in wild-type, sgn3, caspQ and caspQ sgn3 and respective quantification of CS maximum thickness stained by KMnO4 (d). Shown is the mean and data points from two experimental sets (separated by dashed line, first set n = 16 cell CS measurements from two individuals per genotype; second set n = 8 cells CS measurements from one individual per genotype). Statistical differences to wild-type one-way ANOVA, Dunnett’s test p value < 0.05.
Fig. 3 Outgrowth of caspQ lignin microdomains is SGN3-dependent. a Maximum intensity projections of lignin stained 5-day old roots at endodermal cell number 24 in wild-type, sgn3, caspQ and caspQ sgn3. Scale bars 10 µm. b Particle analysis of CS surface as described in Online Methods, with variables Average particle size (%) and CS % area to wild-type measured per 46 µm of CS surface. Boxplots with minima, median, maxima and data points (n = 6) and significant differences to wild-type shown with different letter by one-way ANOVA, Dunnett’s test p value < 0.05. c, d Electron micrographs of KMnO4 lignin-stained CS of 5-day old roots at 1.5 mm from root tip in wild-type, sgn3, caspQ and caspQ sgn3 and respective quantification of CS maximum thickness stained by KMnO4 (d). Shown is the mean and data points from two experimental sets (separated by dashed line, first set n = 16 cell CS measurements from two individuals per genotype; second set n = 8 cells CS measurements from one individual per genotype). Statistical differences to wild-type one-way ANOVA, Dunnett’s test p value < 0.05.CC BY · PubMed Central
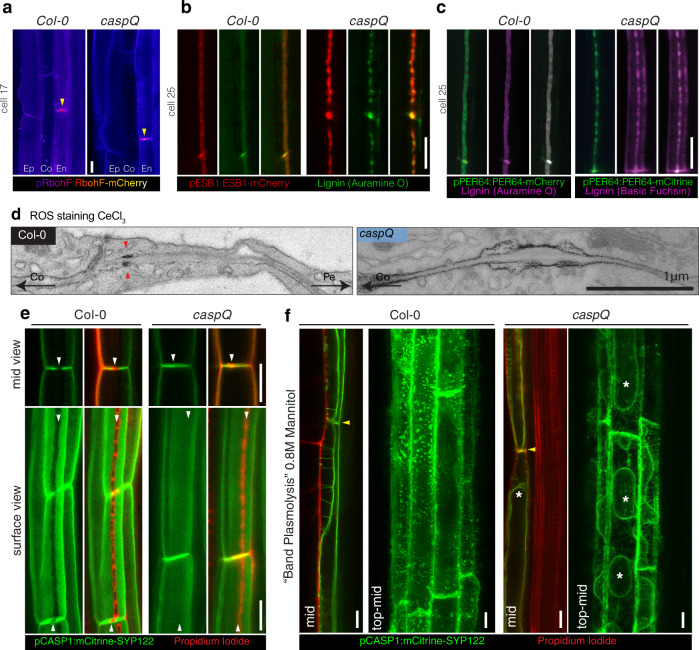
Fig. 4 CASPs are not required for localized lignification but for CSD protein exclusion and cell-wall adhesion. a–c Localization of CS-lignifying enzymes in endodermis of 5-day-old seedlings of wild-type and caspQ: RBOHF-mCherry at cell 17 accumulation in CS (yellow arrow) Ep, epidermis; Co, cortex; En, endodermis (a); ESB1-mCherry and Auramine O-stained CS-lignin (b) and PRX64-Cherry with Auramine O stained CS-lignin (wild-type) and PRX64-mCitrine with Basic Fuchsin stained CS-lignin (caspQ) (c). Shown are pictures representative from three individuals and three independent experiments. d Electron micrographs from CeCl3 ROS-stained roots of wild-type and caspQ. Note the cortex side-stained CS in wild-type (red arrow), in contrast to the broader and plasma-membrane associated staining in caspQ. Shown is a representative picture from 16 cells from two individuals. e Plasma-membrane marker pCASP1::mCitrine-SYP122 is excluded from CSD labelled by the Propidium Iodide (PI)-stained CS in wild-type (see white arrows). In contrast, in caspQ pCASP1::mCitrine-SYP122 localizes to the CSD labelled by PI (white arrows). f Plasma membrane marker pCASP1::mCitrine-SYP122 and PI-stained cell-walls after plasmolysis in seedlings mounted in 0.8 M Mannitol solution. For wild-type in endodermal mid-view, plasma membranes of neighbor cells remain attached to the CS position (yellow arrow), forming the so-called band-plasmolysis; while in a maximum projection of top to mid Z-stacks membrane appears virtually all attached to the cell wall. For caspQ, in both mid and top-mid views the plasma membrane is detached from the CS cell wall (yellow arrow) and protoplasts can be distinguished (asterisks). Pictures in (e and f) are representative of three reproducible experiments with three individuals per genotype and treatment. Ep epidermis, Co cortex, En Endodermis, Pe pericycle. Scale bars 10 µm (except in d. scale bar 1 µm).
Fig. 4 CASPs are not required for localized lignification but for CSD protein exclusion and cell-wall adhesion. a–c Localization of CS-lignifying enzymes in endodermis of 5-day-old seedlings of wild-type and caspQ: RBOHF-mCherry at cell 17 accumulation in CS (yellow arrow) Ep, epidermis; Co, cortex; En, endodermis (a); ESB1-mCherry and Auramine O-stained CS-lignin (b) and PRX64-Cherry with Auramine O stained CS-lignin (wild-type) and PRX64-mCitrine with Basic Fuchsin stained CS-lignin (caspQ) (c). Shown are pictures representative from three individuals and three independent experiments. d Electron micrographs from CeCl3 ROS-stained roots of wild-type and caspQ. Note the cortex side-stained CS in wild-type (red arrow), in contrast to the broader and plasma-membrane associated staining in caspQ. Shown is a representative picture from 16 cells from two individuals. e Plasma-membrane marker pCASP1::mCitrine-SYP122 is excluded from CSD labelled by the Propidium Iodide (PI)-stained CS in wild-type (see white arrows). In contrast, in caspQ pCASP1::mCitrine-SYP122 localizes to the CSD labelled by PI (white arrows). f Plasma membrane marker pCASP1::mCitrine-SYP122 and PI-stained cell-walls after plasmolysis in seedlings mounted in 0.8 M Mannitol solution. For wild-type in endodermal mid-view, plasma membranes of neighbor cells remain attached to the CS position (yellow arrow), forming the so-called band-plasmolysis; while in a maximum projection of top to mid Z-stacks membrane appears virtually all attached to the cell wall. For caspQ, in both mid and top-mid views the plasma membrane is detached from the CS cell wall (yellow arrow) and protoplasts can be distinguished (asterisks). Pictures in (e and f) are representative of three reproducible experiments with three individuals per genotype and treatment. Ep epidermis, Co cortex, En Endodermis, Pe pericycle. Scale bars 10 µm (except in d. scale bar 1 µm).CC BY · PubMed Central
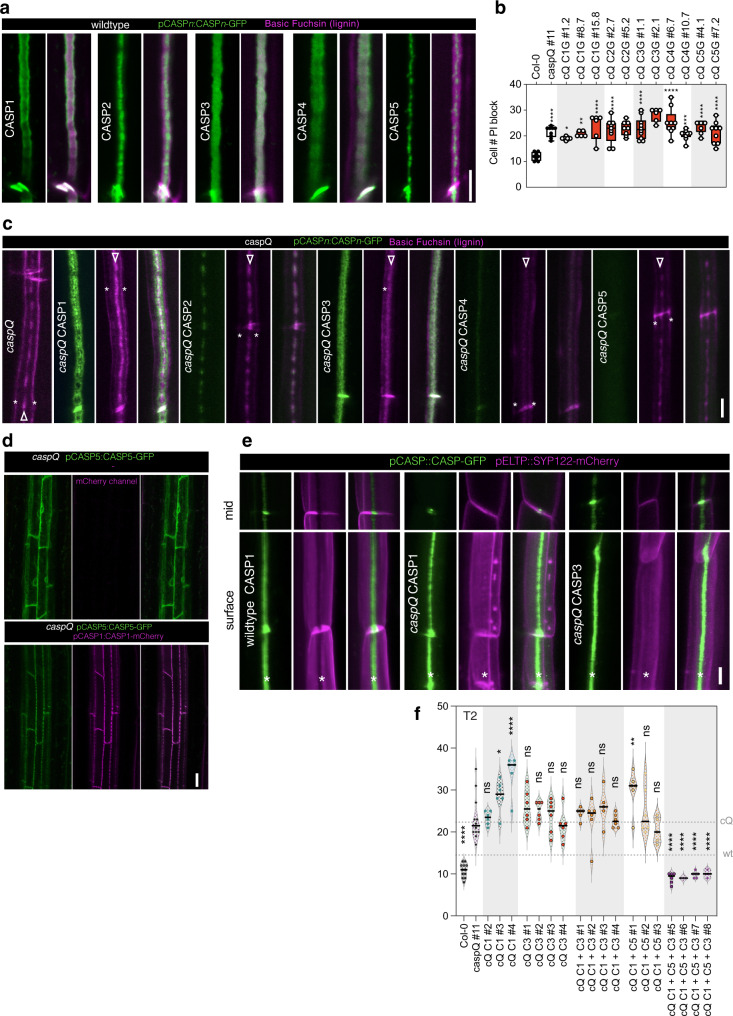
Fig. 5 CASP1-CASP5 diverged in nanodomain localization and function to cooperate in Casparian Strip growth. a CASP1- to CASP5-GFP (green) nanodomain localization in CS surfaces stained with Basic Fuchsin (magenta) at endodermal cell number 15 of wild-type seedlings (pCASPn:CASP-GFP lines). Pictures are representative from three experiments. b Propidium iodide uptake assay in wild-type, caspQ and single CASP1-5 complementation caspQ + pCASPn:CASP-GFP, shown as box-plots with 25–75th percentiles, mean, and whiskers of minima to maxima from n = 8 individuals, from at least two independent T3 homozygous lines per gene. Statistical differences by one-way ANOVA, Tukey’s test comparisons to wild-type (adjusted p < 0.05). c Detailed surface view of lignin staining with Basic Fuchsin and CASP1-5:GFP localization in caspQ and caspQ single CASP1-5 complementation lines at endodermal cell number 25. Lignin stain at cell corners typical of CS-defective mutants (asterisks), and at presumptive CS (arrowheads). d pCASP5:CASP5-GFP in caspQ is retained in ER, but is able to reach CSD when co-expressed with pCASP1:CASP1-GFP in caspQ. e CSD exclusion zone (asterisk) in wild-type and CASP1- and CASP3- complementation caspQ + pCASPn:CASP-GFP visualized with plasma-membrane marker pCASP1:SYP122-mCherry. Neither CASP1-GFP, nor CASP3-GFP presence is sufficient to create a CSD exclusion for SYP122-mCherry in caspQ background. f Single, double and triple CASP1-5 complementation of caspQ obtained by combinatorial gateway constructs with one, two or three CASPs in T2 for a selection of constructs in individuals selected for presence of transgene, n = 6 individuals. Statistical differences by one-way ANOVA, Dunnet’s test comparisons to caspQ (p < 0.05). Pictures in (c–e) are representative from at least three independent experiments. Scale bars 5 µm (a, c, e) and 20 µm (d).
Fig. 5 CASP1-CASP5 diverged in nanodomain localization and function to cooperate in Casparian Strip growth. a CASP1- to CASP5-GFP (green) nanodomain localization in CS surfaces stained with Basic Fuchsin (magenta) at endodermal cell number 15 of wild-type seedlings (pCASPn:CASP-GFP lines). Pictures are representative from three experiments. b Propidium iodide uptake assay in wild-type, caspQ and single CASP1-5 complementation caspQ + pCASPn:CASP-GFP, shown as box-plots with 25–75th percentiles, mean, and whiskers of minima to maxima from n = 8 individuals, from at least two independent T3 homozygous lines per gene. Statistical differences by one-way ANOVA, Tukey’s test comparisons to wild-type (adjusted p < 0.05). c Detailed surface view of lignin staining with Basic Fuchsin and CASP1-5:GFP localization in caspQ and caspQ single CASP1-5 complementation lines at endodermal cell number 25. Lignin stain at cell corners typical of CS-defective mutants (asterisks), and at presumptive CS (arrowheads). d pCASP5:CASP5-GFP in caspQ is retained in ER, but is able to reach CSD when co-expressed with pCASP1:CASP1-GFP in caspQ. e CSD exclusion zone (asterisk) in wild-type and CASP1- and CASP3- complementation caspQ + pCASPn:CASP-GFP visualized with plasma-membrane marker pCASP1:SYP122-mCherry. Neither CASP1-GFP, nor CASP3-GFP presence is sufficient to create a CSD exclusion for SYP122-mCherry in caspQ background. f Single, double and triple CASP1-5 complementation of caspQ obtained by combinatorial gateway constructs with one, two or three CASPs in T2 for a selection of constructs in individuals selected for presence of transgene, n = 6 individuals. Statistical differences by one-way ANOVA, Dunnet’s test comparisons to caspQ (p < 0.05). Pictures in (c–e) are representative from at least three independent experiments. Scale bars 5 µm (a, c, e) and 20 µm (d).CC BY · PubMed Central
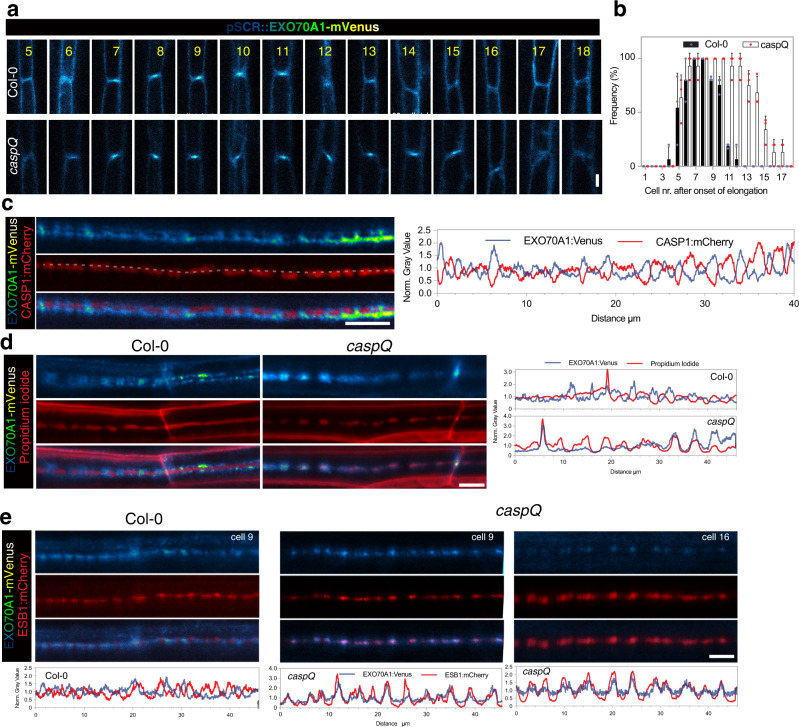
Fig. 6 CASPs are necessary for EXO70A1 removal and progression in growing Casparian Strip. a, b Dynamic accumulation of EXO70A1-mVenus at CSD, inspected along consecutive endodermal cells (5–18) in wild-type and caspQ, confocal picture from representative individuals (a) Shown are the frequencies from three independent experiments (mean and standard deviation), each of which performed in n = 6 individuals (b). c Mutual exclusion of EXO70A1-mVenus and CASP1:mCherry in CS surfaces from wild-type seedlings at cell number 8. Shown is the profile for each channel obtained from same picture, drawing a line of 20 pt thickness (exemplified by dashed gray line). d Mutual exclusion (wild-type) and co-localization (caspQ) of EXO70A1-mVenus and Propidium iodide in CS surfaces in cells number 8–9 with respective profiles, obtained as in (c). e Mutual exclusion (wild-type, cells number 8–9) and co-localization (caspQ, cells number 9 and 16) of EXO70A1-mVenus and ESB1-mCherry in CS surfaces with respective profiles, obtained as in (c). Experiments (c–e) were repeated at least three times with same results. Scale bars 5 µm.
Fig. 6 CASPs are necessary for EXO70A1 removal and progression in growing Casparian Strip. a, b Dynamic accumulation of EXO70A1-mVenus at CSD, inspected along consecutive endodermal cells (5–18) in wild-type and caspQ, confocal picture from representative individuals (a) Shown are the frequencies from three independent experiments (mean and standard deviation), each of which performed in n = 6 individuals (b). c Mutual exclusion of EXO70A1-mVenus and CASP1:mCherry in CS surfaces from wild-type seedlings at cell number 8. Shown is the profile for each channel obtained from same picture, drawing a line of 20 pt thickness (exemplified by dashed gray line). d Mutual exclusion (wild-type) and co-localization (caspQ) of EXO70A1-mVenus and Propidium iodide in CS surfaces in cells number 8–9 with respective profiles, obtained as in (c). e Mutual exclusion (wild-type, cells number 8–9) and co-localization (caspQ, cells number 9 and 16) of EXO70A1-mVenus and ESB1-mCherry in CS surfaces with respective profiles, obtained as in (c). Experiments (c–e) were repeated at least three times with same results. Scale bars 5 µm.CC BY · PubMed Central
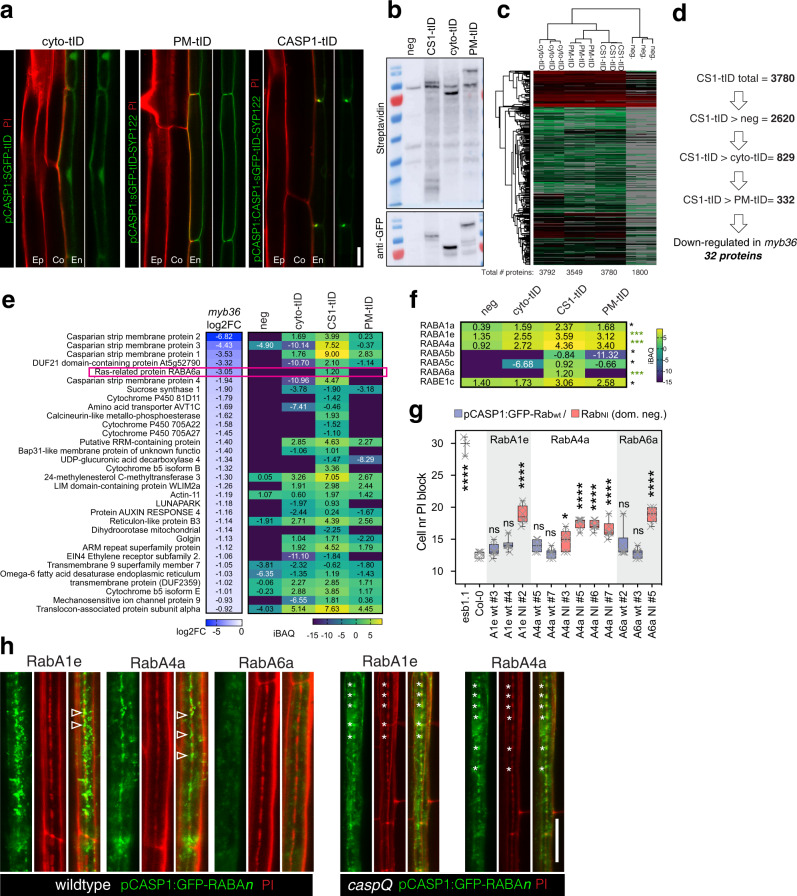
Fig. 7 CASP1-proximity labelling identifies RabAs with CASP-dependent CS-localization and function in CS integrity. a Endodermal expression and sub-cellular localization of GFP-turboID protein fusions: cytosolic (cyto-tID, pCASP1:sGFP-turboID), plasma membrane (PM-tID, pCASP1:sGFP-turboID-SYP122) and CS-localized (CASP1-tID, pCASP1:CASP1-sGFP-turboID). Pictures are representative from at least three independent experiments. b Western Blots of roots of cyto-tID, PM-tID and CASP1-tID, negative control (pCASP1:CASP1-GFP) grown for 6d in normal media and additional 1 day in biotin (50 µM) containing plates; showing biotinylation pattern and presence of intact turboID fusion constructs. Similar biotinylating patterns were observed in at least three independent pilot experiments, shown are the pooled replicates input samples used for LC/MS before purification. Molecular weight of red marker is 70 kDa for both blots. c Cluster Analysis of LC/MS-MS identified proteins from streptadividin purified root extracts as in (b) done in Perseus, from three biological replicates of cyto-tID, PM-tID, CASP1-tID and negative control. d Sequential pairwise analysis (t-Test, two-sided, Bonferroni adjusted p value < 0.05 and log2iBAQ differences above 0 for maximum inclusiveness) reveal 332 significantly enriched proteins in CASP1-tID relative to all other samples. From those 332 proteins, 32 are significantly down-regulated in mutant of CS-transcriptional regulator myb36 (based on Liberman et al., 2015). e Transcriptional downregulation in myb36 (log2-fold change) and protein abundance (iBAQ) in turboID experiment of the 32 proteins significantly enriched in CS1-tID samples and significantly downregulated in myb36, highlighting Ras-related small GTP-ase, RabA6a. f Significantly-enriched (as in d) Ras-related small GTPases in CS1-tID sample, ***p < 0.01 and *p < 0.05. g PI uptake assay of endodermal specific overexpression of the three most enriched RabAs (A1e, A4a and A6a, enriched in CS1-tID p < 0.01) as wild-type sequence and as dominant negative N-I mutants, wild-type and esb1-1 as reference, shown as box-plots with 25–75th percentiles, mean, and whiskers of minima to maxima from n = 6 individuals per genotype. Statistical differences by one-way ANOVA, Tukey’s test comparisons to wild-type (adjusted p < 0.05). h Localization of the three GFP-RabAs in wild-type and caspQ (with exception of RabA6a, where no lines with detectable signal could be retrieved) in cell number 9 stained with PI. Note the presence of GFP-Rab signal intercalated with PI-stained CS string-of-pearls (arrowhead) in wiltype, in contrast with perfect co-localization of GFP-Rab with PI stained central foci of caspQ (asterisks). Experiment was repeated at least three times with same results. Scale bars 10 µm.
Fig. 7 CASP1-proximity labelling identifies RabAs with CASP-dependent CS-localization and function in CS integrity. a Endodermal expression and sub-cellular localization of GFP-turboID protein fusions: cytosolic (cyto-tID, pCASP1:sGFP-turboID), plasma membrane (PM-tID, pCASP1:sGFP-turboID-SYP122) and CS-localized (CASP1-tID, pCASP1:CASP1-sGFP-turboID). Pictures are representative from at least three independent experiments. b Western Blots of roots of cyto-tID, PM-tID and CASP1-tID, negative control (pCASP1:CASP1-GFP) grown for 6d in normal media and additional 1 day in biotin (50 µM) containing plates; showing biotinylation pattern and presence of intact turboID fusion constructs. Similar biotinylating patterns were observed in at least three independent pilot experiments, shown are the pooled replicates input samples used for LC/MS before purification. Molecular weight of red marker is 70 kDa for both blots. c Cluster Analysis of LC/MS-MS identified proteins from streptadividin purified root extracts as in (b) done in Perseus, from three biological replicates of cyto-tID, PM-tID, CASP1-tID and negative control. d Sequential pairwise analysis (t-Test, two-sided, Bonferroni adjusted p value < 0.05 and log2iBAQ differences above 0 for maximum inclusiveness) reveal 332 significantly enriched proteins in CASP1-tID relative to all other samples. From those 332 proteins, 32 are significantly down-regulated in mutant of CS-transcriptional regulator myb36 (based on Liberman et al., 2015). e Transcriptional downregulation in myb36 (log2-fold change) and protein abundance (iBAQ) in turboID experiment of the 32 proteins significantly enriched in CS1-tID samples and significantly downregulated in myb36, highlighting Ras-related small GTP-ase, RabA6a. f Significantly-enriched (as in d) Ras-related small GTPases in CS1-tID sample, ***p < 0.01 and *p < 0.05. g PI uptake assay of endodermal specific overexpression of the three most enriched RabAs (A1e, A4a and A6a, enriched in CS1-tID p < 0.01) as wild-type sequence and as dominant negative N-I mutants, wild-type and esb1-1 as reference, shown as box-plots with 25–75th percentiles, mean, and whiskers of minima to maxima from n = 6 individuals per genotype. Statistical differences by one-way ANOVA, Tukey’s test comparisons to wild-type (adjusted p < 0.05). h Localization of the three GFP-RabAs in wild-type and caspQ (with exception of RabA6a, where no lines with detectable signal could be retrieved) in cell number 9 stained with PI. Note the presence of GFP-Rab signal intercalated with PI-stained CS string-of-pearls (arrowhead) in wiltype, in contrast with perfect co-localization of GFP-Rab with PI stained central foci of caspQ (asterisks). Experiment was repeated at least three times with same results. Scale bars 10 µm.CC BY · PubMed Central
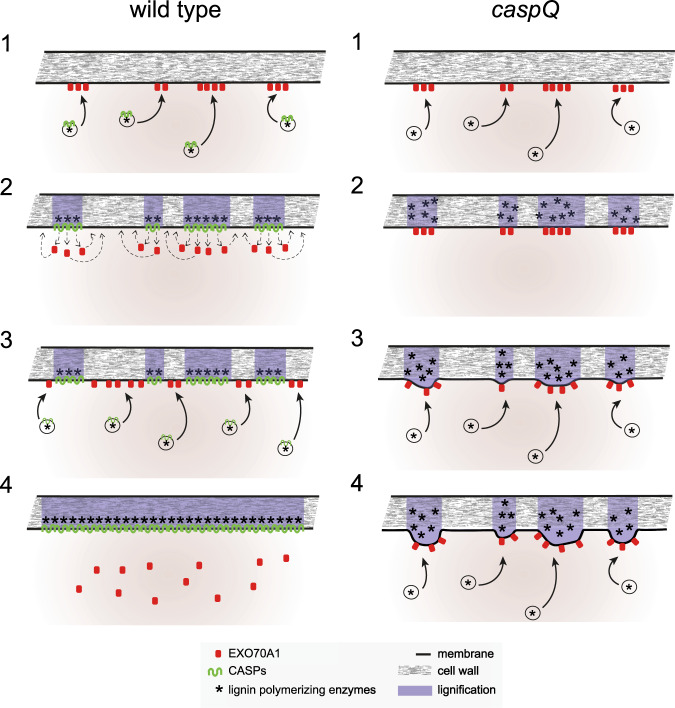
Fig. 8 Conceptual model of CASP action in the endodermis. In presence of CASPs (wild-type): Vesicles carrying CASPs and lignin polymerizing enzymes are specifically targeted to EXO70A1 landmarks at the endodermal plasma membrane (1). Targeting specificity is possibly mediated by the presence of specific RabAs on the vesicles (not shown). CASPs form stable microdomains by polymerization, and mediate the nano-scale organization of lignin polymerizing enzymes in the cell wall. In addition, CASPs mediate, directly or indirectly, the eviction of EXO70A1 from the cytosolic membrane face. EXO70A1 re-locate to parts of the central region that are still free of CASPs (2). New CASP carrying vesicles deliver CASPs to the remaining gaps between microdomains marked by EXO70A1 (3), eventually fusing individual microdomains into a contiguous band and thus sealing the cell wall space (4). In absence of CASPs (caspQ): Vesicle carrying lignin polymerizing enzymes are correctly targeted to EXO70A1 landmarks (1), forming initially normal lignin foci in the correct position (2), absence of CASPs allows EXO70A1 landmarks to persist in the same initial position, further attracting vesicles and lignin polymerizing activity to the same foci, leading to their thickening (3). Continued, persistent secretion to the same foci eventually leads to strongly thickened, aberrantly structured lignin foci that are unable to fuse with each other and do not seal the cell wall space (4).
Fig. 8 Conceptual model of CASP action in the endodermis. In presence of CASPs (wild-type): Vesicles carrying CASPs and lignin polymerizing enzymes are specifically targeted to EXO70A1 landmarks at the endodermal plasma membrane (1). Targeting specificity is possibly mediated by the presence of specific RabAs on the vesicles (not shown). CASPs form stable microdomains by polymerization, and mediate the nano-scale organization of lignin polymerizing enzymes in the cell wall. In addition, CASPs mediate, directly or indirectly, the eviction of EXO70A1 from the cytosolic membrane face. EXO70A1 re-locate to parts of the central region that are still free of CASPs (2). New CASP carrying vesicles deliver CASPs to the remaining gaps between microdomains marked by EXO70A1 (3), eventually fusing individual microdomains into a contiguous band and thus sealing the cell wall space (4). In absence of CASPs (caspQ): Vesicle carrying lignin polymerizing enzymes are correctly targeted to EXO70A1 landmarks (1), forming initially normal lignin foci in the correct position (2), absence of CASPs allows EXO70A1 landmarks to persist in the same initial position, further attracting vesicles and lignin polymerizing activity to the same foci, leading to their thickening (3). Continued, persistent secretion to the same foci eventually leads to strongly thickened, aberrantly structured lignin foci that are unable to fuse with each other and do not seal the cell wall space (4).CC BY · PubMed Central

Verification

Claims the paper makes

The claims and statistics of this paper haven’t been checked yet.

Run the check — free, no account needed. It reads the open-access text and checks the sources it cites.

A few free checks a day · papers already verified open instantly · results are public

Self-check

Percentages, sums and reported differences re-computed from the paper’s own numbers.

The self-check needs the paper’s full text.

Citations

Cites

Show all 1 references

Research works printed but not linked: 55

  1. 10.1038/s41467-018-07467-5 · DOI
  2. 10.1073/pnas.0910772107 · DOI
  3. 2016, Polarly localized kinase SGN1 is required for Casparian strip integrity and positioning, Nat Plants, 2, 16113, 10.1038/nplants.2016.113 · DOI
  4. 10.1016/j.cub.2012.04.064 · DOI · Paper page
  5. 10.1084/jem.20080552 · DOI
  6. 10.1105/tpc.20.00235 · DOI
  7. 10.1016/j.copbio.2018.10.004 · DOI
  8. 1926, Zur Kenntnis der Endodermiszelle, Berichte Der Deutschen Botanischen Gesellschaft, 44, 162, 10.1111/j.1438-8677.1926.tb00954.x · DOI
  9. 10.1105/tpc.9.2.209 · DOI · Paper page
  10. 10.1038/nbt.4201 · DOI · Paper page
  11. 10.1152/physrev.00001.2004 · DOI
  12. 2019, Regulation of a plant aquaporin by a Casparian strip membrane domain protein-like, Plant, Cell & Environment, 42, 1788, 10.1111/pce.13537 · DOI
  13. 2008, MaxQuant enables high peptide identification rates, individualized p, p.b.-range mass accuracies and proteome-wide protein quantification. Nat Biotechnol, 26, 1367
  14. 10.1186/1471-2105-13-S16-S12 · DOI · Paper page
  15. 10.1021/pr101065j · DOI
  16. 2022, Extracellular vesiculo-tubular structures associated with suberin deposition in plant cell walls, Nat Commun, 13, 1489, 10.1038/s41467-022-29110-0 · DOI
  17. 10.1126/science.aaj1562 · DOI
  18. 2020, SCHENGEN receptor module drives localized ROS production and lignification in plant roots, EMBO J, 39, e103894, 10.15252/embj.2019103894 · DOI
  19. 10.1016/j.tplants.2017.08.003 · DOI
  20. 2018, The scaffold proteins of lignin biosynthetic cytochrome P450 enzymes, Nature Plants, 4, 299, 10.1038/s41477-018-0142-9 · DOI
  21. 10.1093/emboj/18.4.1071 · DOI · Paper page
  22. 2017, Proximity Biotinylation as a Method for Mapping Proteins Associated with mtDNA in Living Cells, Cell Chemical Biology, 24, 404, 10.1016/j.chembiol.2017.02.002 · DOI
  23. 10.2307/2440382 · DOI
  24. 10.1093/nar/gkw1041 · DOI · Paper page
  25. 10.1073/pnas.1308412110 · DOI · Paper page
  26. 10.1038/nprot.2016.018 · DOI · Paper page
  27. 2017, Transient cell-specific EXO70A1 activity in the CASP domain and Casparian strip localization, Nat Plants, 3, 17058, 10.1038/nplants.2017.58 · DOI
  28. 10.1073/pnas.1507691112 · DOI
  29. 10.1146/annurev.earth.031208.100209 · DOI · Paper page
  30. 10.1006/jsbi.1996.0013 · DOI
  31. 10.1016/j.cell.2013.02.045 · DOI · Paper page
  32. 10.1073/pnas.1515576112 · DOI
  33. 10.1128/EC.00006-10 · DOI
  34. 10.7554/eLife.47864 · DOI · Paper page
  35. 10.1073/pnas.1205726109 · DOI
  36. 10.1093/plcell/koac051 · DOI
  37. 10.7554/eLife.03115 · DOI
  38. 2019, Elevated synaptic vesicle release probability in synaptophysin/gyrin family quadruple knockouts, ELife, 8, e40744, 10.7554/eLife.40744 · DOI
  39. 2020, Uclacyanin Proteins Are Required for Lignified Nanodomain Formation within Casparian Strips, Current Biology, 30, 4103, 10.1016/j.cub.2020.07.095 · DOI
  40. 2021, Two chemically distinct root lignin barriers control solute and water balance, Nat Commun, 12, 2320, 10.1038/s41467-021-22550-0 · DOI
  41. 10.1073/pnas.2012728117 · DOI
  42. 10.1038/nature10070 · DOI · Paper page
  43. 10.1104/pp.114.239137 · DOI
  44. 2021, The MAL Protein, an Integral Component of Specialized Membranes, in Normal Cells and Cancer, Cells, 10, 1065, 10.3390/cells10051065 · DOI
  45. 10.1016/S1369-5266(02)00307-2 · DOI
  46. 2021, Occludin and tricellulin facilitate formation of anastomosing tight-junction strand network to improve barrier function, MBoC, 32, 722, 10.1091/mbc.E20-07-0464 · DOI
  47. 10.1016/S0968-0004(02)02229-6 · DOI
  48. 10.1126/science.1102765 · DOI · Paper page
  49. 10.1073/pnas.2105287118 · DOI
  50. 10.1038/nmeth.3901 · DOI · Paper page
  51. 10.1186/s13007-021-00811-9 · DOI
  52. Ursache, R. , De Jesus Vieira Teixeira , C., Dénervaud Tendon , V., Gully , K., De Bellis , D., Schmid-Siegert , E., Grube Andersen , T., Shekhar , V., Calderon , S., Pradervand , S., et al . (2021b). GDSL-domain proteins have key roles in suberin polymerization and degradation. Nat. Plants https://doi.org/10.1038/s41477-021-00862-9. · DOI
  53. 10.20892/j.issn.2095-3941.2020.0032 · DOI
  54. 10.1111/j.1469-8137.2009.02880.x · DOI
  55. 10.1074/jbc.M402264200 · DOI · Paper page

Metadata

Authors
Barbosa, I., De Bellis, D., Flückiger, I., Bellani, E., Grangé-Guerment, M., Hématy, K., & Geldner, N.
Affiliations
  • University of Lausanne (CH)
  • AgroParisTech (FR)
Corresponding author
Geldner, N
Venue
Nature Communications
Publisher
openRxiv
Published
2022-07-03
Volume
14
Issue
1
Pages
1626-1626
ISSN
2041-1723 (ISSN-L)
OpenAlex
W4360607921
Cited by
28
References
1
Citations by year
2026: 4 · 2025: 5 · 2024: 13 · 2023: 6
FWCI
4.41
Type
journal article
Language
en
Open access
Licence
cc-by
Locations
  • Nature Communications (publishedVersion, cc-by)
  • bioRxiv (Cold Spring Harbor Laboratory) (acceptedVersion, cc-by-nc)
  • PubMed Central (publishedVersion, cc-by)
  • PubMed (publishedVersion)
  • IRIS (submittedVersion, cc-by)
  • SERVAL (Université de Lausanne) (submittedVersion, cc-by)
  • HAL (submittedVersion)
  • RePEc: Research Papers in Economics (submittedVersion)
  • DOAJ (DOAJ: Directory of Open Access Journals) (submittedVersion, cc-by-sa)
Funders
  • National Science Foundation
  • Schweizerischer Nationalfonds zur Förderung der Wissenschaftlichen Forschung (176399, 156261)
  • Université de Lausanne
Topics
  • Life Sciences › Agricultural and Biological Sciences › Plant Science › Polysaccharides and Plant Cell Walls
  • Life Sciences › Biochemistry, Genetics and Molecular Biology › Cell Biology › Cellular transport and secretion
  • Life Sciences › Agricultural and Biological Sciences › Plant Science › Plant Surface Properties and Treatments
Keywords
Casparian strip, lipid rafts, lignification, cell wall, occludin, exocyst, Rab GTPases, membrane fusion, vesicle tethering, root cell wall, diffusion barrier
MeSH terms
Biological Transport, Cell Membrane, Lignin, Arabidopsis, Arabidopsis Proteins

About these checks

Registry, retraction, Cites and statistics results are computed, not judged, with one exception: a printed reference that no index lists is read once by a model before it counts as a citation error. Claims are extracted by a model and kept only when their quote appears verbatim in the text; each cited source is then checked, with a model’s help, for whether it says what the claim relies on. Those verdicts can be wrong — read the claim’s quote and the cited source before relying on one.

Statistics and arithmetic are recomputed, not judged.

Confidence bands are shown only for fields calibrated on our annotated test set. None is calibrated yet, so no band is shown.

What counts as a claim ›How we measure confidence ›How we check this ›

Are you an author, or do you see a problem with this page? Request a review

How to cite

Cite CoChat for the checks on this page, and the paper for its own findings.

This page
CoChat. (2026). Citation check: Directed growth and fusion of membrane-wall microdomains requires CASP-mediated inhibition and displacement of secretory foci. https://app.cochat.ai/papers/10.1101/2022.07.03.498613
The paper
Barbosa, I., De Bellis, D., Flückiger, I., Bellani, E., Grangé-Guerment, M., Hématy, K., & Geldner, N. (2022). Directed growth and fusion of membrane-wall microdomains requires CASP-mediated inhibition and displacement of secretory foci. Nature Communications. https://doi.org/10.1101/2022.07.03.498613

Data sources

Bibliographic data: Semantic Scholar, OpenAlex, Crossref.

Contains information from the Semantic Scholar Academic Graph Datasets, made available under the ODC Attribution License (ODC-BY 1.0).

Semantic Scholar’s data is described in: Kinney, R., et al. (2023). The Semantic Scholar Open Data Platform. arXiv:2301.10140.