Student or educator? Sign up with your school email and get 6 months of Pro free.
PreprintCited by 25Bacteriophages and microbial interactionsAdvanced Electron Microscopy Techniques and ApplicationsEnzyme Structure and Function

The DOI matches its Crossref record; 1 of the 1 references it cites were found in a registry or an index.

Structure and host specificity of Staphylococcus epidermidis bacteriophage Andhra

Open access

Preprint — published as 10.1126/sciadv.ade0459 · Paper page

Abstract

Staphylococcus epidermidis is an opportunistic pathogen of the human skin, often associated with infections of implanted medical devices. An increase in antibiotic resistance in S. epidermidis and other bacterial pathogens has led to renewed interest in the use of bacteriophages as an alternative to conventional antibiotics. Staphylococcal picoviruses are a group of strictly lytic, short-tailed bacteriophages with compact genomes that are attractive candidates for therapeutic use. Here, we report the structure of the complete virion of S. epidermidis -infecting phage Andhra, determined using high-resolution cryo-electron microscopy, allowing atomic modeling of the capsid and tail proteins, including twelve trimers of a unique receptor binding protein, the hexameric tail knob that acts as a gatekeeper for DNA ejection, and the tail tip, which is a heterooctamer of two different lytic proteins. Our findings elucidate critical features that enable host recognition and penetration, facilitating the development of this group of phages for therapeutic applications.

Overview

The claims and statistics of this paper haven’t been checked yet.

Run the check — free, no account needed. It reads the open-access text and checks the sources it cites.

A few free checks a day · papers already verified open instantly · results are public

Integrity signals

Registry

Crossref · 10.1101/2022.07.21.500982

Cites

1 of 1 references verified0 citation errors · 0 not checkable

Statistics

Figures

Fig. 1. Comparison of Andhra, P68, and ϕ29 genomes. ORFs are numbered in each genome, and relevant genes are labeled. Genes encoding structural proteins are color coded: Tail tip protein (Tip), brown; RBP anchor (Anc), dark blue; terminal protein (5TP), light green; tail tip lysin (LysT), gray; tail knob protein (Knob), cyan; head fiber (Fib), salmon; RBP, gold; tail stem/collar protein (Stem), green; portal protein (PP), magenta; major capsid protein (CP), blue; capsid lining protein (CLP), yellow; core (Cor)/scaffolding (SP) protein, red. Nonstructural proteins include the packaging ATPase (Pac), hatched; the DNA polymerase (Pol), black; and the single-stranded DNA binding protein (SDB), holin (Hol) and endolysin (Lys), white. The stippled areas between the Andhra and P68 genomes indicate regions of >70% nucleotide identity, calculated in BLASTN (29). The ϕ29 genome was split between ORFs 7 and 6, and the right end was moved to the left side (indicated by the duplicated ORFs in gray) to facilitate a more direct comparison to Andhra and P68.
Fig. 1. Comparison of Andhra, P68, and ϕ29 genomes. ORFs are numbered in each genome, and relevant genes are labeled. Genes encoding structural proteins are color coded: Tail tip protein (Tip), brown; RBP anchor (Anc), dark blue; terminal protein (5TP), light green; tail tip lysin (LysT), gray; tail knob protein (Knob), cyan; head fiber (Fib), salmon; RBP, gold; tail stem/collar protein (Stem), green; portal protein (PP), magenta; major capsid protein (CP), blue; capsid lining protein (CLP), yellow; core (Cor)/scaffolding (SP) protein, red. Nonstructural proteins include the packaging ATPase (Pac), hatched; the DNA polymerase (Pol), black; and the single-stranded DNA binding protein (SDB), holin (Hol) and endolysin (Lys), white. The stippled areas between the Andhra and P68 genomes indicate regions of >70% nucleotide identity, calculated in BLASTN (29). The ϕ29 genome was split between ORFs 7 and 6, and the right end was moved to the left side (indicated by the duplicated ORFs in gray) to facilitate a more direct comparison to Andhra and P68.CC BY · PubMed Central
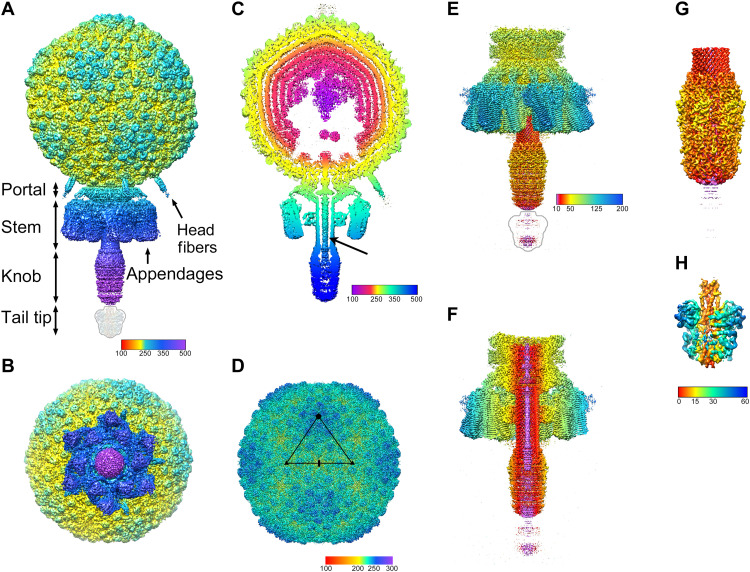
Fig. 2. Isosurface representations of the reconstructions. (A) Asymmetric reconstruction of the whole virion, colored radially from the center of the capsid according to the color bar (distances in angstrom). Rendered at 5 SDs above the mean (5σ). The tail tip was not visible in the reconstruction at this cutoff and is indicated by the outline. (B) The asymmetric reconstruction viewed from the bottom (tail end), showing the sixfold symmetric arrangement of the appendages. (C) A 50-Å-thick slab through the asymmetric reconstruction, showing the concentric rings of DNA in the interior and the DNA inside the tail (arrow). Colored radially from the center of the capsid according to the color bar. (D) Icosahedral reconstruction of the capsid, rendered at 3σ and colored radially from the capsid center according to the color bar. The asymmetric unit triangle is shown, with fivefold, threefold, and twofold symmetry axes denoted by the pentagon, triangles, and oval, respectively. (E) C6 reconstruction of the tail, rendered at 3σ and colored radially from the central axis according to the color bar. The tail tip is indicated by the outline. (F) Cutaway view of the tail, rendered and colored as in (E). (G) Focused C6 reconstruction of the distal tail, showing the tail knob, rendered at 6σ and colored as in (E). (H) Focused asymmetric reconstruction of the tail tip, rendered at 2.5σ and colored radially from the central axis according to the color bar.
Fig. 2. Isosurface representations of the reconstructions. (A) Asymmetric reconstruction of the whole virion, colored radially from the center of the capsid according to the color bar (distances in angstrom). Rendered at 5 SDs above the mean (5σ). The tail tip was not visible in the reconstruction at this cutoff and is indicated by the outline. (B) The asymmetric reconstruction viewed from the bottom (tail end), showing the sixfold symmetric arrangement of the appendages. (C) A 50-Å-thick slab through the asymmetric reconstruction, showing the concentric rings of DNA in the interior and the DNA inside the tail (arrow). Colored radially from the center of the capsid according to the color bar. (D) Icosahedral reconstruction of the capsid, rendered at 3σ and colored radially from the capsid center according to the color bar. The asymmetric unit triangle is shown, with fivefold, threefold, and twofold symmetry axes denoted by the pentagon, triangles, and oval, respectively. (E) C6 reconstruction of the tail, rendered at 3σ and colored radially from the central axis according to the color bar. The tail tip is indicated by the outline. (F) Cutaway view of the tail, rendered and colored as in (E). (G) Focused C6 reconstruction of the distal tail, showing the tail knob, rendered at 6σ and colored as in (E). (H) Focused asymmetric reconstruction of the tail tip, rendered at 2.5σ and colored radially from the central axis according to the color bar.CC BY · PubMed Central
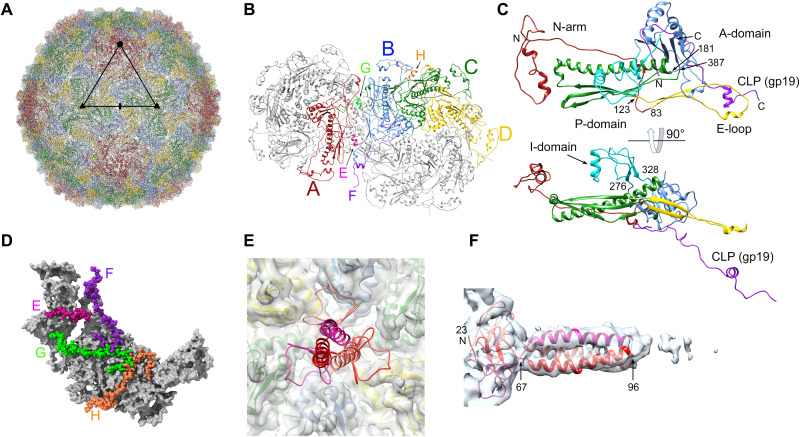
Fig. 3. The capsid. (A) Ribbon diagram of the entire icosahedral capsid, viewed down a twofold axis, as in Fig. 2D. CP subunits are color coded: A, red; B, blue; C, green; D, yellow. An asymmetric unit triangle, delimited by fivefold, twofold, and two threefold axes, is shown. (B) Ribbon diagram showing one hexamer and one pentamer, viewed from the outside of the capsid. The four CP subunits in one asymmetric unit are colored as in (A). The corresponding CLP (gp19) subunits are color coded: E, pink; F, purple; G, light green; H, orange. (C) Ribbon diagram of CP subunit B, colored by domain: N-arm, red; E-loop, yellow; P-domain, green; A-domain, blue; insertion domain, cyan. The corresponding CLP (subunit F) is purple. The bottom panel is rotated 90°. Pertinent residues are numbered. (D) One asymmetric unit, viewed from the inside of the capsid, showing the CLPs, colored as in (B) with atoms represented as spheres. CP is shown as a gray molecular surface. (E) Ribbon diagram of the head fiber (gp13) trimer model (scarlet, ruby, and crimson), showing its attachment to the CP hexamer. Capsid density is shown as a transparent gray isosurface, with the corresponding CP subunit models inside. (F) Ribbon diagram of the head fiber trimer fitted into the asymmetric reconstruction density (transparent surface), viewed perpendicularly to the axis of the fiber and numbered by residue.
Fig. 3. The capsid. (A) Ribbon diagram of the entire icosahedral capsid, viewed down a twofold axis, as in Fig. 2D. CP subunits are color coded: A, red; B, blue; C, green; D, yellow. An asymmetric unit triangle, delimited by fivefold, twofold, and two threefold axes, is shown. (B) Ribbon diagram showing one hexamer and one pentamer, viewed from the outside of the capsid. The four CP subunits in one asymmetric unit are colored as in (A). The corresponding CLP (gp19) subunits are color coded: E, pink; F, purple; G, light green; H, orange. (C) Ribbon diagram of CP subunit B, colored by domain: N-arm, red; E-loop, yellow; P-domain, green; A-domain, blue; insertion domain, cyan. The corresponding CLP (subunit F) is purple. The bottom panel is rotated 90°. Pertinent residues are numbered. (D) One asymmetric unit, viewed from the inside of the capsid, showing the CLPs, colored as in (B) with atoms represented as spheres. CP is shown as a gray molecular surface. (E) Ribbon diagram of the head fiber (gp13) trimer model (scarlet, ruby, and crimson), showing its attachment to the CP hexamer. Capsid density is shown as a transparent gray isosurface, with the corresponding CP subunit models inside. (F) Ribbon diagram of the head fiber trimer fitted into the asymmetric reconstruction density (transparent surface), viewed perpendicularly to the axis of the fiber and numbered by residue.CC BY · PubMed Central
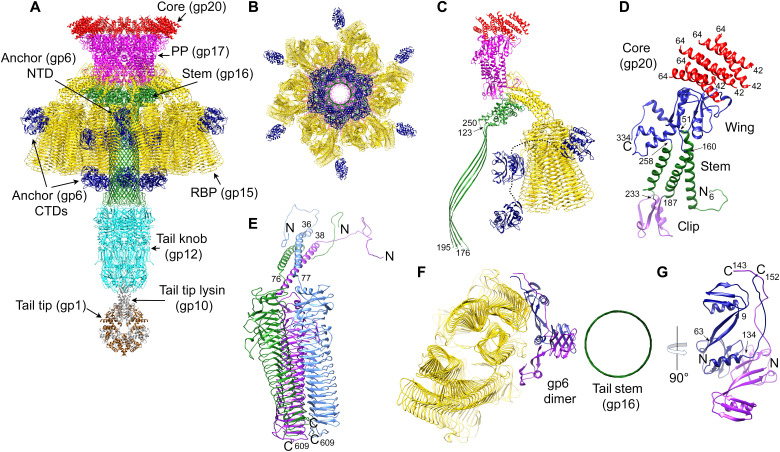
Fig. 4. The tail structure. (A) Ribbon diagram of the composite model of the Andhra tail proteins, viewed from the side and colored as in Fig. 1: core protein (gp20), red; PP (gp17), magenta; tail stem protein (gp16), green; RBP (gp15), gold; RBP anchor (gp6), blue; tail knob protein (gp12), cyan; tail tip lysin (gp10), gray; tail tip protein (gp1), brown. (B) Model of the tail, viewed from the bottom; knob and tip not included. (C) One asymmetric unit of the C6 tail reconstruction, comprising 12 copies of core protein (gp20), two copies of PP (gp17), two copies of tail stem protein (gp16), six copies (two trimers) of RBP (gp15), and two copies of the anchor protein (gp6). (Knob and tip not included.) The connections between the N- and C-terminal domains of gp6 are indicated by the dotted lines. (D) PP monomer with the wing, stem, and clip domains colored blue, green, and purple, respectively. The corresponding six copies of the core protein (gp20) are shown in red. (E) One RBP trimer, with protomers colored blue, green, and purple. The N and C termini are indicated. (F) Ribbon diagram of a section through the tail, viewed from the bottom, showing a dimer of gp6 (blue and purple) interacting with the barrel of the tail stem (green) and the RBPs (gold). (G) A 90° rotated view of the gp6 dimer, viewed perpendicular to the axis of the tail. N and C termini are indicated. Pertinent residues are numbered in (C) to (E) and (G).
Fig. 4. The tail structure. (A) Ribbon diagram of the composite model of the Andhra tail proteins, viewed from the side and colored as in Fig. 1: core protein (gp20), red; PP (gp17), magenta; tail stem protein (gp16), green; RBP (gp15), gold; RBP anchor (gp6), blue; tail knob protein (gp12), cyan; tail tip lysin (gp10), gray; tail tip protein (gp1), brown. (B) Model of the tail, viewed from the bottom; knob and tip not included. (C) One asymmetric unit of the C6 tail reconstruction, comprising 12 copies of core protein (gp20), two copies of PP (gp17), two copies of tail stem protein (gp16), six copies (two trimers) of RBP (gp15), and two copies of the anchor protein (gp6). (Knob and tip not included.) The connections between the N- and C-terminal domains of gp6 are indicated by the dotted lines. (D) PP monomer with the wing, stem, and clip domains colored blue, green, and purple, respectively. The corresponding six copies of the core protein (gp20) are shown in red. (E) One RBP trimer, with protomers colored blue, green, and purple. The N and C termini are indicated. (F) Ribbon diagram of a section through the tail, viewed from the bottom, showing a dimer of gp6 (blue and purple) interacting with the barrel of the tail stem (green) and the RBPs (gold). (G) A 90° rotated view of the gp6 dimer, viewed perpendicular to the axis of the tail. N and C termini are indicated. Pertinent residues are numbered in (C) to (E) and (G).CC BY · PubMed Central
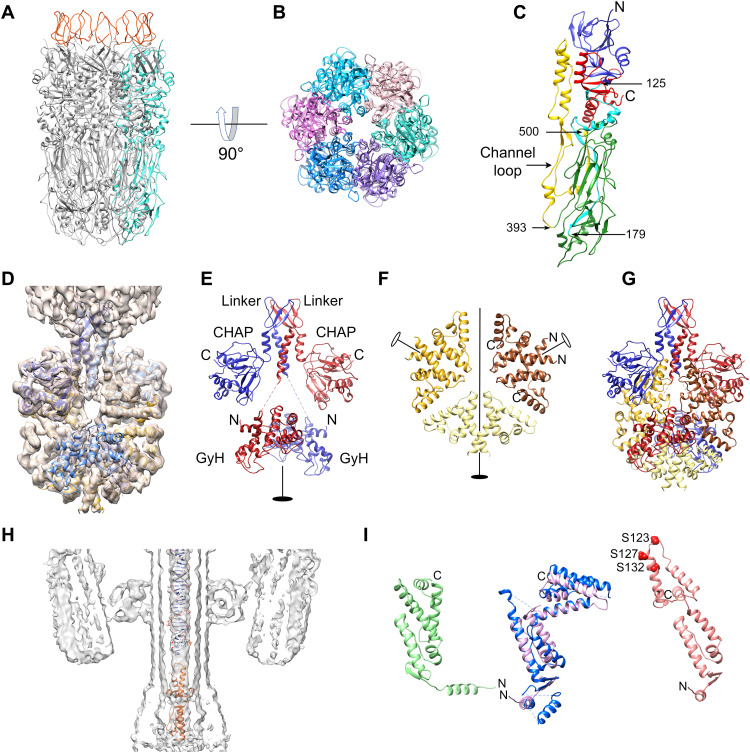
Fig. 5. Distal tail structure. (A) Ribbon diagram of the tail knob (gp12) hexamer. One protomer is colored cyan. Tail stem (g16) loops are in red. (B) gp12 hexamer, viewed from the tail tip. Each protomer is colored in a different shade. (C) Ribbon diagram of a gp12 monomer: N-terminal domain, blue; N-to-C linker, cyan; tip domain, green; channel loop, yellow; C-terminal domain, red. Pertinent residues are numbered. (D) Isosurface (2.5σ) of the focused asymmetric reconstruction of the tail tip with gp10 and gp1 shown in blue and gold, respectively. (E) Ribbon diagram showing the two subunits of gp10 (red and blue). The N-terminal GyH, middle linker, and C-terminal CHAP domains are labeled, the flexible linkers are indicated by dashed lines, and the twofold symmetry axis is indicated by the filled oval. (F) Ribbon diagram showing the six subunits of gp1 in the tail tip arranged as three dimers, colored brown, sand, and gold. The twofold symmetry axis is indicated by the filled oval; peripheral dimer twofold axes are shown as open ovals. N and C termini are indicated on one dimer. (G) Ribbon diagram of the tail tip model, showing gp10 and gp1, colored as in (E) and (F) and viewed as in (E). (H) A 15-Å-thick slab through the asymmetric virion reconstruction, showing the central density in the tail with double stranded DNA and the gp7 model (orange) fitted in. (I) Left: Ribbon diagram of the AlphaFold model for gp7 (green). Middle: The modified gp7 model (pink) superimposed on the ϕ29 gp3 crystal structure (blue). Right: gp7 (salmon) modified to fit into the central tail density. N and C termini are indicated, and the serine residues near the top of the molecule (S123, S127, and S132) are shown as red spheres.
Fig. 5. Distal tail structure. (A) Ribbon diagram of the tail knob (gp12) hexamer. One protomer is colored cyan. Tail stem (g16) loops are in red. (B) gp12 hexamer, viewed from the tail tip. Each protomer is colored in a different shade. (C) Ribbon diagram of a gp12 monomer: N-terminal domain, blue; N-to-C linker, cyan; tip domain, green; channel loop, yellow; C-terminal domain, red. Pertinent residues are numbered. (D) Isosurface (2.5σ) of the focused asymmetric reconstruction of the tail tip with gp10 and gp1 shown in blue and gold, respectively. (E) Ribbon diagram showing the two subunits of gp10 (red and blue). The N-terminal GyH, middle linker, and C-terminal CHAP domains are labeled, the flexible linkers are indicated by dashed lines, and the twofold symmetry axis is indicated by the filled oval. (F) Ribbon diagram showing the six subunits of gp1 in the tail tip arranged as three dimers, colored brown, sand, and gold. The twofold symmetry axis is indicated by the filled oval; peripheral dimer twofold axes are shown as open ovals. N and C termini are indicated on one dimer. (G) Ribbon diagram of the tail tip model, showing gp10 and gp1, colored as in (E) and (F) and viewed as in (E). (H) A 15-Å-thick slab through the asymmetric virion reconstruction, showing the central density in the tail with double stranded DNA and the gp7 model (orange) fitted in. (I) Left: Ribbon diagram of the AlphaFold model for gp7 (green). Middle: The modified gp7 model (pink) superimposed on the ϕ29 gp3 crystal structure (blue). Right: gp7 (salmon) modified to fit into the central tail density. N and C termini are indicated, and the serine residues near the top of the molecule (S123, S127, and S132) are shown as red spheres.CC BY · PubMed Central

Verification

Claims the paper makes

The claims and statistics of this paper haven’t been checked yet.

Run the check — free, no account needed. It reads the open-access text and checks the sources it cites.

A few free checks a day · papers already verified open instantly · results are public

Self-check

Percentages, sums and reported differences re-computed from the paper’s own numbers.

The self-check needs the paper’s full text.

Citations

Cites

Research works printed but not linked: 70

  1. 10.1371/journal.pone.0047075 · DOI
  2. 10.1086/520289 · DOI · Paper page
  3. 10.1016/j.idc.2008.10.003 · DOI · Paper page
  4. 10.1056/NEJM199808203390806 · DOI
  5. 10.15585/mmwr.mm6809e1 · DOI · Paper page
  6. 10.1038/nrmicro2182 · DOI
  7. 10.1016/j.idc.2008.10.001 · DOI · Paper page
  8. 2017, Staphylococcus epidermidis: a major player in bacterial sepsis, Future Microbiol, 12, 1031, 10.2217/fmb-2017-0143 · DOI
  9. 10.1128/CMR.00109-13 · DOI · Paper page
  10. 10.1016/j.cmi.2018.11.012 · DOI · Paper page
  11. 10.1086/533593 · DOI
  12. 2021, Staphylococcus epidermidis Phages Transduce Antimicrobial Resistance Plasmids and Mobilize Chromosomal Islands, mSphere, 6, e00223
  13. 10.1089/mdr.2005.11.83 · DOI
  14. 2017, Past, Present, and Future of Antibacterial Economics: Increasing Bacterial Resistance, Limited Antibiotic Pipeline, and Societal Implications, Pharmacotherapy, 37, 71, 10.1002/phar.1868 · DOI · Paper page
  15. 10.4161/viru.22507 · DOI · Paper page
  16. 10.1016/j.mib.2011.08.002 · DOI
  17. 10.4161/bact.1.2.15845 · DOI · Paper page
  18. 10.1016/j.virol.2012.09.015 · DOI
  19. 10.1016/j.mib.2011.07.028 · DOI · Paper page
  20. 2018, A Wake-Up Call: We Need Phage Therapy Now, Viruses, 10, E688, 10.3390/v10120688 · DOI
  21. 2013, Bacteriophage therapy against staphylococci, Acta Microbiol Immunol Hung, 60, 411, 10.1556/AMicr.60.2013.4.3 · DOI
  22. 10.1016/S0065-2164(10)70007-1 · DOI · Paper page
  23. 2021, The phages of staphylococci: critical catalysts in health and disease, Trends Microbiol, 29, 1117, 10.1016/j.tim.2021.04.008 · DOI
  24. 10.3389/fmicb.2016.01209 · DOI
  25. 10.1016/j.resmic.2008.03.005 · DOI
  26. 10.1128/MMBR.65.2.261-287.2001 · DOI
  27. M. Salas , Phage ϕ29 and its relatives. The Bacteriophages, 315–330 (2006). · DOI
  28. 10.1016/S0378-1097(03)00028-4 · DOI
  29. 10.1016/bs.enz.2016.03.005 · DOI
  30. 2017, A Novel Staphylococcus podophage encodes a unique lysin with unusual modular design, mSphere, 2, e00040
  31. 2019, Draft Genome Sequences of Staphylococcus podophages JBug18, Pike, Pontiff, and Pabna, Microbiol Resour Announc, 8, e00054
  32. 10.1146/annurev-micro-092412-155620 · DOI · Paper page
  33. 10.1002/cbic.200900557 · DOI
  34. 10.7554/eLife.42166 · DOI · Paper page
  35. 10.1126/sciadv.aaw7414 · DOI
  36. 10.1007/s000180050455 · DOI
  37. 10.1016/S0065-3233(03)01007-6 · DOI
  38. 10.1016/j.jmb.2017.12.007 · DOI · Paper page
  39. 10.1038/nsb939 · DOI
  40. 2020, Structure of the host cell recognition and penetration machinery of a Staphylococcus aureus bacteriophage, PLoS Pathog, 16, e1008314, 10.1371/journal.ppat.1008314 · DOI
  41. 10.1128/JVI.01641-07 · DOI
  42. 10.1126/science.8023158 · DOI · Paper page
  43. 10.1016/j.molcel.2009.04.009 · DOI
  44. 2019, Structural assembly of the tailed bacteriophage ϕ29, Nat Commun, 10, 2366, 10.1038/s41467-019-10272-3 · DOI
  45. 10.1038/nature18017 · DOI
  46. 10.1073/pnas.1207730109 · DOI
  47. 2019, Combining random microseed matrix screening and the magic triangle for the efficient structure solution of a potential lysin from bacteriophage P68, Acta Crystallogr D Struct Biol, 75, 670, 10.1107/S2059798319009008 · DOI
  48. 10.1073/pnas.1208424109 · DOI
  49. 10.1038/nsmb1317 · DOI
  50. 10.1038/sj.emboj.7601027 · DOI
  51. 2019, Molecular Piracy: Redirection of Bacteriophage Capsid Assembly by Mobile Genetic Elements, Viruses, 11, 1003, 10.3390/v11111003 · DOI
  52. 2021, Shape shifter: redirection of prolate phage capsid assembly by staphylococcal pathogenicity islands, Nat Commun, 12, 6408, 10.1038/s41467-021-26759-x · DOI
  53. 10.1006/jmbi.1994.0169 · DOI
  54. 10.1016/j.jmb.2011.07.036 · DOI
  55. A. D. Dearborn , E. A. Wall , J. L. Kizziah , L. Klenow , L. K. Parker , K. A. Manning , M. S. Spilman , J. M. Spear , G. E. Christie , T. Dokland , Competing scaffolding proteins determine capsid size during mobilization of Staphylococcus aureus pathogenicity islands. Elife 6, 10.7554 (2017). · DOI
  56. 10.1016/0042-6822(91)90149-6 · DOI
  57. 10.1074/mcp.M900625-MCP200 · DOI · Paper page
  58. 2015, Mechanisms of DNA Packaging by Large Double-Stranded DNA Viruses, Annu Rev Virol, 2, 351, 10.1146/annurev-virology-100114-055212 · DOI
  59. 2022, Understanding the Mechanisms That Drive Phage Resistance in Staphylococci to Prevent Phage Therapy Failure, Viruses, 14, 1061, 10.3390/v14051061 · DOI
  60. H. Ingmer , D. Gerlach , C. Wolz , Temperate Phages of Staphylococcus aureus. Microbiol Spectr 7, (2019). · DOI
  61. 10.1128/JB.01412-10 · DOI
  62. 10.1016/j.ijmm.2009.10.001 · DOI
  63. 10.1016/j.carres.2004.03.017 · DOI · Paper page
  64. 10.1021/acssynbio.7b00240 · DOI
  65. 10.1016/j.jsb.2006.06.010 · DOI · Paper page
  66. 10.1107/S1399004714021683 · DOI
  67. 10.1038/nmeth.3213 · DOI · Paper page
  68. 10.1002/PRO.3943 · DOI · Paper page
  69. 10.1107/S2059798318006551 · DOI · Paper page
  70. 10.1107/S0907444909042073 · DOI · Paper page

Metadata

Authors
Hawkins, N. C., Kizziah, J. L., Hatoum-Aslan, A., & Dokland, T.
Affiliations
  • University of Alabama at Birmingham (US)
  • University of Illinois Urbana-Champaign (US)
Corresponding author
Dokland, Terje
Venue
Science Advances
Publisher
openRxiv
Published
2022-07-21
Volume
8
Issue
48
Pages
eade0459-eade0459
ISSN
2375-2548 (ISSN-L)
OpenAlex
W4310437436
Cited by
25
References
1
Citations by year
2026: 6 · 2025: 7 · 2024: 7 · 2023: 5
FWCI
2.53
Type
journal article
Language
en
Open access
Locations
  • Science Advances (publishedVersion)
  • bioRxiv (Cold Spring Harbor Laboratory) (acceptedVersion, cc-by)
  • PubMed Central (publishedVersion, cc-by)
  • PubMed (publishedVersion)
Funders
  • National Institute of General Medical Sciences (U24GM116789)
  • National Institute of Allergy and Infectious Diseases (R21AI156636, R01AI083255)
Topics
  • Life Sciences › Immunology and Microbiology › Virology › Bacteriophages and microbial interactions
  • Life Sciences › Biochemistry, Genetics and Molecular Biology › Structural Biology › Advanced Electron Microscopy Techniques and Applications
  • Life Sciences › Biochemistry, Genetics and Molecular Biology › Structural Biology › Enzyme Structure and Function
Keywords
Staphylococcus epidermidis, phage structure, viral assembly, capsid, receptor binding protein, lytic proteins, host specificity, host recognition, DNA ejection, AlphaFold structure prediction, cryo-electron microscopy
MeSH terms
Capsid, Humans, Staphylococcus Phages, Staphylococcus epidermidis, Cryoelectron Microscopy, Capsid Proteins, Host Specificity

About these checks

Registry, retraction, Cites and statistics results are computed, not judged, with one exception: a printed reference that no index lists is read once by a model before it counts as a citation error. Claims are extracted by a model and kept only when their quote appears verbatim in the text; each cited source is then checked, with a model’s help, for whether it says what the claim relies on. Those verdicts can be wrong — read the claim’s quote and the cited source before relying on one.

Statistics and arithmetic are recomputed, not judged.

Confidence bands are shown only for fields calibrated on our annotated test set. None is calibrated yet, so no band is shown.

What counts as a claim ›How we measure confidence ›How we check this ›

Are you an author, or do you see a problem with this page? Request a review

Data sources

Bibliographic data: Semantic Scholar, OpenAlex, Crossref.

Contains information from the Semantic Scholar Academic Graph Datasets, made available under the ODC Attribution License (ODC-BY 1.0).

Semantic Scholar’s data is described in: Kinney, R., et al. (2023). The Semantic Scholar Open Data Platform. arXiv:2301.10140.