PreprintCited by 35Ion channel regulation and functionIon Transport and Channel RegulationIon Channels and Receptors

The DOI matches its Crossref record; 1 of the 1 references it cites were found in a registry or an index.

Structure of a LRRC8 chimera with physiologically relevant properties reveals heptameric assembly and pore-blocking lipids

Open access

Preprint — published as 10.7554/elife.82431 · Paper page

Abstract

Volume-regulated anion channels (VRACs) mediate Cl - and organic solute efflux from vertebrate cells and are essential for cell volume homeostasis. VRACs are heteromeric assemblies of LRRC8A-E proteins with unknown stoichiometries. Homomeric LRRC8A and LRRC8D channels have a hexameric structure. However, these channels are either non-functional or exhibit abnormal functional properties limiting their utility for structure-function analyses. We circumvented these limitations by developing novel homomeric LRRC8 chimeric channels with physiologically relevant functional properties. We demonstrate here that the LRRC8C-LRRC8A(IL1 25 ) chimera comprising LRRC8C and 25 amino acids unique to the first intracellular loop (IL1) of LRRC8A has a heptameric structure like that of homologous pannexin channels. Membrane lipids are a key structural element of the channel and are located between subunits and occluding the channel pore. Our results suggest that native VRAC/LRRC8 channels are heptamers and that associated lipids are likely essential for normal channel gating and regulation.

Overview

The claims and statistics of this paper haven’t been checked yet.

Run the check — free, no account needed. It reads the open-access text and checks the sources it cites.

A few free checks a day · papers already verified open instantly · results are public

Integrity signals

Registry

Crossref · 10.1101/2022.07.28.501913

Cites

1 of 1 references verified0 citation errors · 0 not checkable

Statistics

Figures

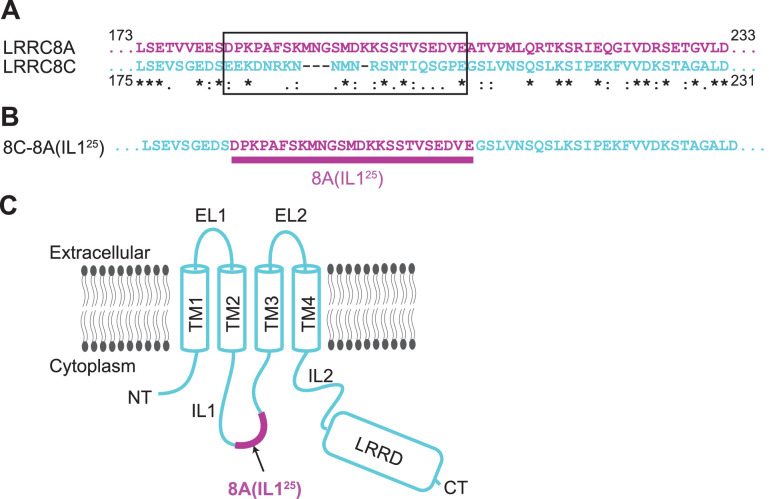
Figure 1. Construct design of 8C-8A(IL125). (A) Sequence alignment of LRRC8A and LRRC8C around the swapped IL125 region. The swapped region in the 8C-8A(IL125) construct is shown inside a black box. The key below amino acid sequences denotes identical (*), conservative (:), and semi-conservative (.) sequences. Space indicates the residues that are not conserved. (B) The amino acid sequence of the 8C-8A(IL125) construct around the swapped IL125 region. (C) Schematic diagram of the 8C-8A(IL125) protein highlighting the relative position of the swapped IL125 region.
Figure 1. Construct design of 8C-8A(IL125). (A) Sequence alignment of LRRC8A and LRRC8C around the swapped IL125 region. The swapped region in the 8C-8A(IL125) construct is shown inside a black box. The key below amino acid sequences denotes identical (*), conservative (:), and semi-conservative (.) sequences. Space indicates the residues that are not conserved. (B) The amino acid sequence of the 8C-8A(IL125) construct around the swapped IL125 region. (C) Schematic diagram of the 8C-8A(IL125) protein highlighting the relative position of the swapped IL125 region.CC BY · PubMed Central
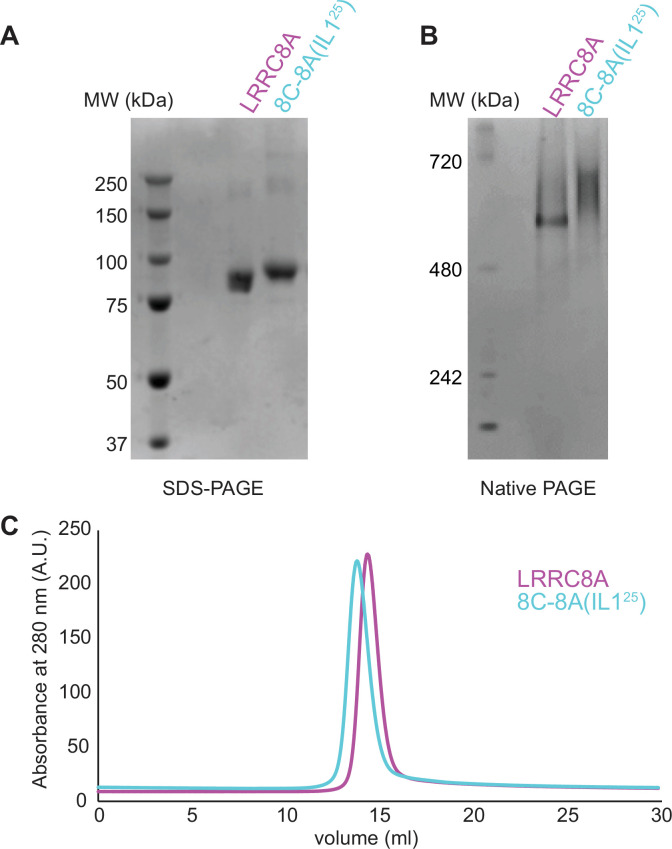
Figure 1—figure supplement 1. Purification of 8C-8A(IL125). SDS-PAGE (A), native-PAGE (B), and size exclusion chromatography (C) analysis of the purified LRRC8A and 8C-8A(IL125) proteins.
Figure 1—figure supplement 1. Purification of 8C-8A(IL125). SDS-PAGE (A), native-PAGE (B), and size exclusion chromatography (C) analysis of the purified LRRC8A and 8C-8A(IL125) proteins.CC BY · PubMed Central
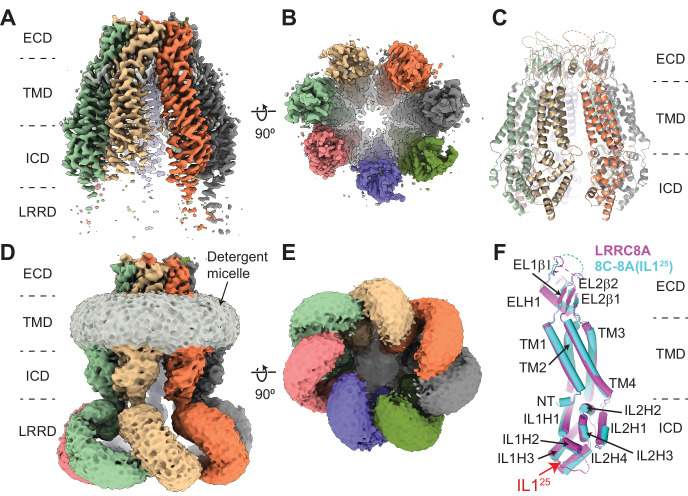
Figure 2. Cryo-electron microscopy (cryo-EM) structure of 8C-8A(IL125). (A–B) Cryo-EM maps of 8C-8A(IL125) class 1 structure viewed through the membrane plane (A) and from the cytoplasm (B). (C) Ribbon representation of the 8C-8A(IL125) class 1 structure viewed through the membrane plane. (D–E) Unsharpened cryo-EM maps of 8C-8A(IL125) class 1 structure viewed through the membrane plane (D) and from the cytoplasm (E), emphasizing low-resolution features. (F) Structural comparison of the 8C-8A(IL125) (cyan) and LRRC8A (magenta, PDB ID: 5ZSU) subunits.
Figure 2. Cryo-electron microscopy (cryo-EM) structure of 8C-8A(IL125). (A–B) Cryo-EM maps of 8C-8A(IL125) class 1 structure viewed through the membrane plane (A) and from the cytoplasm (B). (C) Ribbon representation of the 8C-8A(IL125) class 1 structure viewed through the membrane plane. (D–E) Unsharpened cryo-EM maps of 8C-8A(IL125) class 1 structure viewed through the membrane plane (D) and from the cytoplasm (E), emphasizing low-resolution features. (F) Structural comparison of the 8C-8A(IL125) (cyan) and LRRC8A (magenta, PDB ID: 5ZSU) subunits.CC BY · PubMed Central
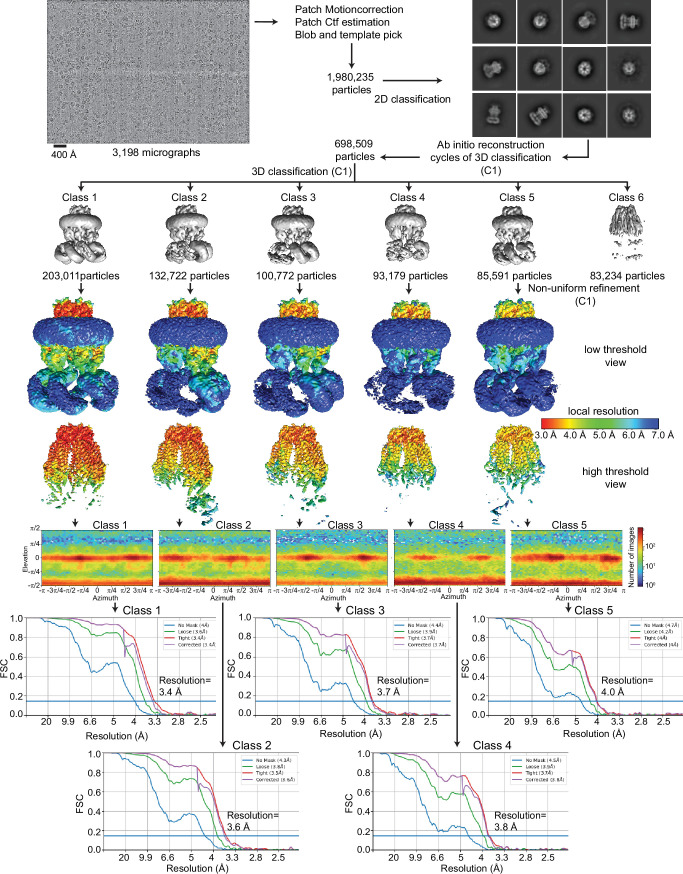
Figure 2—figure supplement 1. Cryo-electron microscopy (cryo-EM) analysis of 8C-8A(IL125). Flowchart detailing the particle selection and refinement procedure to obtain the cryo-EM maps of 8C-8A(IL125). Local resolution maps are shown on maps viewed at two different thresholds in Chimera. FSC curves and angular distributions are shown for the refined classes.
Figure 2—figure supplement 1. Cryo-electron microscopy (cryo-EM) analysis of 8C-8A(IL125). Flowchart detailing the particle selection and refinement procedure to obtain the cryo-EM maps of 8C-8A(IL125). Local resolution maps are shown on maps viewed at two different thresholds in Chimera. FSC curves and angular distributions are shown for the refined classes.CC BY · PubMed Central
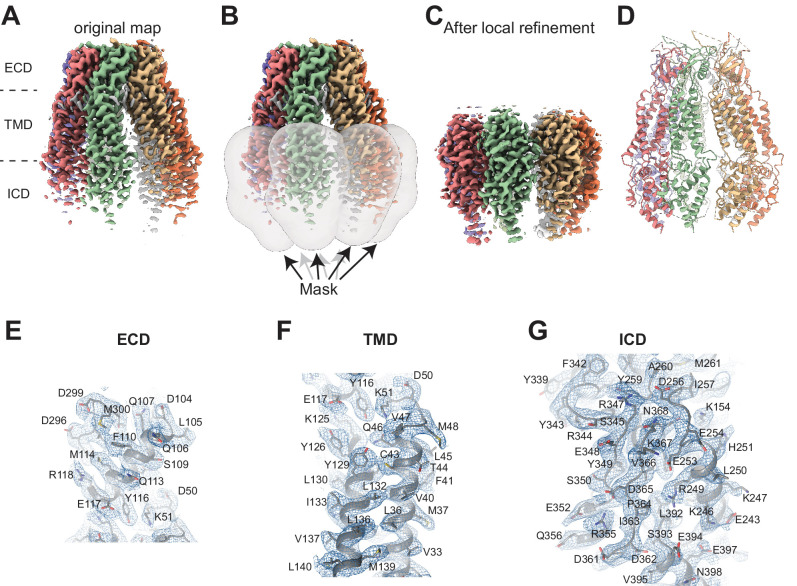
Figure 2—figure supplement 2. Cryo-electron microscopy (cryo-EM) analysis of 8C-8A(IL125). (A) Cryo-EM map of 8C-8A(IL125) class 1 structure colored by individual subunits. (B) Masks used for local refinement of individual subunits are shown as transparent gray surfaces. Each mask was used separately for local refinement. (C) The cryo-EM maps after local refinement for each subunit are aligned onto the original map. (D) Ribbon representation of the 8C-8A(IL125) structure. (E–F) Representative images of the cryo-EM density and the modeled structure covering parts of extracellular domain (ECD) (E), transmembrane domain (TMD) (F), and intracellular domain (ICD) (G). The map in panel (G) is obtained after local refinement, and the maps in panels (E) and (F) are the original maps.
Figure 2—figure supplement 2. Cryo-electron microscopy (cryo-EM) analysis of 8C-8A(IL125). (A) Cryo-EM map of 8C-8A(IL125) class 1 structure colored by individual subunits. (B) Masks used for local refinement of individual subunits are shown as transparent gray surfaces. Each mask was used separately for local refinement. (C) The cryo-EM maps after local refinement for each subunit are aligned onto the original map. (D) Ribbon representation of the 8C-8A(IL125) structure. (E–F) Representative images of the cryo-EM density and the modeled structure covering parts of extracellular domain (ECD) (E), transmembrane domain (TMD) (F), and intracellular domain (ICD) (G). The map in panel (G) is obtained after local refinement, and the maps in panels (E) and (F) are the original maps.CC BY · PubMed Central
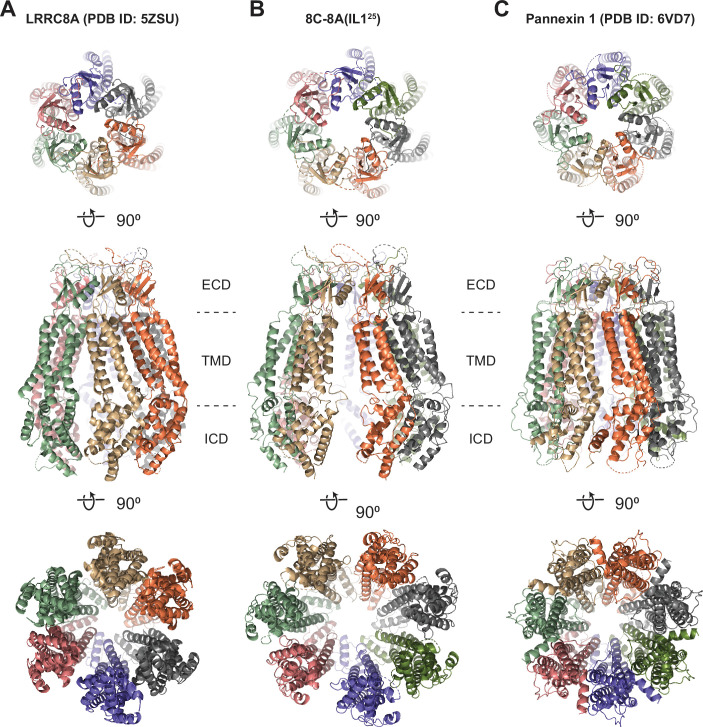
Figure 2—figure supplement 3. Structural comparison of 8C-8A(IL125) to LRRC8A and pannexins. (A–C) Ribbon representations of LRRC8A (PBD ID: 5ZSU) (A), 8C-8A(IL125) class 1 structure (B), and pannexin 1 (PDB ID: 6VD7) (C) viewed from the extracellular space (top), through the membrane plane (middle) and from the cytoplasm (bottom). Leucine-rich repeat motif-containing domains (LRRDs) for 8C-8A(IL125) and LRRC8A were not shown. Each subunit is colored differently.
Figure 2—figure supplement 3. Structural comparison of 8C-8A(IL125) to LRRC8A and pannexins. (A–C) Ribbon representations of LRRC8A (PBD ID: 5ZSU) (A), 8C-8A(IL125) class 1 structure (B), and pannexin 1 (PDB ID: 6VD7) (C) viewed from the extracellular space (top), through the membrane plane (middle) and from the cytoplasm (bottom). Leucine-rich repeat motif-containing domains (LRRDs) for 8C-8A(IL125) and LRRC8A were not shown. Each subunit is colored differently.CC BY · PubMed Central
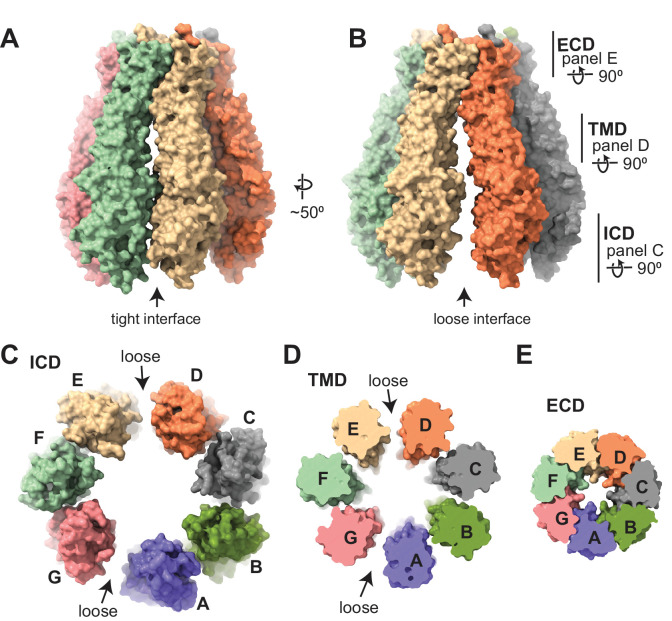
Figure 3. Subunit arrangement of the 8C-8A(IL125) chimera. (A–B) Surface representation of the 8C-8A(IL125) class 1 structure viewed from two sides, highlighting the ‘tight’ (A) and ‘loose’ (B) interfaces. (C–E) Intracellular domain (ICD), transmembrane domain (TMD), and extracellular domains (ECDs) are viewed from the cytoplasm with a depth of view, as shown in panel (B).
Figure 3. Subunit arrangement of the 8C-8A(IL125) chimera. (A–B) Surface representation of the 8C-8A(IL125) class 1 structure viewed from two sides, highlighting the ‘tight’ (A) and ‘loose’ (B) interfaces. (C–E) Intracellular domain (ICD), transmembrane domain (TMD), and extracellular domains (ECDs) are viewed from the cytoplasm with a depth of view, as shown in panel (B).CC BY · PubMed Central
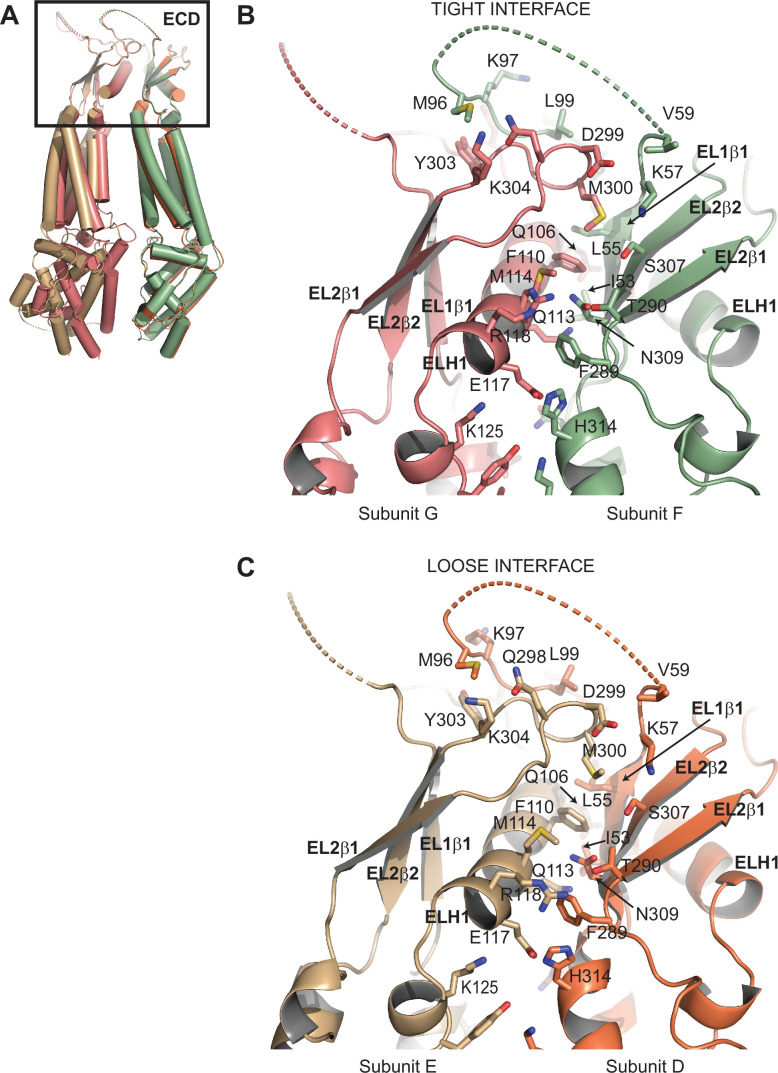
Figure 3—figure supplement 1. Comparison of subunit interfaces. (A) Overlay of two 8C-8A(IL125) subunit pairs of the class 1 structure that form tight and loose interfaces. Structures were aligned on their extracellular domains (ECDs). (B–C) Close-up view of the ECDs forming the tight (B) and loose (C) interfaces. Select residues at the interfaces are shown in stick representation and labeled.
Figure 3—figure supplement 1. Comparison of subunit interfaces. (A) Overlay of two 8C-8A(IL125) subunit pairs of the class 1 structure that form tight and loose interfaces. Structures were aligned on their extracellular domains (ECDs). (B–C) Close-up view of the ECDs forming the tight (B) and loose (C) interfaces. Select residues at the interfaces are shown in stick representation and labeled.CC BY · PubMed Central
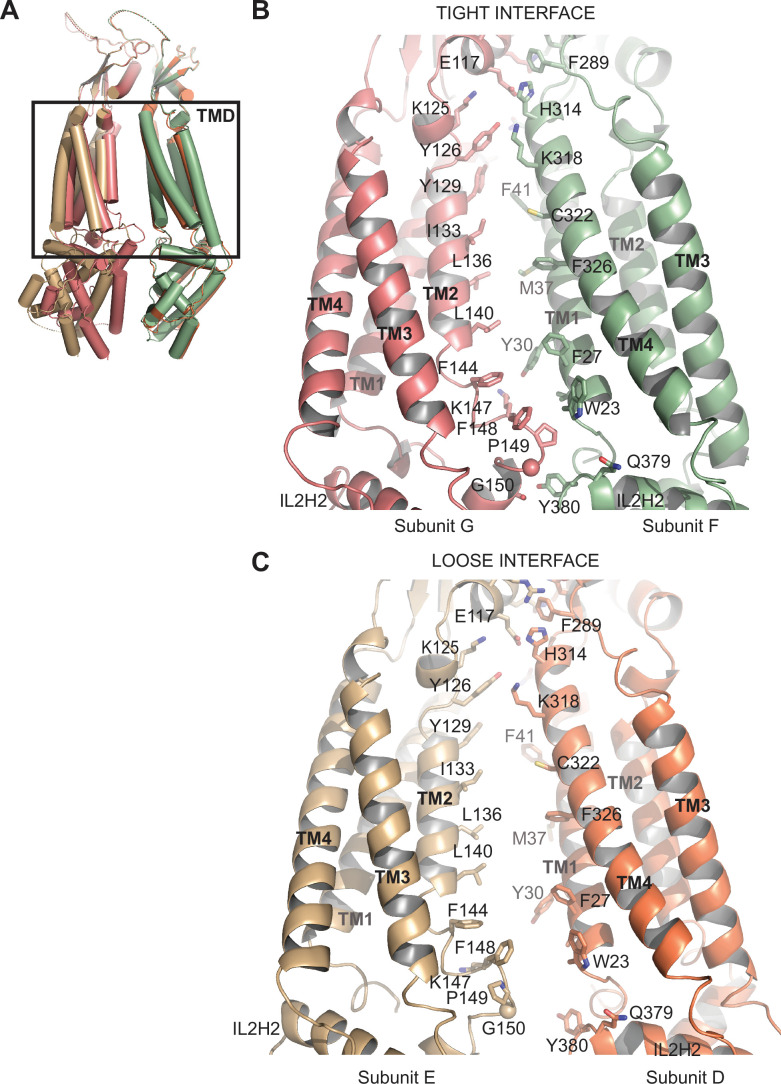
Figure 3—figure supplement 2. Comparison of subunit interfaces. (A) Overlay of two 8C-8A(IL125) subunit pairs of the class 1 structure that form tight and loose interfaces. Structures were aligned on their extracellular domains (ECDs). (B–C) Close-up view of the transmembrane domains (TMDs) forming the tight (B) and loose (C) interfaces. Select residues at the interfaces are shown in stick representation and labeled.
Figure 3—figure supplement 2. Comparison of subunit interfaces. (A) Overlay of two 8C-8A(IL125) subunit pairs of the class 1 structure that form tight and loose interfaces. Structures were aligned on their extracellular domains (ECDs). (B–C) Close-up view of the transmembrane domains (TMDs) forming the tight (B) and loose (C) interfaces. Select residues at the interfaces are shown in stick representation and labeled.CC BY · PubMed Central
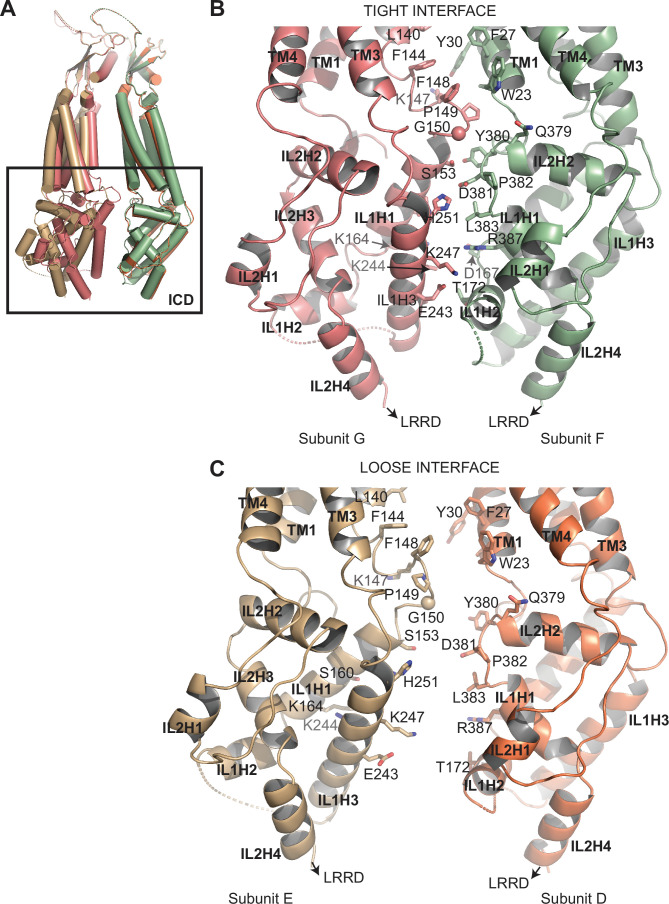
Figure 3—figure supplement 3. Comparison of subunit interfaces. (A) Overlay of two 8C-8A(IL125) subunit pairs of the class 1 structure that form tight and loose interfaces. Structures were aligned on their extracellular domains (ECDs). (B–C) Close-up view of the intracellular domains (ICDs) forming the tight (B) and loose (C) interfaces. Select residues at the interfaces are shown in stick representation and labeled.
Figure 3—figure supplement 3. Comparison of subunit interfaces. (A) Overlay of two 8C-8A(IL125) subunit pairs of the class 1 structure that form tight and loose interfaces. Structures were aligned on their extracellular domains (ECDs). (B–C) Close-up view of the intracellular domains (ICDs) forming the tight (B) and loose (C) interfaces. Select residues at the interfaces are shown in stick representation and labeled.CC BY · PubMed Central
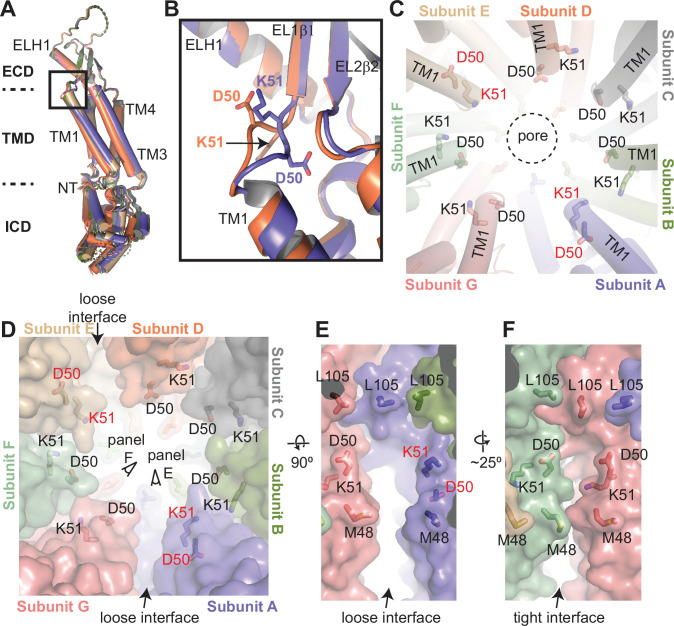
Figure 4. Structural heterogeneity of 8C-8A(IL125) protomers. (A) Structural comparison of the 8C-8A(IL125) subunits in the class 1 structure. The structures are aligned based on their extracellular domains (ECDs). (B) Close-up view of the box region in panel (A), highlighting the structural differences in the loop that connects transmembrane helix 1 (TM1) to EL1β1. Only two subunits are shown. (C) Close-up view of the pore around the residues D50 and K51, which are shown as sticks. The residues that adopt different conformations compared to others are labeled in red. The dashed circle indicates the pore-lining surface. (D) The same view as panel (C) but including the surface representation (transparent) to highlight the distinct interfaces between the subunits. (E–F) Close-up view of the interfaces from the points of view shown in panel (D).
Figure 4. Structural heterogeneity of 8C-8A(IL125) protomers. (A) Structural comparison of the 8C-8A(IL125) subunits in the class 1 structure. The structures are aligned based on their extracellular domains (ECDs). (B) Close-up view of the box region in panel (A), highlighting the structural differences in the loop that connects transmembrane helix 1 (TM1) to EL1β1. Only two subunits are shown. (C) Close-up view of the pore around the residues D50 and K51, which are shown as sticks. The residues that adopt different conformations compared to others are labeled in red. The dashed circle indicates the pore-lining surface. (D) The same view as panel (C) but including the surface representation (transparent) to highlight the distinct interfaces between the subunits. (E–F) Close-up view of the interfaces from the points of view shown in panel (D).CC BY · PubMed Central
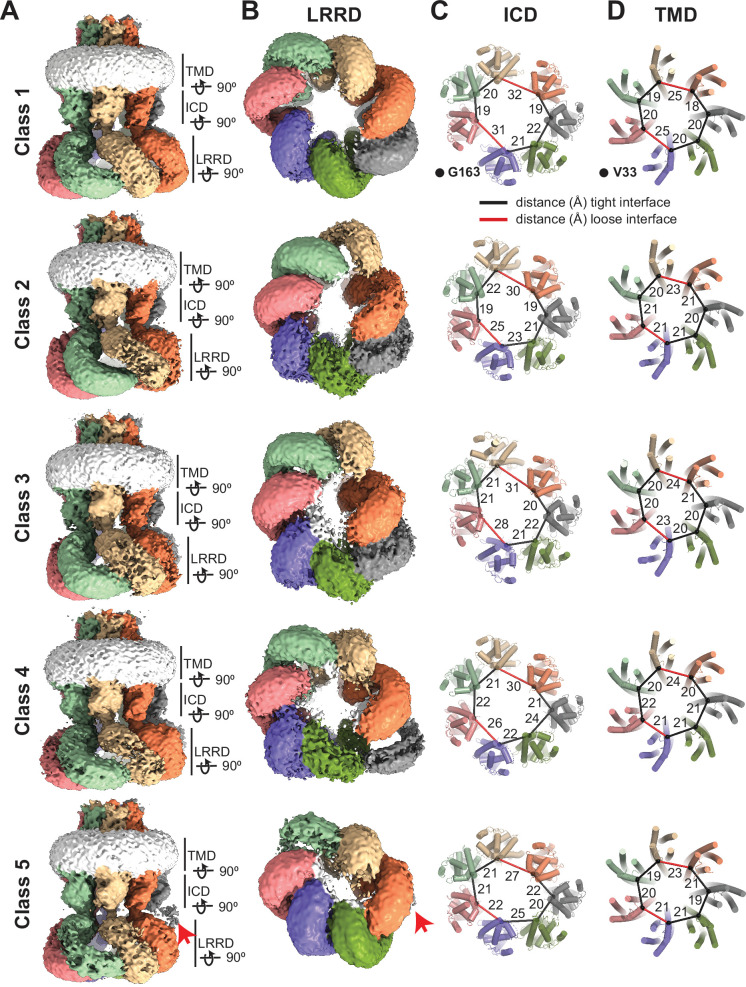
Figure 5. Conformational heterogeneity of 8C-8A(IL125) chimeras. (A–B) Cryo-electron microscopy (cryo-EM) maps (before sharpening) of 8C-8A(IL125) 3D classes viewed through the membrane plane (A) and from the cytoplasm (B). Individual subunits are colored as in Figure 1. The detergent micelle is shown in white. Red arrows point to the weak density of the leucine-rich repeat motif-containing domain (LRRD), which is not located within the LRRD quaternary assembly. Lines represent the depth of the view for LRRD, intracellular domain (ICD), and transmembrane domain (TMD). (C–D) Ribbon representation of the ICD (C) and TMD (D) structures viewed from the cytoplasm with a depth of view indicated in panel (A). The Cα atoms for G163 in ICD and V33 in TMD are shown as spheres. The distances between these atoms in neighboring subunits are shown as lines (in black and red for the tight and loose interfaces, respectively) and labeled in Å.
Figure 5. Conformational heterogeneity of 8C-8A(IL125) chimeras. (A–B) Cryo-electron microscopy (cryo-EM) maps (before sharpening) of 8C-8A(IL125) 3D classes viewed through the membrane plane (A) and from the cytoplasm (B). Individual subunits are colored as in Figure 1. The detergent micelle is shown in white. Red arrows point to the weak density of the leucine-rich repeat motif-containing domain (LRRD), which is not located within the LRRD quaternary assembly. Lines represent the depth of the view for LRRD, intracellular domain (ICD), and transmembrane domain (TMD). (C–D) Ribbon representation of the ICD (C) and TMD (D) structures viewed from the cytoplasm with a depth of view indicated in panel (A). The Cα atoms for G163 in ICD and V33 in TMD are shown as spheres. The distances between these atoms in neighboring subunits are shown as lines (in black and red for the tight and loose interfaces, respectively) and labeled in Å.CC BY · PubMed Central
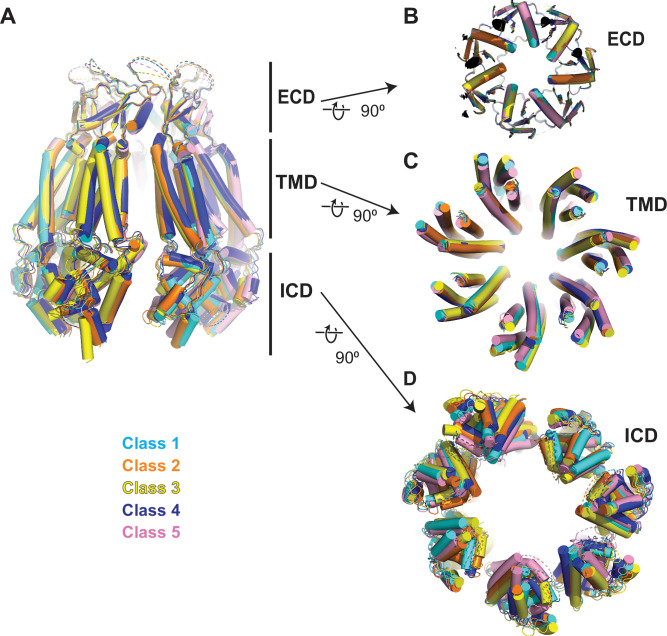
Figure 5—figure supplement 1. Comparison of 8C-8A(IL125) structures. (A) Overlay of 8C-8A(IL125) structures in different classes viewed through the membrane plane. (B–D) Overlay of 8C-8A(IL125) structures in different classes viewed from the intracellular space focusing on the extracellular domain (ECD) (B), transmembrane domain (TMD) (C), and intracellular domain (ICD) (D). Structures are aligned on their ECDs and colored as indicated in the figure. The depths of the views for panels (B)–(D) are indicated in panel (A) with straight lines.
Figure 5—figure supplement 1. Comparison of 8C-8A(IL125) structures. (A) Overlay of 8C-8A(IL125) structures in different classes viewed through the membrane plane. (B–D) Overlay of 8C-8A(IL125) structures in different classes viewed from the intracellular space focusing on the extracellular domain (ECD) (B), transmembrane domain (TMD) (C), and intracellular domain (ICD) (D). Structures are aligned on their ECDs and colored as indicated in the figure. The depths of the views for panels (B)–(D) are indicated in panel (A) with straight lines.CC BY · PubMed Central
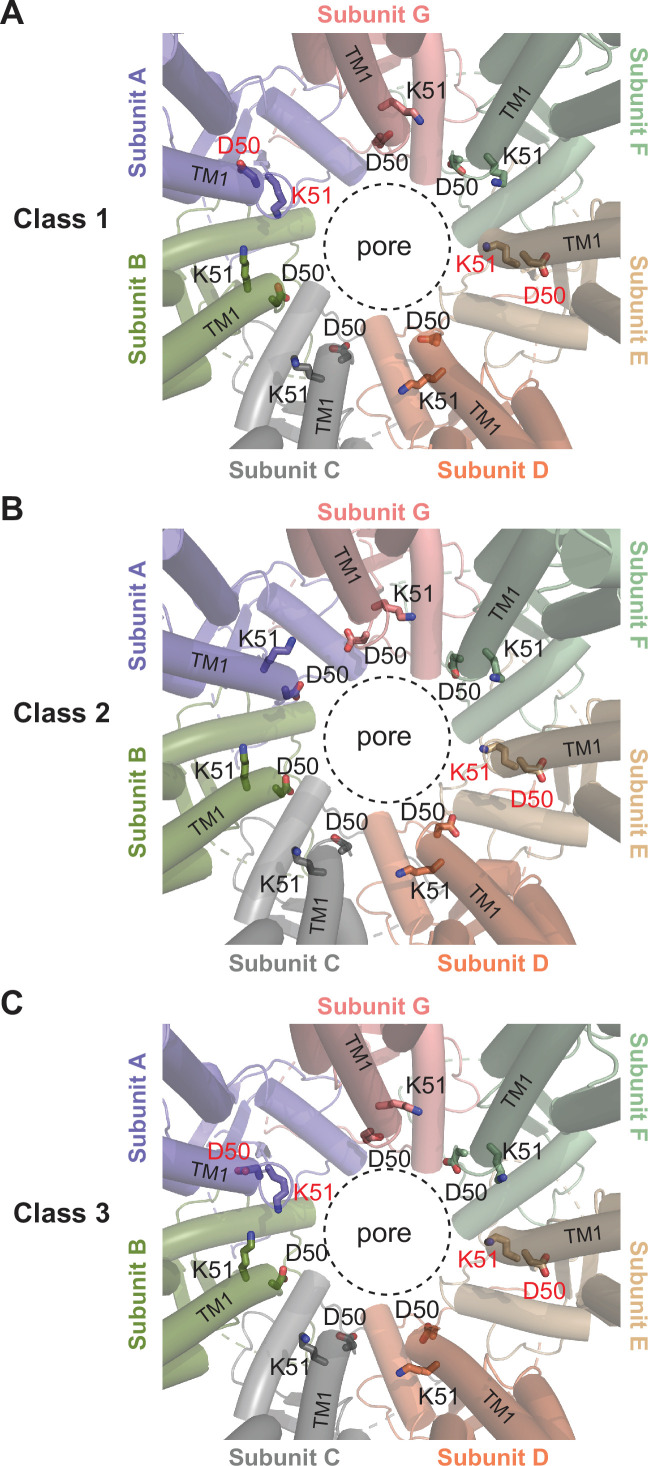
Figure 5—figure supplement 2. Comparison of the D40-K51 loop among different classes. Close-up view of the pore around the residues D50 and K51, which are shown as sticks. The residues that adopt different conformations compared to others are labeled in red. The dashed circle indicates the pore-lining surface.
Figure 5—figure supplement 2. Comparison of the D40-K51 loop among different classes. Close-up view of the pore around the residues D50 and K51, which are shown as sticks. The residues that adopt different conformations compared to others are labeled in red. The dashed circle indicates the pore-lining surface.CC BY · PubMed Central
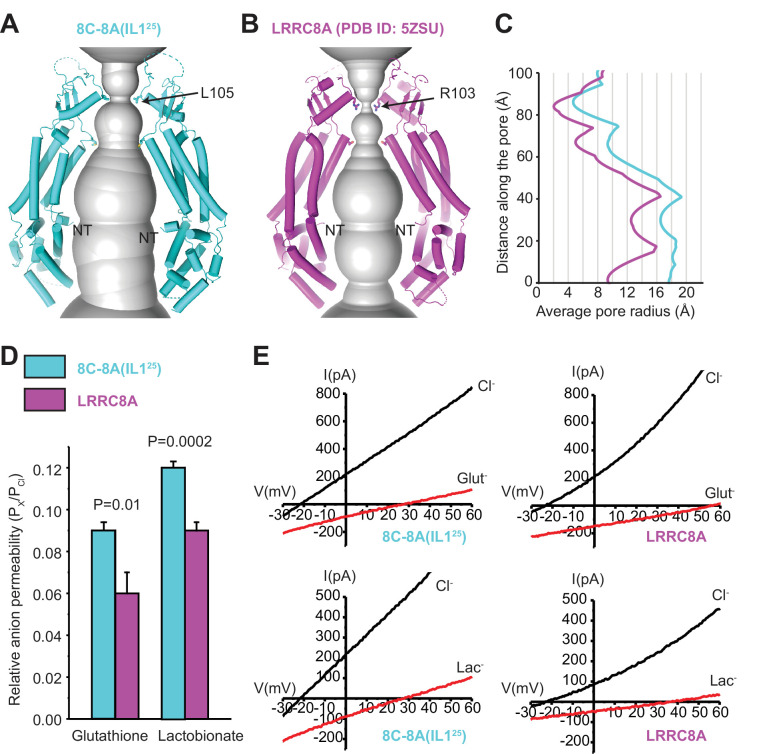
Figure 6. Comparison of channel pores. (A–B) Pore openings of the 8C-8A(IL125) heptameric channel (class 1 structure) (A) and LRRC8A (PDB ID: 5ZSU) homohexameric channel (B) calculated using the software program HOLE (Smart et al., 1996). Only two opposing subunits are shown. Residues forming the constriction sites are shown as sticks. The first modeled residues at the N-termini are labeled as NT. (C) 1D graph of the average radius along the length of the 8C-8A(IL125) (cyan) and LRRC8A (magenta) channel pores. (D) Relative (Px/PCl) glutathione and lactobionate permeabilities calculated from reversal potential changes induced by replacing bath Cl- with the test anion. Values are means ± SEM (N=4–7). Statistical significance was determined using Student’s unpaired t-test. (E) Representative LRRC8A and 8C-8A(IL125) current traces in the presence of bath Cl- or after substitution with glutathione (Glut-) or lactobionate (Lac-). Currents were elicited by ramping membrane voltage from −100 to +100 mV.
Figure 6. Comparison of channel pores. (A–B) Pore openings of the 8C-8A(IL125) heptameric channel (class 1 structure) (A) and LRRC8A (PDB ID: 5ZSU) homohexameric channel (B) calculated using the software program HOLE (Smart et al., 1996). Only two opposing subunits are shown. Residues forming the constriction sites are shown as sticks. The first modeled residues at the N-termini are labeled as NT. (C) 1D graph of the average radius along the length of the 8C-8A(IL125) (cyan) and LRRC8A (magenta) channel pores. (D) Relative (Px/PCl) glutathione and lactobionate permeabilities calculated from reversal potential changes induced by replacing bath Cl- with the test anion. Values are means ± SEM (N=4–7). Statistical significance was determined using Student’s unpaired t-test. (E) Representative LRRC8A and 8C-8A(IL125) current traces in the presence of bath Cl- or after substitution with glutathione (Glut-) or lactobionate (Lac-). Currents were elicited by ramping membrane voltage from −100 to +100 mV.CC BY · PubMed Central
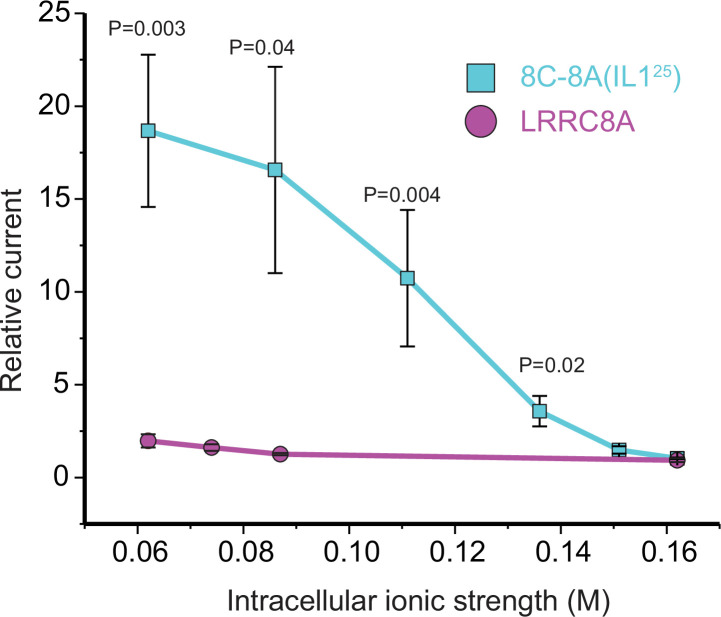
Figure 6—figure supplement 1. Effect of intracellular ionic strength on activation of LRRC8A and the 8C-8A(IL125) chimeric channel. The relative current was quantified as the fold change in current measured immediately after whole-cell access was achieved and currents measured 120 s later. As we have shown previously (Yamada et al., 2021), LRRC8A currents activate only very slowly when intracellular ionic strength is reduced from a normal level of 0.162 to 0.062 M. However, no statistically significant (p>0.9) current activation is detected 120 s after whole-cell access even at the lowest intracellular ionic strength of 0.062 M. In striking contrast, significant (p=0.02) 8C-8A(IL125) current is detected at an intracellular ionic strength of 0.136 M. Reducing ionic strength further leads to more rapid current activation and larger current amplitudes measured at 120 s. The effect of ionic strength on the rate of 8C-8A(IL125) current activation is similar to what we have reported previously for native VRAC/LRRC8 channels (Cannon et al., 1998). The current amplitude was quantified at +60 mV above the measured reversal potential. Values are means ± SEM (N=5–8). Statistical significance was determined using Student’s unpaired t-test.
Figure 6—figure supplement 1. Effect of intracellular ionic strength on activation of LRRC8A and the 8C-8A(IL125) chimeric channel. The relative current was quantified as the fold change in current measured immediately after whole-cell access was achieved and currents measured 120 s later. As we have shown previously (Yamada et al., 2021), LRRC8A currents activate only very slowly when intracellular ionic strength is reduced from a normal level of 0.162 to 0.062 M. However, no statistically significant (p>0.9) current activation is detected 120 s after whole-cell access even at the lowest intracellular ionic strength of 0.062 M. In striking contrast, significant (p=0.02) 8C-8A(IL125) current is detected at an intracellular ionic strength of 0.136 M. Reducing ionic strength further leads to more rapid current activation and larger current amplitudes measured at 120 s. The effect of ionic strength on the rate of 8C-8A(IL125) current activation is similar to what we have reported previously for native VRAC/LRRC8 channels (Cannon et al., 1998). The current amplitude was quantified at +60 mV above the measured reversal potential. Values are means ± SEM (N=5–8). Statistical significance was determined using Student’s unpaired t-test.CC BY · PubMed Central
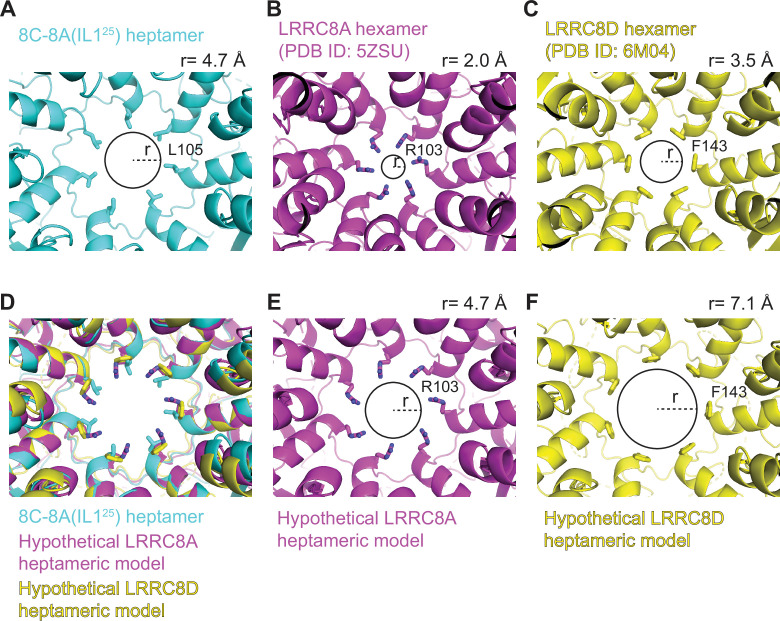
Figure 6—figure supplement 2. Heptameric oligomerization leads to larger pore sizes. (A–C) Close-up cytoplasmic view of the narrowest constriction sites of 8C-8A(IL125) class 1 structure (A), LRRC8A (PDB ID: 5ZSU) (B), and LRRC8D (PDB ID: 6M04) (C). (D) The heptameric LRRC8A and LRRC8D models were obtained by overlaying one of the LRRC8A or LRRC8D subunits on the seven subunits of 8C-8A(IL125) heptamer by aligning the extracellular domains (ECDs). (E–F) Pores of hypothetical LRRC8A (E) and LRRC8D (F) heptamers. Residues forming the constriction are shown as sticks. The circles and the dashed lines represent the solvent-accessible pore size and radius, respectively. The radii of the pores were calculated using the software HOLE (Smart et al., 1996) and shown on top of each panel.
Figure 6—figure supplement 2. Heptameric oligomerization leads to larger pore sizes. (A–C) Close-up cytoplasmic view of the narrowest constriction sites of 8C-8A(IL125) class 1 structure (A), LRRC8A (PDB ID: 5ZSU) (B), and LRRC8D (PDB ID: 6M04) (C). (D) The heptameric LRRC8A and LRRC8D models were obtained by overlaying one of the LRRC8A or LRRC8D subunits on the seven subunits of 8C-8A(IL125) heptamer by aligning the extracellular domains (ECDs). (E–F) Pores of hypothetical LRRC8A (E) and LRRC8D (F) heptamers. Residues forming the constriction are shown as sticks. The circles and the dashed lines represent the solvent-accessible pore size and radius, respectively. The radii of the pores were calculated using the software HOLE (Smart et al., 1996) and shown on top of each panel.CC BY · PubMed Central
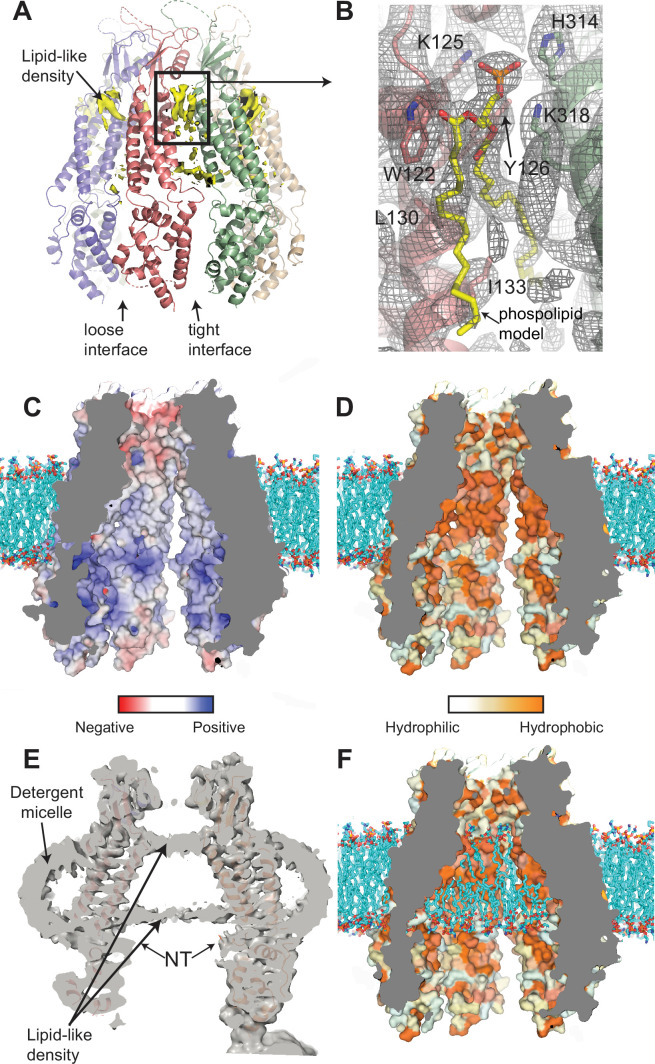
Figure 7. Interaction of lipids with the 8C-8A(IL125) chimera. (A) Ribbon representation of the 8C-8A(IL125) class 1 structure along with the lipid-like cryo-electron microscopy (cryo-EM) densities (yellow) between the subunits viewed through the membrane plane. Loose and tight interfaces are indicated with arrows. (B) Close-up views of the boxed regions in panel (A). The cryo-EM map for the entire region visualized is shown as gray mesh. The phospholipid molecule shown as yellow sticks within the lipid-like density is used for illustration purposes only and not included in the deposited coordinate files. Select residues near the lipid-like densities are shown as sticks and labeled. (C–D) Surface representation of the 8C-8A(IL125) pore colored based on electrostatic charge (C) and hydrophobicity (D). The hypothetical lipid bilayer around the transmembrane domain (TMD) is built using CHARMM-GUI (Wu et al., 2014) and shown as sticks (cyan). Positioning of the protein within the bilayer is calculated using PPM 2.0 (Lomize et al., 2012). (E) A sliced view of the unsharpened cryo-EM map (gray, transparent) with the ribbon representation of the 8C-8A(IL125) class 1 structure. Arrows indicate densities corresponding to pore-blocking lipid-like densities and detergent micelles. (F) Hypothetical interaction of lipids with the inner surface of the pore is shown by placing phospholipids using CHARMM-GUI (Wu et al., 2014). Surface representation of the 8C-8A(IL125) colored based on hydrophobicity as in panel (D).
Figure 7. Interaction of lipids with the 8C-8A(IL125) chimera. (A) Ribbon representation of the 8C-8A(IL125) class 1 structure along with the lipid-like cryo-electron microscopy (cryo-EM) densities (yellow) between the subunits viewed through the membrane plane. Loose and tight interfaces are indicated with arrows. (B) Close-up views of the boxed regions in panel (A). The cryo-EM map for the entire region visualized is shown as gray mesh. The phospholipid molecule shown as yellow sticks within the lipid-like density is used for illustration purposes only and not included in the deposited coordinate files. Select residues near the lipid-like densities are shown as sticks and labeled. (C–D) Surface representation of the 8C-8A(IL125) pore colored based on electrostatic charge (C) and hydrophobicity (D). The hypothetical lipid bilayer around the transmembrane domain (TMD) is built using CHARMM-GUI (Wu et al., 2014) and shown as sticks (cyan). Positioning of the protein within the bilayer is calculated using PPM 2.0 (Lomize et al., 2012). (E) A sliced view of the unsharpened cryo-EM map (gray, transparent) with the ribbon representation of the 8C-8A(IL125) class 1 structure. Arrows indicate densities corresponding to pore-blocking lipid-like densities and detergent micelles. (F) Hypothetical interaction of lipids with the inner surface of the pore is shown by placing phospholipids using CHARMM-GUI (Wu et al., 2014). Surface representation of the 8C-8A(IL125) colored based on hydrophobicity as in panel (D).CC BY · PubMed Central
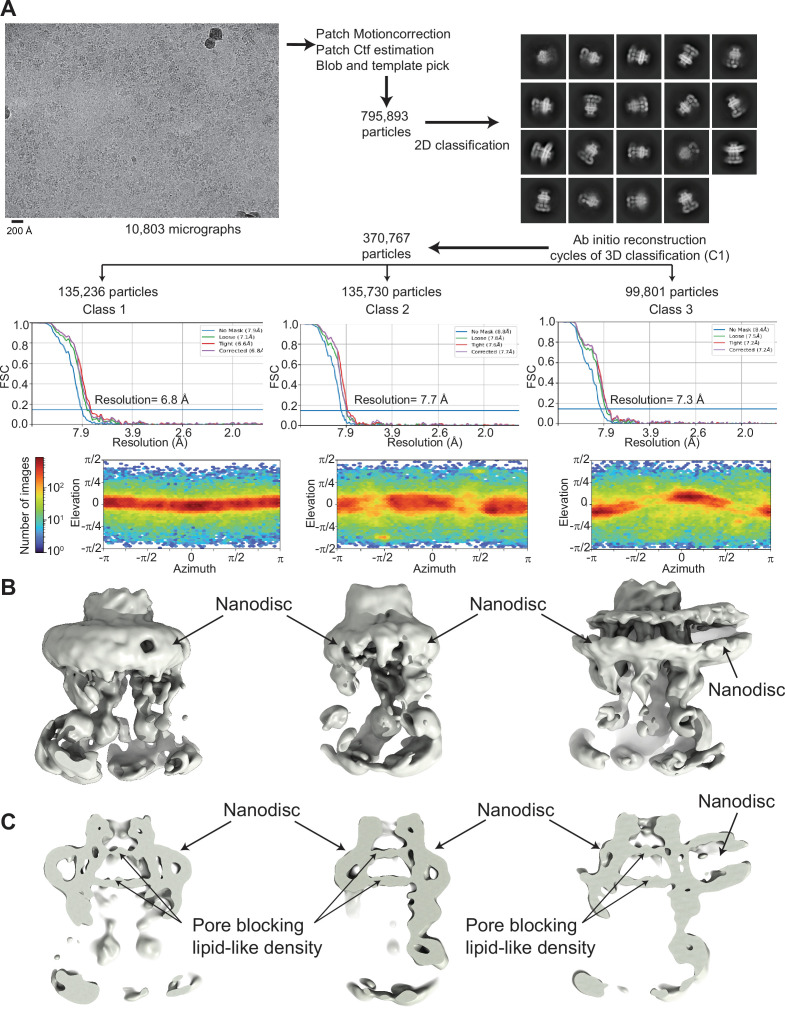
Figure 7—figure supplement 1. Cryo-electron microscopy (cryo-EM) analysis of 8C-8A(IL125) reconstituted in nanodiscs. (A) Flowchart detailing the particle selection and refinement procedure to obtain the cryo-EM maps of the 8C-8A(IL125) nanodiscs. FSC curves and angular distributions are shown. (B–C) Full (B) and sliced (C) views of the cryo-EM maps of the 8C-8A(IL125) nanodiscs.
Figure 7—figure supplement 1. Cryo-electron microscopy (cryo-EM) analysis of 8C-8A(IL125) reconstituted in nanodiscs. (A) Flowchart detailing the particle selection and refinement procedure to obtain the cryo-EM maps of the 8C-8A(IL125) nanodiscs. FSC curves and angular distributions are shown. (B–C) Full (B) and sliced (C) views of the cryo-EM maps of the 8C-8A(IL125) nanodiscs.CC BY · PubMed Central

Verification

Claims the paper makes

The claims and statistics of this paper haven’t been checked yet.

Run the check — free, no account needed. It reads the open-access text and checks the sources it cites.

A few free checks a day · papers already verified open instantly · results are public

Self-check

Percentages, sums and reported differences re-computed from the paper’s own numbers.

The self-check needs the paper’s full text.

Citations

Cites

Show all 1 references

Research works printed but not linked: 60

  1. 10.1085/jgp.201812138 · DOI
  2. 10.1038/nrm.2016.29 · DOI
  3. 10.1126/science.1252826 · DOI
  4. 10.1016/j.cell.2014.03.024 · DOI · Paper page
  5. 10.1002/bies.201100173 · DOI
  6. 10.1016/j.cell.2015.12.031 · DOI
  7. Kern, D. M. , Oh, S. , Hite, R. K. & Brohawn, S. G. Cryo-EM structures of the DCPIB-inhibited volume-regulated anion channel LRRC8A in lipid nanodiscs. Elife 8 (2019). · DOI
  8. 10.1038/s41594-018-0109-6 · DOI
  9. Kefauver, J. M. et al. Structure of the human volume regulated anion channel. Elife 7 (2018). · DOI
  10. 2018, Structure of a volume-regulated anion channel of the LRRC8 family, Nature, 558, 254, 10.1038/s41586-018-0134-y · DOI
  11. 2021, Allosteric modulation of LRRC8 channels by targeting their cytoplasmic domains, Nat Commun, 12, 5435, 10.1038/s41467-021-25742-w · DOI
  12. 2020, Cryo-EM structure of the volume-regulated anion channel LRRC8D isoform identifies features important for substrate permeation, Commun Biol, 3, 240, 10.1038/s42003-020-0951-z · DOI
  13. 2021, LRRC8A homohexameric channels poorly recapitulate VRAC regulation and pharmacology, Am. J Physiol Cell Physiol, 320, C293, 10.1152/ajpcell.00454.2020 · DOI
  14. 10.1085/jgp.201812016 · DOI
  15. 10.1074/jbc.RA118.002853 · DOI
  16. 10.1038/s41586-020-2357-y · DOI
  17. 10.1038/s41422-020-0298-5 · DOI
  18. 10.1038/s41594-020-0401-0 · DOI
  19. Michalski, K. et al. The Cryo-EM structure of pannexin 1 reveals unique motifs for ion selection and inhibition. Elife 9 (2020). · DOI
  20. Bhat, E. A. & Sajjad, N. Human Pannexin 1 channel: Insight in structure-function mechanism and its potential physiological roles. Mol Cell Biochem (2021). · DOI
  21. 2020, Cryo-EM structures of human pannexin 1 channel, Cell Res, 30, 449, 10.1038/s41422-020-0310-0 · DOI
  22. 10.1038/s41422-020-0313-x · DOI
  23. 2022, Structures of human pannexin-1 in nanodiscs reveal gating mediated by dynamic movement of the N terminus and phospholipids, Sci Signal, 15, eabg6941, 10.1126/scisignal.abg6941 · DOI
  24. 10.1126/sciadv.aax3157 · DOI
  25. 10.1016/j.bpj.2016.08.030 · DOI
  26. 10.1016/j.febslet.2004.09.051 · DOI
  27. 10.1038/sj.bjp.0702770 · DOI
  28. 10.1007/s11302-005-1557-0 · DOI
  29. Friard, J. et al. Comparative effects of chloride channel Inhibitors on LRRC8/VRAC-mediated chloride conductance. Front Pharmacol 328 (2017). · DOI
  30. 10.1074/jbc.M702422200 · DOI
  31. 10.1038/ncomms14324 · DOI
  32. 10.1126/scisignal.2005431 · DOI
  33. 2021, On the molecular nature of large-pore channels, J Mol Biol, 433, 166994, 10.1016/j.jmb.2021.166994 · DOI
  34. 10.1038/s41594-019-0369-9 · DOI
  35. Drożdżyk, K. et al. Cryo-EM structures and functional properties of CALHM channels of the human placenta. Elife 9 (2020). · DOI
  36. Reddy, B. , Bavi, N. , Lu, A. , Park, Y. & Perozo, E. Molecular basis of force-from-lipids gating in the mechanosensitive channel MscS. Elife 8 (2019). · DOI
  37. 10.1016/j.jmb.2019.07.006 · DOI
  38. 10.1038/s41586-021-03196-w · DOI
  39. 10.1146/annurev-physiol-021317-121351 · DOI
  40. 10.1016/S0959-440X(01)00266-4 · DOI
  41. 10.2174/0929866526666181208170027 · DOI · Paper page
  42. 10.1007/s00018-008-8019-0 · DOI
  43. Ju, L. , Chen, Y. , Xue, L. , Du, X. & Zhu, C. Cooperative unfolding of distinctive mechanoreceptor domains transduces force into signals. Elife 10 (2016). · DOI
  44. 10.1016/j.bpj.2015.08.050 · DOI
  45. König, B. , Hao, Y. , Schwartz, S. , Plested, A. J. & Stauber, T. A FRET sensor of C-terminal movement reveals VRAC activation by plasma membrane DAG signaling rather than ionic strength. Elife 8 (2019). · DOI
  46. 10.1038/nmeth983 · DOI · Paper page
  47. 10.1074/jbc.M609589200 · DOI
  48. 10.1016/S0076-6879(09)64011-8 · DOI
  49. 10.1016/j.jsb.2005.07.007 · DOI
  50. 10.1038/nmeth.4169 · DOI · Paper page
  51. 10.1038/nmeth.4193 · DOI
  52. Zivanov, J. et al. New tools for automated high-resolution cryo-EM structure determination in RELION-3. Elife 7 (2018). · DOI
  53. 10.1107/S0907444904019158 · DOI · Paper page
  54. 10.1093/NAR/GKAB1061 · DOI · Paper page
  55. 2013, New tool: phenix. real_space_refine, Computational Crystallography Newsletter, 4, 43
  56. 10.1002/pro.3330 · DOI · Paper page
  57. 10.7554/eLife.01456 · DOI
  58. 10.1002/jcc.20084 · DOI
  59. 10.1002/PRO.3943 · DOI
  60. 10.1016/S0263-7855(97)00009-X · DOI

Metadata

Authors
Takahashi, H., Yamada, T., Denton, J. S., Strange, K., & Karakas, E.
Affiliations
  • Vanderbilt University (US)
  • Vanderbilt University Medical Center (US)
Venue
eLife
Publisher
openRxiv
Published
2022-07-28
Volume
12
ISSN
2050-084X (ISSN-L)
OpenAlex
W4323812162
Cited by
35
References
1
Citations by year
2026: 11 · 2025: 8 · 2024: 8 · 2023: 7 · 2022: 1
FWCI
3.02
Type
journal article
Language
en
Open access
Licence
cc-by
Locations
  • eLife (publishedVersion, cc-by)
  • bioRxiv (Cold Spring Harbor Laboratory) (acceptedVersion, cc-by-nc-nd)
  • PubMed Central (publishedVersion, cc-by)
  • PubMed (publishedVersion)
  • DOAJ (DOAJ: Directory of Open Access Journals) (submittedVersion, cc-by-sa)
Funders
  • Vanderbilt University
  • Case Western Reserve University
  • National Institutes of Health (1s10od030292-01)
  • National Institute of Diabetes and Digestive and Kidney Diseases (DK 51610, R01DK051610)
  • National Center for Research Resources (S10RR031634)
Topics
  • Life Sciences › Biochemistry, Genetics and Molecular Biology › Molecular Biology › Ion channel regulation and function
  • Life Sciences › Biochemistry, Genetics and Molecular Biology › Molecular Biology › Ion Transport and Channel Regulation
  • Life Sciences › Neuroscience › Sensory Systems › Ion Channels and Receptors
Keywords
volume-regulated anion channel, LRRC8A, chimeric channels, channel structure, DCPIB, channel gating, pannexin channels, homomeric channels
MeSH terms
Anions, Biological Transport, Membrane Proteins, Cryoelectron Microscopy

About these checks

Registry, retraction, Cites and statistics results are computed, not judged, with one exception: a printed reference that no index lists is read once by a model before it counts as a citation error. Claims are extracted by a model and kept only when their quote appears verbatim in the text; each cited source is then checked, with a model’s help, for whether it says what the claim relies on. Those verdicts can be wrong — read the claim’s quote and the cited source before relying on one.

Statistics and arithmetic are recomputed, not judged.

Confidence bands are shown only for fields calibrated on our annotated test set. None is calibrated yet, so no band is shown.

What counts as a claim ›How we measure confidence ›How we check this ›

Are you an author, or do you see a problem with this page? Request a review

How to cite

Cite CoChat for the checks on this page, and the paper for its own findings.

This page
CoChat. (2026). Citation check: Structure of a LRRC8 chimera with physiologically relevant properties reveals heptameric assembly and pore-blocking lipids. https://app.cochat.ai/papers/10.1101/2022.07.28.501913
The paper
Takahashi, H., Yamada, T., Denton, J. S., Strange, K., & Karakas, E. (2022). Structure of a LRRC8 chimera with physiologically relevant properties reveals heptameric assembly and pore-blocking lipids. eLife. https://doi.org/10.1101/2022.07.28.501913