PreprintCited by 29Plant Molecular Biology ResearchRNA modifications and cancerRNA Research and Splicing

The DOI matches its Crossref record; 2 of the 2 references it cites were found in a registry or an index.

Insights into the conservation and diversification of the molecular functions of YTHDF proteins

Open access
Flores-Téllez, Daniel, Tankmar, Mathias Due, von Bülow, Sören, Chen, Junyu, Lindorff-Larsen, Kresten, Brodersen, Peter, Arribas-Hernández, Laura·2022·PLoS Genetics

Preprint — published as 10.1371/journal.pgen.1010980

Abstract

YT521-B homology (YTH) domain proteins act as readers of N6 -methyladenosine (m 6 A) in mRNA. Members of the YTHDF clade determine properties of m 6 A-containing mRNAs in the cytoplasm. Vertebrates encode three YTHDF proteins whose possible functional specialization is debated. In land plants, the YTHDF clade has expanded from one member in basal lineages to eleven so-called EVOLUTIONARILY CONSERVED C-TERMINAL REGION1-11 (ECT1-11) proteins in Arabidopsis thaliana , named after the conserved YTH domain placed behind a long N-terminal intrinsically disordered region (IDR). ECT2 , ECT3 and ECT4 show genetic redundancy in stimulation of primed stem cell division, but the origin and implications of YTHDF expansion in higher plants are unknown, as it is unclear whether it involves acquisition of fundamentally different molecular properties, in particular of their divergent IDRs. Here, we use functional complementation of ect2 / ect3 / ect4 mutants to test whether different YTHDF proteins can perform the same function when similarly expressed in leaf primordia. We show that stimulation of primordial cell division relies on an ancestral molecular function of the m 6 A-YTHDF axis in land plants that is present in bryophytes and is conserved over YTHDF diversification, as it appears in all major clades of YTHDF proteins in flowering plants. Importantly, although our results indicate that the YTH domains of all arabidopsis ECT proteins have m 6 A-binding capacity, lineage-specific neo-functionalization of ECT1, ECT9 and ECT11 happened after late duplication events, and involves altered properties of both the YTH domains, and, especially, of the IDRs. We also identify two biophysical properties recurrent in IDRs of YTHDF proteins able to complement ect2 ect3 ect4 mutants, a clear phase separation propensity and a charge distribution that creates electric dipoles. Human and fly YTHDFs do not have IDRs with this combination of properties and cannot replace ECT2/3/4 function in arabidopsis, perhaps suggesting different molecular activities of YTHDF proteins between major taxa. Author Summary: Regulation of gene expression is essential to life. It ensures correct balancing of cellular activities and the controlled proliferation and differentiation necessary for the development of multicellular organisms. Methylation of adenosines in mRNA (m 6 A) contributes to genetic control, and absence of m 6 A impairs embryo development in plants and vertebrates. m 6 A-dependent regulation can be exerted by a group of cytoplasmic proteins called YTHDFs. Higher plants have many more YTHDFs than animals, but it is unknown whether these many YTHDF proteins carry out fundamentally different or roughly the same molecular functions, as only a small fraction of them have been studied thus far. This work addresses the origin and reasons behind YTHDF expansion during land plant evolution and reveals that most YTHDFs in flowering plants have the same molecular functions that facilitate rapid division of differentiating stem cells. Remarkably, this molecular activity is present in the most basal lineage of land plants and functions similarly across 450 million years of land plant evolution. We also identified a few plant YTHDF proteins with divergent molecular function despite their ability to bind to m 6 A. Our work provides a firm basis for further advances on understanding molecular properties and biological contexts underlying YTHDF diversification.

Overview

The claims and statistics of this paper haven’t been checked yet.

Run the check — free, no account needed. It reads the open-access text and checks the sources it cites.

A few free checks a day · papers already verified open instantly · results are public

Integrity signals

Registry

Crossref · 10.1101/2022.10.19.512826

Cites

2 of 2 references verified0 citation errors · 0 not checkable

Statistics

Figures

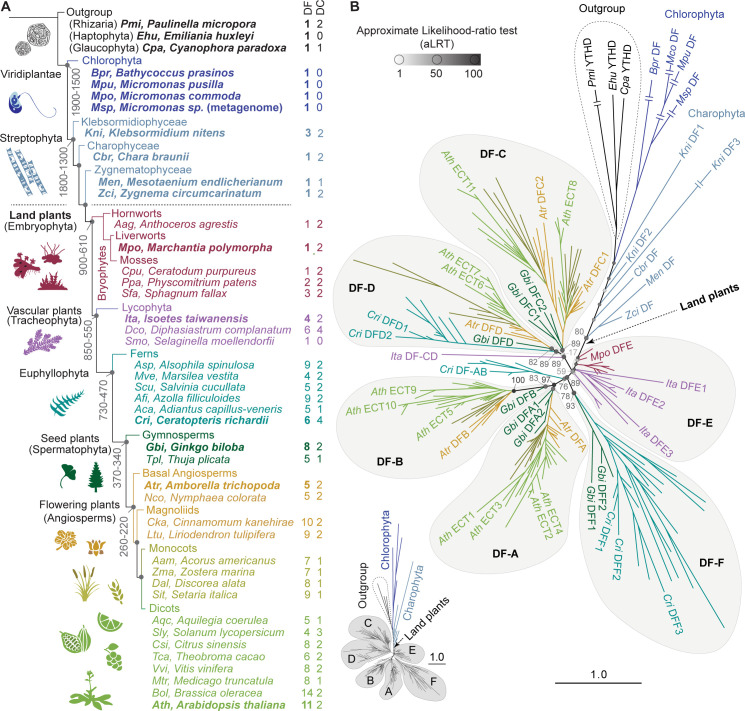
Fig 1 Phylogenetic analysis of YTHDF proteins in plants. (A) Schematic representation of Viridiplantae evolution and relative position of the species used in this study. The architecture of the diagram and the age (million years, My) indicated on some nodes are a simplified version of the trees from Su et al. [59] and Bowman [62]. The length of the branches has been adjusted for illustrative purposes. (B) Phylogenetic tree of YTHDF proteins in plants (S1–S4 Datasets), with color-coding and abbreviations of species names as in A. Three YTHDF proteins from taxa outside but evolutionarily close to Viridiplantae are included as outgroup. Arabidopsis thaliana (Ath) YTHDF proteins are named after the original nomenclature for proteins containing an Evolutionarily Conserved C-Terminal Region (ECT) established by Ok et al. [40]. Proteins from other plant species adhere to the nomenclature established by Scutenaire et al. [26], with small variations reflecting additional clades (DF-E, -F) and the split of the original DF-C clade into -C and -D. Statistical support is calculated as approximate likelihood-ratio test (aLRT), and indicated by grayscale-coded spheres and values on the most relevant nodes. For simplicity, only a subset of proteins is labelled–those from one representative species of the main taxa highlighted in bold in A–, but a comprehensive representation of the same tree with all protein names and aLRT values is available in S1 Fig. The length of the branches represents the evolutionary distance in number of amino acid substitutions per site relative to the scale bar. Double lines crossing the longest branches indicate that the branch has been collapsed due to space problems, but a schematic representation of their relative lengths is shown on the lower-left corner, and not-collapsed branches can be found in S1 Fig.
Fig 1 Phylogenetic analysis of YTHDF proteins in plants. (A) Schematic representation of Viridiplantae evolution and relative position of the species used in this study. The architecture of the diagram and the age (million years, My) indicated on some nodes are a simplified version of the trees from Su et al. [59] and Bowman [62]. The length of the branches has been adjusted for illustrative purposes. (B) Phylogenetic tree of YTHDF proteins in plants (S1–S4 Datasets), with color-coding and abbreviations of species names as in A. Three YTHDF proteins from taxa outside but evolutionarily close to Viridiplantae are included as outgroup. Arabidopsis thaliana (Ath) YTHDF proteins are named after the original nomenclature for proteins containing an Evolutionarily Conserved C-Terminal Region (ECT) established by Ok et al. [40]. Proteins from other plant species adhere to the nomenclature established by Scutenaire et al. [26], with small variations reflecting additional clades (DF-E, -F) and the split of the original DF-C clade into -C and -D. Statistical support is calculated as approximate likelihood-ratio test (aLRT), and indicated by grayscale-coded spheres and values on the most relevant nodes. For simplicity, only a subset of proteins is labelled–those from one representative species of the main taxa highlighted in bold in A–, but a comprehensive representation of the same tree with all protein names and aLRT values is available in S1 Fig. The length of the branches represents the evolutionary distance in number of amino acid substitutions per site relative to the scale bar. Double lines crossing the longest branches indicate that the branch has been collapsed due to space problems, but a schematic representation of their relative lengths is shown on the lower-left corner, and not-collapsed branches can be found in S1 Fig.CC BY · PubMed Central
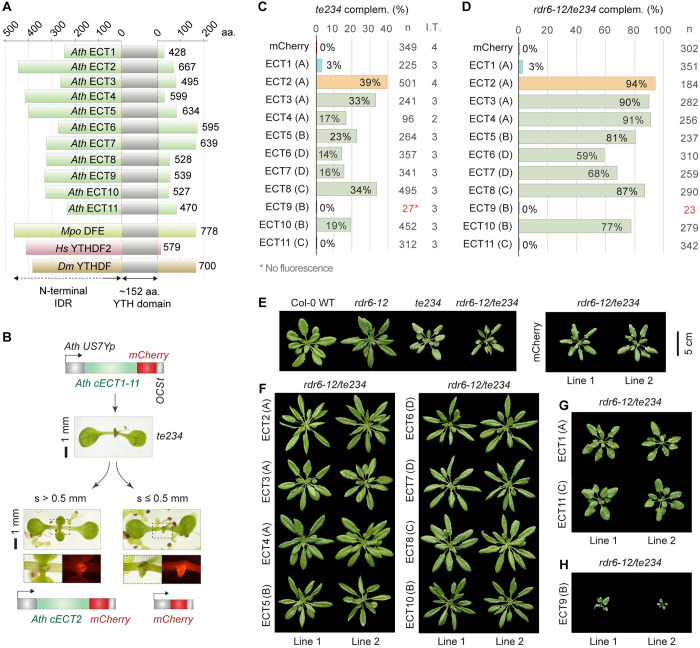
Fig 2 Most but not all arabidopsis YTHDF proteins can replace ECT2/3/4-function. (A) Diagram showing the relative length of the N-terminal IDRs of Arabidopsis thaliana (Ath) YTHDF proteins (ECT1-ECT11) together with Marchantia polymorpha (Mpo) DFE, Homo sapiens (Hs) YTHDF2, and Drosophila melanogaster (Dm) YTHDF. Numbers indicate the length of the proteins in amino acids (aa). (B) Strategy followed for the functional assay. US7Yp:cECT(X)-mCherry constructs are introduced in ect2-1/ect3-1/ect4-2 (te234) plants, and complementation rates are estimated by the percentage of primary transformants (T1) whose first true leaves have a size (s) exceeding 0.5 mm after 10 days of growth. The construct US7Yp:mCherry is used as negative control. Examples of T1 seedlings expressing control and ECT2 constructs are shown. Dashed outlines are magnified below to show mCherry fluorescence in emerging leaves. (C) Weighed averages of the complementation percentages observed for each US7Yp:cECT(X)-mCherry construct in 2–5 independent transformations (I.T.). Letters between parenthesis indicate the DF- clade assigned to each protein. Colouring highlights ECT2 (reference) and proteins with low or negligible complementation capacity (ECT1/9/11) for fast identification along the manuscript. Low transformation efficiency (T.E.) for ECT9 can be inferred by the low number of transformants (n) highlighted in red, but detailed T.E. and raw complementation rates in each transformation can be found in S9 and S7A Figs respectively. Additional data regarding this assay is shown in S8 Fig. (D) Same as C on a single transformation using the rdr6-12/te234 background. (E-H) Rosette phenotype of 32-day-old T1s bearing US7Yp:cECT(X)-mCherry constructs in the rdr6-12/te234 background, sorted according to their degree of complementation in three panels: F (high), G (residual) and H (non-complementation and enhancement). Different genetic backgrounds and control transformants (mCherry) are shown in E as a reference. The scalebar (5 cm) applies to all plants in the four panels.
Fig 2 Most but not all arabidopsis YTHDF proteins can replace ECT2/3/4-function. (A) Diagram showing the relative length of the N-terminal IDRs of Arabidopsis thaliana (Ath) YTHDF proteins (ECT1-ECT11) together with Marchantia polymorpha (Mpo) DFE, Homo sapiens (Hs) YTHDF2, and Drosophila melanogaster (Dm) YTHDF. Numbers indicate the length of the proteins in amino acids (aa). (B) Strategy followed for the functional assay. US7Yp:cECT(X)-mCherry constructs are introduced in ect2-1/ect3-1/ect4-2 (te234) plants, and complementation rates are estimated by the percentage of primary transformants (T1) whose first true leaves have a size (s) exceeding 0.5 mm after 10 days of growth. The construct US7Yp:mCherry is used as negative control. Examples of T1 seedlings expressing control and ECT2 constructs are shown. Dashed outlines are magnified below to show mCherry fluorescence in emerging leaves. (C) Weighed averages of the complementation percentages observed for each US7Yp:cECT(X)-mCherry construct in 2–5 independent transformations (I.T.). Letters between parenthesis indicate the DF- clade assigned to each protein. Colouring highlights ECT2 (reference) and proteins with low or negligible complementation capacity (ECT1/9/11) for fast identification along the manuscript. Low transformation efficiency (T.E.) for ECT9 can be inferred by the low number of transformants (n) highlighted in red, but detailed T.E. and raw complementation rates in each transformation can be found in S9 and S7A Figs respectively. Additional data regarding this assay is shown in S8 Fig. (D) Same as C on a single transformation using the rdr6-12/te234 background. (E-H) Rosette phenotype of 32-day-old T1s bearing US7Yp:cECT(X)-mCherry constructs in the rdr6-12/te234 background, sorted according to their degree of complementation in three panels: F (high), G (residual) and H (non-complementation and enhancement). Different genetic backgrounds and control transformants (mCherry) are shown in E as a reference. The scalebar (5 cm) applies to all plants in the four panels.CC BY · PubMed Central
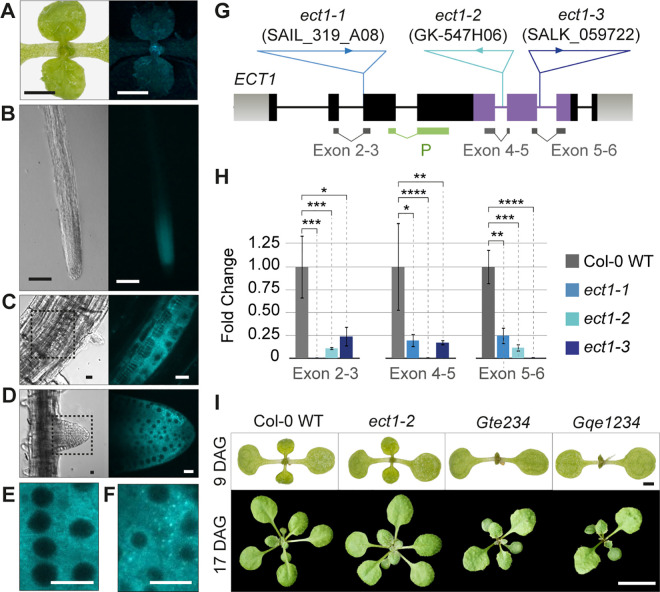
Fig 3 Endogenous ECT1 has negligible ECT2/3/4-like function, despite similar expression pattern and subcellular localization. (A-D) Expression pattern of ECT1p:gECT1-TFP (gDNA) in aerial organs (A), main root (B), lateral root primordia (C) and emerging lateral roots (D) of 10-day-old seedlings. The expression mimics the pattern observed for ECT2/3/4 (Arribas-Hernández et al., 2020). (E-F) Intracellular localization of ECT1-TFP in meristematic cells of root tips in unchallenged conditions. Although the cytoplasmic signal is largely homogenous (E), sporadic foci (F) are frequently observed. S13A Fig shows the integrity of the fluorescently tagged protein in independent transgenic lines assessed by protein blot. (G) Schematic representation of the ECT1 locus. Exons are represented as boxes and introns as lines. The positions and identifiers of the T-DNA insertions assigned to the ect1-1, ect1-2 and ect1-3 alleles are marked, and the location of qPCR amplicons and hybridization probes (P) for analyses is indicated below. Genotyping of ect alleles is shown in S13C–S13F Fig. (H) Expression analysis of ECT1 mRNA in wild type and T-DNA insertion lines by qPCR. *P<0.01, **P<0.001, ***P<0.0001, and ****P<0.00001 in T-test pairwise comparisons (supporting data in S9 Dataset). Northern blot using the probe (P) marked in G detects ECT1-TFP mRNA, but the endogenous ECT1 transcript is below detection limit (S13B Fig). (I) Morphological appearance of seedlings with or without ECT1 in the different backgrounds indicated. Nomenclature and additional phenotyping of these and alternative allele combinations can be found in S14 Fig. DAG, days after germination. Scale bars are: 1 cm in A, 1 mm in B, 100 μm in C, 10 μm in D-F, 1 mm in upper panels of I, and 1 cm in the lower panels.
Fig 3 Endogenous ECT1 has negligible ECT2/3/4-like function, despite similar expression pattern and subcellular localization. (A-D) Expression pattern of ECT1p:gECT1-TFP (gDNA) in aerial organs (A), main root (B), lateral root primordia (C) and emerging lateral roots (D) of 10-day-old seedlings. The expression mimics the pattern observed for ECT2/3/4 (Arribas-Hernández et al., 2020). (E-F) Intracellular localization of ECT1-TFP in meristematic cells of root tips in unchallenged conditions. Although the cytoplasmic signal is largely homogenous (E), sporadic foci (F) are frequently observed. S13A Fig shows the integrity of the fluorescently tagged protein in independent transgenic lines assessed by protein blot. (G) Schematic representation of the ECT1 locus. Exons are represented as boxes and introns as lines. The positions and identifiers of the T-DNA insertions assigned to the ect1-1, ect1-2 and ect1-3 alleles are marked, and the location of qPCR amplicons and hybridization probes (P) for analyses is indicated below. Genotyping of ect alleles is shown in S13C–S13F Fig. (H) Expression analysis of ECT1 mRNA in wild type and T-DNA insertion lines by qPCR. *P<0.01, **P<0.001, ***P<0.0001, and ****P<0.00001 in T-test pairwise comparisons (supporting data in S9 Dataset). Northern blot using the probe (P) marked in G detects ECT1-TFP mRNA, but the endogenous ECT1 transcript is below detection limit (S13B Fig). (I) Morphological appearance of seedlings with or without ECT1 in the different backgrounds indicated. Nomenclature and additional phenotyping of these and alternative allele combinations can be found in S14 Fig. DAG, days after germination. Scale bars are: 1 cm in A, 1 mm in B, 100 μm in C, 10 μm in D-F, 1 mm in upper panels of I, and 1 cm in the lower panels.CC BY · PubMed Central
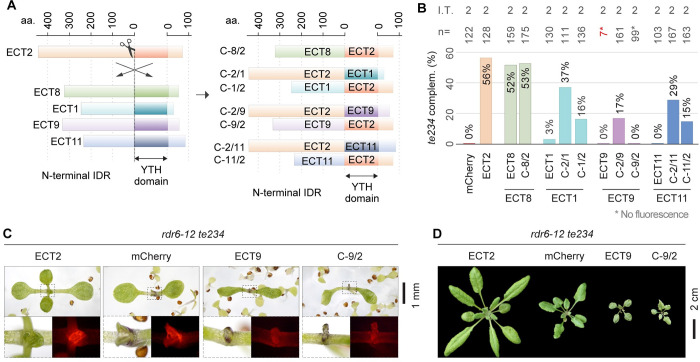
Fig 4 Dissection of ECT1/9/11 functional regions. (A) Schematic representation of the strategy followed to express chimeras with N-terminal IDR and YTH domains of different ECT proteins. (B) Weighed averages of the complementation rates observed for each chimeric construct measured as in Fig 2B and 2C. The raw complementation rates and transformation efficiencies of each independent transformation (I.T.) can be found in S7B and S9 Figs respectively, and photographs of the scored 10-day-old T1 seedlings with mCherry fluorescence are shown in S15 Fig. (C) 10-day-old primary transformants of rdr6-12/te234 with the indicated transgenes. Dashed outlines are magnified below to show mCherry fluorescence. (D) Same genotypes as in C at 26 days after germination. Additional independent transgenic lines, developmental stages and controls for C and D can be found in S10 Fig. All transgenes are expressed from the US7Y promoter and contain mCherry fused to the C-terminus.
Fig 4 Dissection of ECT1/9/11 functional regions. (A) Schematic representation of the strategy followed to express chimeras with N-terminal IDR and YTH domains of different ECT proteins. (B) Weighed averages of the complementation rates observed for each chimeric construct measured as in Fig 2B and 2C. The raw complementation rates and transformation efficiencies of each independent transformation (I.T.) can be found in S7B and S9 Figs respectively, and photographs of the scored 10-day-old T1 seedlings with mCherry fluorescence are shown in S15 Fig. (C) 10-day-old primary transformants of rdr6-12/te234 with the indicated transgenes. Dashed outlines are magnified below to show mCherry fluorescence. (D) Same genotypes as in C at 26 days after germination. Additional independent transgenic lines, developmental stages and controls for C and D can be found in S10 Fig. All transgenes are expressed from the US7Y promoter and contain mCherry fused to the C-terminus.CC BY · PubMed Central
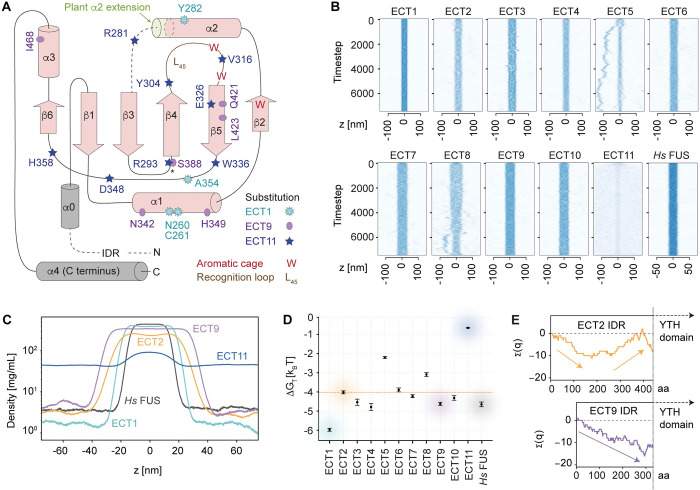
Fig 5 Analysis of ECT1/9/11 functional regions. (A) Topology of the YTH domain of Homo sapiens (Hs) YTHDF1 with secondary structure elements drawn in pink [61]. The two grey helices represent the only structural elements outside the YTH domain as defined by Stoilov et al. [8]: α0 immediately upstream, and α4 at the C-terminus of the protein. Superimposed on the diagrams are the non-conservative amino acid substitutions found in Ath ECT1, ECT9 and ECT11 compared to the majority of Ath ECTs (see alignment in S16 Fig). The localization of these amino acids in the predicted 3D structures, predominantly on the surface, and the spatial integrity of the aromatic cage in the homology models of ECT1/9/11, can be found in S17 Fig. (B) Slab simulations of the IDRs of the indicated proteins showing their tendency to remain in condensed phase or disperse in solution. Source videos of ECT2, ECT1 and ECT11 simulations are provided as S1–S3 Movies (C) Time-averaged density profiles for a subset of the proteins in B. The analyses of the remaining Ath ECTs are shown in S19A Fig. (D) Calculated free energy change for the transition between aqueous solution and condensed phase (ΔGtrans = RT ln [cdilute / cdense]) for the IDRs of the indicated proteins. (E) Cumulative charge distribution of the IDRs of the indicated proteins. The length in amino acids (aa) is at scale. The same analysis for all Ath ECTs can be found in S19D Fig.
Fig 5 Analysis of ECT1/9/11 functional regions. (A) Topology of the YTH domain of Homo sapiens (Hs) YTHDF1 with secondary structure elements drawn in pink [61]. The two grey helices represent the only structural elements outside the YTH domain as defined by Stoilov et al. [8]: α0 immediately upstream, and α4 at the C-terminus of the protein. Superimposed on the diagrams are the non-conservative amino acid substitutions found in Ath ECT1, ECT9 and ECT11 compared to the majority of Ath ECTs (see alignment in S16 Fig). The localization of these amino acids in the predicted 3D structures, predominantly on the surface, and the spatial integrity of the aromatic cage in the homology models of ECT1/9/11, can be found in S17 Fig. (B) Slab simulations of the IDRs of the indicated proteins showing their tendency to remain in condensed phase or disperse in solution. Source videos of ECT2, ECT1 and ECT11 simulations are provided as S1–S3 Movies (C) Time-averaged density profiles for a subset of the proteins in B. The analyses of the remaining Ath ECTs are shown in S19A Fig. (D) Calculated free energy change for the transition between aqueous solution and condensed phase (ΔGtrans = RT ln [cdilute / cdense]) for the IDRs of the indicated proteins. (E) Cumulative charge distribution of the IDRs of the indicated proteins. The length in amino acids (aa) is at scale. The same analysis for all Ath ECTs can be found in S19D Fig.CC BY · PubMed Central
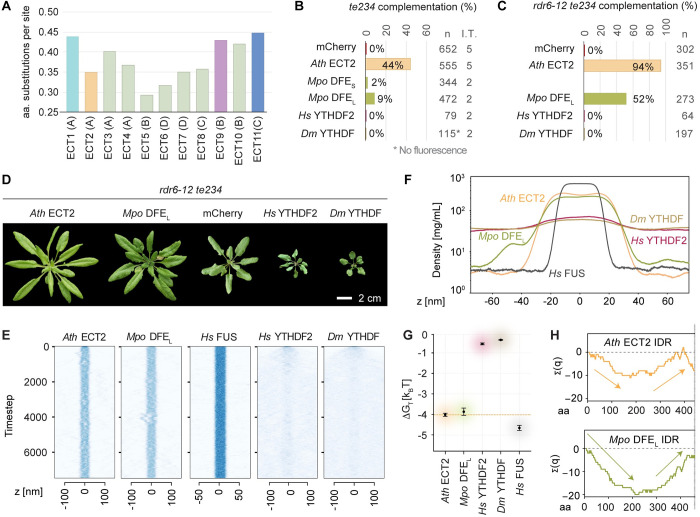
Fig 6 Heterologous expression of a bryophyte DFE rescues loss of ECT2/3/4 function in arabidopsis, while metazoan YTHDF proteins aggravates it. (A) Evolutionary divergence of Arabidopsis thaliana (Ath) ECT proteins estimated by pairwise comparisons between these and the only DF protein in Marchantia polymorpha (Mpo DFE) according to the alignment of YTHDFs from bryophytes and angiosperms in S7–S8 Datasets (see Methods). (B-C) Weighed averages of the complementation rates observed for Mpo DFE (S/L refer to the Short and Long splice forms found in meristematic tissues–apical notches and gemma cups–of M. polymorpha thalli), Homo sapiens (Hs) YTHDF2 and Drosophila melanogaster (Dm) YTHDF in the te234 (B) or rdr6-12/te234 (C) backgrounds, calculated as in Fig 2C–2D. n, total number of transformants; I.T. number of independent transformations (only one in C). Raw T1 counts, complementation rates and transformation efficiencies can be found in the S6 Dataset, and S7 and S9 Figs. (D) 32-day-old primary transformants expressing the transgenes analysed in C. Additional controls and developmental stages are shown in S10B Fig. (E) Slab simulations of the IDRs of the indicated proteins as in Fig 5B. (F) Time-averaged density profiles of the slab simulations in E. (G) Calculated free energy change for the IDRs of the indicated proteins as in Fig 5D. (H) Cumulative charge distribution of the IDRs of the indicated proteins, as in Fig 5E. The same analysis for the two metazoan YTHDFs can be found in S19D Fig.
Fig 6 Heterologous expression of a bryophyte DFE rescues loss of ECT2/3/4 function in arabidopsis, while metazoan YTHDF proteins aggravates it. (A) Evolutionary divergence of Arabidopsis thaliana (Ath) ECT proteins estimated by pairwise comparisons between these and the only DF protein in Marchantia polymorpha (Mpo DFE) according to the alignment of YTHDFs from bryophytes and angiosperms in S7–S8 Datasets (see Methods). (B-C) Weighed averages of the complementation rates observed for Mpo DFE (S/L refer to the Short and Long splice forms found in meristematic tissues–apical notches and gemma cups–of M. polymorpha thalli), Homo sapiens (Hs) YTHDF2 and Drosophila melanogaster (Dm) YTHDF in the te234 (B) or rdr6-12/te234 (C) backgrounds, calculated as in Fig 2C–2D. n, total number of transformants; I.T. number of independent transformations (only one in C). Raw T1 counts, complementation rates and transformation efficiencies can be found in the S6 Dataset, and S7 and S9 Figs. (D) 32-day-old primary transformants expressing the transgenes analysed in C. Additional controls and developmental stages are shown in S10B Fig. (E) Slab simulations of the IDRs of the indicated proteins as in Fig 5B. (F) Time-averaged density profiles of the slab simulations in E. (G) Calculated free energy change for the IDRs of the indicated proteins as in Fig 5D. (H) Cumulative charge distribution of the IDRs of the indicated proteins, as in Fig 5E. The same analysis for the two metazoan YTHDFs can be found in S19D Fig.CC BY · PubMed Central

Verification

Claims the paper makes

The claims and statistics of this paper haven’t been checked yet.

Run the check — free, no account needed. It reads the open-access text and checks the sources it cites.

A few free checks a day · papers already verified open instantly · results are public

Self-check

Percentages, sums and reported differences re-computed from the paper’s own numbers.

The self-check needs the paper’s full text.

Citations

Cites

Show all 2 references

Research works printed but not linked: 133

  1. 10.1105/tpc.108.058883 · DOI
  2. 10.1126/science.1261417 · DOI
  3. 10.1038/nature14234 · DOI · Paper page
  4. 10.1021/ja513080v · DOI
  5. 10.1038/nature14263 · DOI
  6. 10.1016/j.tcb.2017.10.001 · DOI
  7. 10.1038/nature11112 · DOI · Paper page
  8. 10.1016/S0968-0004(02)02189-8 · DOI
  9. 10.1038/nature12730 · DOI · Paper page
  10. 10.1038/cr.2014.153 · DOI
  11. 10.1073/pnas.1412742111 · DOI
  12. 10.1093/nar/gku1116 · DOI
  13. 10.1038/nchembio.1654 · DOI
  14. 10.1038/cr.2014.152 · DOI
  15. 10.1074/jbc.M110.104711 · DOI
  16. 10.1105/tpc.17.00833 · DOI
  17. 10.1242/dev.189134 · DOI
  18. 10.1101/gad.340695.120 · DOI · Paper page
  19. 10.1016/j.molcel.2017.08.003 · DOI
  20. 10.1186/s13059-018-1436-y · DOI
  21. 10.1038/s41586-018-0666-1 · DOI · Paper page
  22. 10.1016/j.celrep.2020.108598 · DOI
  23. 10.7554/eLife.72377 · DOI
  24. 10.1038/nature20568 · DOI
  25. 10.1038/nature20577 · DOI
  26. 10.1105/tpc.17.00854 · DOI
  27. 10.1007/s11105-014-0724-2 · DOI
  28. 10.1038/ncomms12626 · DOI
  29. 10.1016/j.molcel.2019.02.034 · DOI
  30. 10.1016/j.celrep.2022.110861 · DOI
  31. 10.7554/eLife.72375 · DOI
  32. 10.1016/j.molcel.2020.05.032 · DOI
  33. 10.1007/s13238-019-00660-2 · DOI
  34. 10.1038/s41422-019-0210-3 · DOI
  35. 10.1038/s41586-019-1374-1 · DOI
  36. 10.1038/s41589-020-0524-y · DOI
  37. 10.1093/nar/gkac640 · DOI
  38. 10.7554/eLife.84034 · DOI
  39. 10.1016/j.cell.2020.05.012 · DOI
  40. 10.1104/pp.105.065649 · DOI
  41. 10.1016/j.cell.2016.05.026 · DOI
  42. 10.1016/j.sbi.2020.09.004 · DOI
  43. 10.1016/j.molcel.2022.05.029 · DOI
  44. 10.1016/j.cell.2015.05.014 · DOI · Paper page
  45. 10.1038/cr.2017.15 · DOI · Paper page
  46. 10.1038/cr.2017.10 · DOI
  47. 10.1021/acs.jcim.0c01029 · DOI
  48. 10.1186/s13059-023-02862-8 · DOI
  49. 10.1016/j.pbi.2015.05.015 · DOI
  50. 10.3389/fpls.2012.00048 · DOI
  51. 10.1016/j.devcel.2016.06.008 · DOI
  52. 10.1111/nph.14586 · DOI
  53. 10.1098/rstb.2011.0252 · DOI
  54. 10.1038/s41586-019-1693-2 · DOI · Paper page
  55. 10.1111/nph.14975 · DOI
  56. 10.1016/j.cub.2020.03.048 · DOI
  57. 10.1038/s41477-020-0618-2 · DOI
  58. 10.1016/j.cub.2018.01.063 · DOI
  59. 10.1093/molbev/msab106 · DOI
  60. 10.1038/s41477-019-0588-4 · DOI
  61. 10.1074/jbc.M115.680389 · DOI
  62. 10.1038/s41477-022-01283-y · DOI
  63. 10.3732/ajb.1200416 · DOI
  64. 10.1111/tpj.15667 · DOI
  65. 10.1093/plcell/koac333 · DOI
  66. 10.1242/dev.128.21.4289 · DOI
  67. 10.1146/annurev.arplant.51.1.167 · DOI
  68. 10.1021/acs.biochem.8b01166 · DOI
  69. 10.1093/nar/gkv1382 · DOI
  70. 10.1016/S0092-8674(00)80864-8 · DOI
  71. 10.1016/S0092-8674(00)80863-6 · DOI
  72. 10.1101/gad.1231804 · DOI
  73. 10.1016/j.molp.2020.08.001 · DOI
  74. 10.1093/nar/gkab1061 · DOI · Paper page
  75. 10.1093/nar/gku340 · DOI
  76. 10.1093/nar/gkac1065 · DOI
  77. 10.1073/pnas.2111696118 · DOI
  78. 10.1073/pnas.2114412118 · DOI
  79. 10.1016/j.cell.2012.04.017 · DOI · Paper page
  80. 10.1016/j.cell.2015.07.047 · DOI
  81. 10.1016/j.celrep.2013.11.017 · DOI
  82. 10.3390/biom12040561 · DOI
  83. 10.1073/pnas.1516277113 · DOI
  84. 10.1016/j.cell.2017.09.030 · DOI
  85. 10.1007/s11103-006-0041-8 · DOI
  86. 10.1038/46528 · DOI
  87. 10.1038/46536 · DOI
  88. 10.1016/0022-2836(78)90183-3 · DOI
  89. 10.1038/ncb2902 · DOI
  90. 10.1101/gad.301036.117 · DOI
  91. 10.1038/nmeth.4435 · DOI · Paper page
  92. 10.1016/j.celrep.2018.10.020 · DOI
  93. 10.1105/tpc.17.00934 · DOI
  94. 10.7554/eLife.49658 · DOI
  95. 10.1186/s13059-023-02947-4 · DOI
  96. 10.1104/pp.19.01156 · DOI
  97. 10.1101/2023.07.03.547513 · DOI
  98. 10.1126/sciadv.ade4973 · DOI
  99. 10.1016/j.tree.2019.08.008 · DOI · Paper page
  100. 10.1002/ajb2.16175 · DOI
  101. 10.1073/pnas.97.9.4535 · DOI
  102. 10.1093/dnares/dsz009 · DOI
  103. 10.1111/jpy.13321 · DOI
  104. 10.1126/sageke.2003.38.re7 · DOI
  105. 10.1104/pp.15.01995 · DOI
  106. 10.1093/nar/gkr944 · DOI
  107. 10.1093/database/baac046 · DOI
  108. 10.1038/s41477-018-0188-8 · DOI
  109. 10.1093/nar/gkr947 · DOI
  110. 10.1093/nar/gkt1069 · DOI
  111. 10.1093/nar/gkh340 · DOI · Paper page
  112. 10.1186/1471-2105-5-113 · DOI
  113. 10.1093/bioinformatics/btp033 · DOI
  114. 10.1093/molbev/msu300 · DOI · Paper page
  115. 10.1093/molbev/msaa015 · DOI · Paper page
  116. 10.1093/sysbio/syab010 · DOI
  117. 10.1098/rspb.2018.1012 · DOI
  118. 10.1038/nmeth.4285 · DOI · Paper page
  119. 10.1093/oxfordjournals.molbev.a026201 · DOI · Paper page
  120. 10.1093/oxfordjournals.molbev.a040317 · DOI
  121. 10.1093/molbev/msab120 · DOI
  122. 10.1002/0471142727.mb0321s86 · DOI
  123. 10.1093/nar/gkl635 · DOI
  124. 10.1371/journal.pone.0083043 · DOI
  125. 10.12688/openreseurope.14967.2 · DOI
  126. 10.1371/journal.pcbi.1005941 · DOI
  127. 10.1021/acs.jctc.0c01064 · DOI
  128. 10.1093/nar/gkr1047 · DOI
  129. 10.1093/nar/gku316 · DOI · Paper page
  130. 10.1002/pro.3280 · DOI
  131. 10.1093/nar/gkac993 · DOI
  132. 10.1016/j.jmb.2004.03.016 · DOI
  133. 10.1093/molbev/msz312 · DOI

Metadata

Authors
Flores-Téllez, D., Tankmar, M. D., von Bülow, S., Chen, J., Lindorff-Larsen, K., Brodersen, P., & Arribas-Hernández, L.
Affiliations
University of Copenhagen (DK)
Corresponding author
Brodersen, Peter
Venue
PLoS Genetics
Publisher
openRxiv
Published
2022-10-19
Volume
19
Issue
10
Pages
e1010980-e1010980
ISSN
1553-7390 (ISSN-L)
OpenAlex
W4387493067
Cited by
29
References
2
Citations by year
2026: 7 · 2025: 13 · 2024: 7 · 2023: 2
FWCI
4.56
Type
journal article
Language
en
Open access
Licence
cc-by
Locations
  • PLoS Genetics (publishedVersion, cc-by)
  • bioRxiv (Cold Spring Harbor Laboratory) (acceptedVersion, cc-by-nc-nd)
  • PubMed Central (publishedVersion, cc-by)
  • PubMed (publishedVersion)
  • Research at the University of Copenhagen (University of Copenhagen) (publishedVersion, cc-by)
  • DIGITAL.CSIC (Spanish National Research Council (CSIC)) (submittedVersion, cc-by)
  • Deposito Digital UFV (Francisco de Vitoria University) (submittedVersion, cc-by-nc-nd)
  • DOAJ (DOAJ: Directory of Open Access Journals) (submittedVersion, cc-by-sa)
Funders
  • European Molecular Biology Organization (ALTF 810‐2022)
  • Novo Nordisk
  • Novo Nordisk Fonden (NNF19OC0054973, NNF18OC0033950)
  • Danmarks Frie Forskningsfond (9040-00409B)
  • H2020 European Research Council (726417)
Topics
  • Life Sciences › Agricultural and Biological Sciences › Plant Science › Plant Molecular Biology Research
  • Life Sciences › Biochemistry, Genetics and Molecular Biology › Molecular Biology › RNA modifications and cancer
  • Life Sciences › Biochemistry, Genetics and Molecular Biology › Molecular Biology › RNA Research and Splicing
Keywords
N6-methyladenosine, m6A RNA methylation, intrinsically disordered regions, functional diversification, neofunctionalization, gene duplication, functional complementation, leaf primordia, stem cell division, phase separation, electric dipole, Arabidopsis thaliana, bryophytes, YTH domain
MeSH terms
Animals, Multigene Family, Humans, RNA, Messenger, Arabidopsis, Arabidopsis Proteins, Intracellular Signaling Peptides and Proteins

About these checks

Registry, retraction, Cites and statistics results are computed, not judged, with one exception: a printed reference that no index lists is read once by a model before it counts as a citation error. Claims are extracted by a model and kept only when their quote appears verbatim in the text; each cited source is then checked, with a model’s help, for whether it says what the claim relies on. Those verdicts can be wrong — read the claim’s quote and the cited source before relying on one.

Statistics and arithmetic are recomputed, not judged.

Confidence bands are shown only for fields calibrated on our annotated test set. None is calibrated yet, so no band is shown.

What counts as a claim ›How we measure confidence ›How we check this ›

Are you an author, or do you see a problem with this page? Request a review

How to cite

Cite CoChat for the checks on this page, and the paper for its own findings.

This page
CoChat. (2026). Citation check: Insights into the conservation and diversification of the molecular functions of YTHDF proteins. https://app.cochat.ai/papers/10.1101/2022.10.19.512826
The paper
Flores-Téllez, D., Tankmar, M. D., von Bülow, S., Chen, J., Lindorff-Larsen, K., Brodersen, P., & Arribas-Hernández, L. (2022). Insights into the conservation and diversification of the molecular functions of YTHDF proteins. PLoS Genetics. https://doi.org/10.1101/2022.10.19.512826