PreprintCited by 13Genomics and Chromatin DynamicsChromatin Remodeling and CancerChromosomal and Genetic Variations

The DOI matches its Crossref record; 1 of the 1 references it cites were found in a registry or an index.

Accurate prediction of cohesin-mediated 3D genome organization from 2D chromatin features

Open access

Preprint — published as 10.1186/s13059-023-03158-7 · Paper page

Abstract

The three-dimensional (3D) genome organization influences diverse nuclear processes. Chromatin interaction analysis by paired-end tag sequencing (ChIA-PET) and Hi-C are powerful methods to study the 3D genome organization. However, ChIA-PET and Hi-C experiments are expensive, time-consuming, require tens to hundreds of millions of cells, and are challenging to optimize and analyze. Predicting ChIA-PET/Hi-C data using cheaper ChIP-Seq data and other easily obtainable features could be a useful alternative. It is well-established that the cohesin protein complex is a key determinant of 3D genome organization. Here we present Chromatin Interaction Predictor (ChIPr), a suite of regression models based on deep neural networks (DNN), random forest, and gradient boosting, respectively, to predict cohesin-mediated chromatin interaction strength between any two loci in the genome. Comprehensive tests on four cell lines show that the predictions of ChIPr correlate well with the original ChIA-PET data at the peak-level resolution and bin sizes of 25 and 5 Kbp. In addition, ChIPr can accurately capture most of the cell-type-dependent loops identified by ChIA-PET and Hi-C data. Rigorous feature testing indicated that genomic distance and RAD21 (a cohesin component) ChIP-Seq signals are the most important inputs for ChIPr in determining chromatin interaction strength. The standard ChIPr model requires three experimental inputs: ChIP-Seq signals for RAD21, H3K27ac (enhancer/active chromatin mark) and H3K27me3 (inactive chromatin mark). The minimal ChIPr model performs comparably and requires a single experimental input: ChIP-Seq signals for RAD21. Integrative analysis revealed novel insights into the role of CTCF motif, its orientation, and CTCF binding on the prevalence and strength of cohesin-mediated chromatin interactions. These studies outline the general features of genome folding and open new avenues to analyze spatial genome organization in specimens with limited cell numbers.

Overview

The claims and statistics of this paper haven’t been checked yet.

Run the check — free, no account needed. It reads the open-access text and checks the sources it cites.

A few free checks a day · papers already verified open instantly · results are public

Integrity signals

Registry

Crossref · 10.1101/2022.11.23.517572

Cites

1 of 1 references verified0 citation errors · 0 not checkable

Statistics

Figures

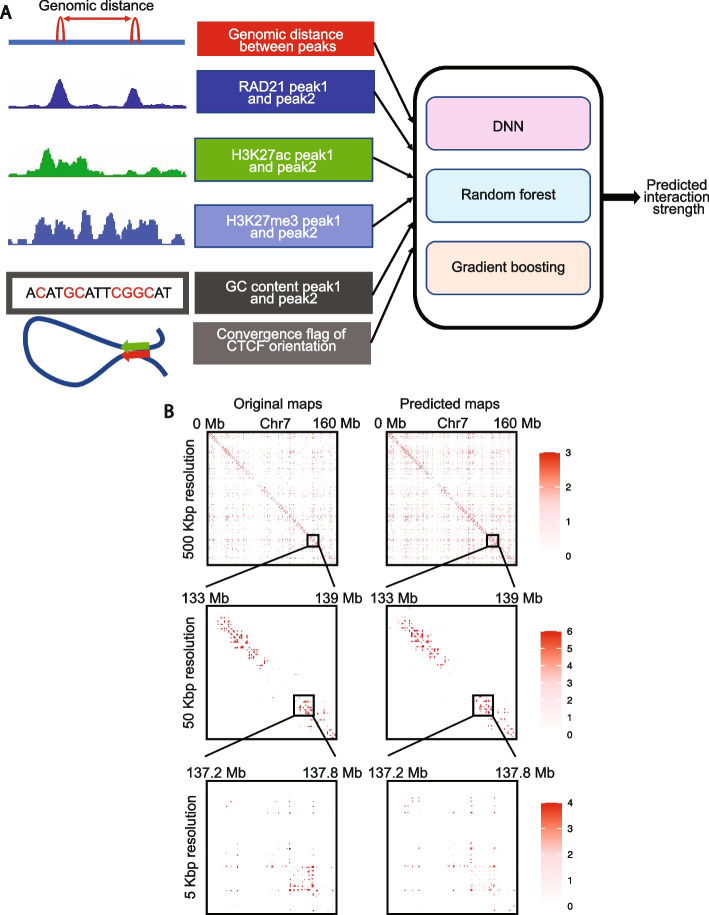
Fig. 1 Overview of ChIPr, a regression model with three variants to predict interaction strength between two peaks. A A schematic representation of ChIPr showing all the input features, the three regression variants, and the expected output from ChIPr. B An example of contact maps constructed from the original ChIA-PET data and the corresponding ones constructed from the predictions of DNN-ChIPr at resolutions of 500, 50, and 5 kbp. Heatmaps in B were plotted using HiTC
Fig. 1 Overview of ChIPr, a regression model with three variants to predict interaction strength between two peaks. A A schematic representation of ChIPr showing all the input features, the three regression variants, and the expected output from ChIPr. B An example of contact maps constructed from the original ChIA-PET data and the corresponding ones constructed from the predictions of DNN-ChIPr at resolutions of 500, 50, and 5 kbp. Heatmaps in B were plotted using HiTCCC BY · PubMed Central
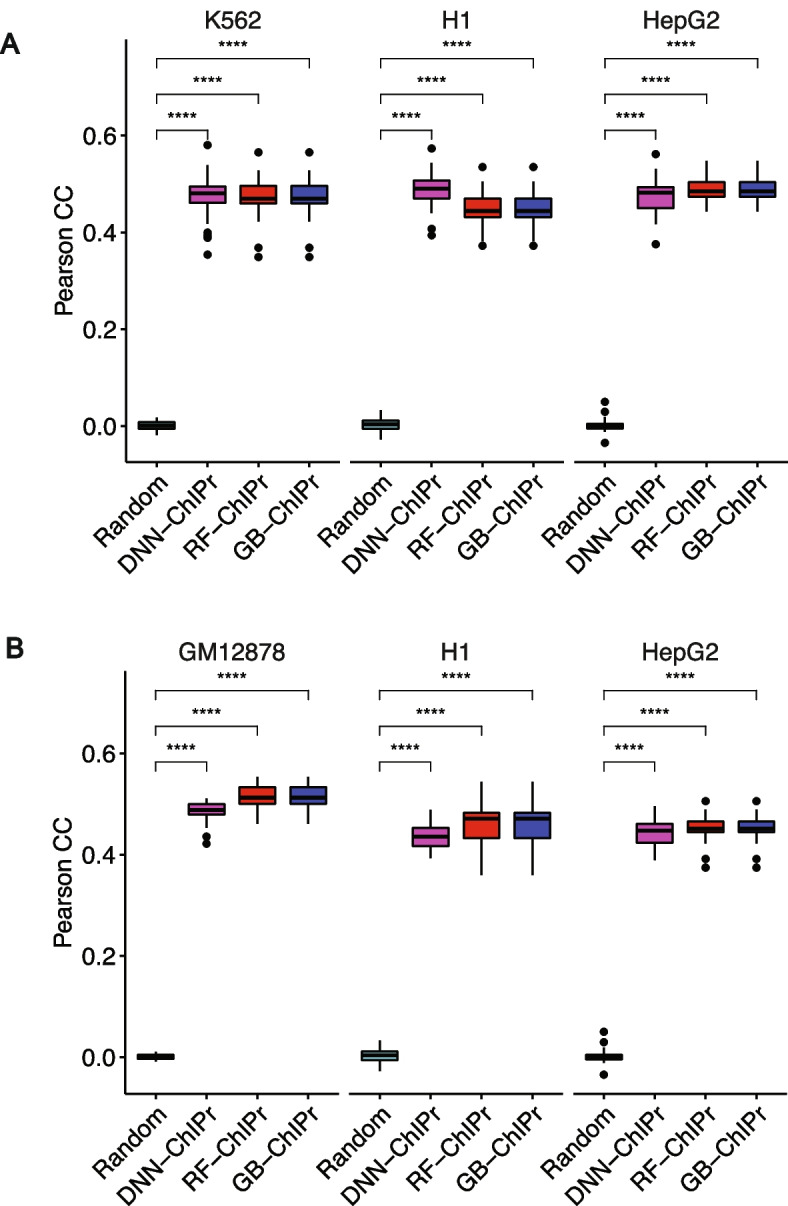
Fig. 2 Predicted interactions correlate well with the original ones at the peak-level-resolution. A Predicted interactions using the three variants of ChIPr for the cell lines K562, H1, and HepG2 correlate significantly better than the random interactions with the original ChIA-PET interactions of these three cell lines. The predictions in A are obtained using models trained on the GM12878 cell line data. B Predicted interactions using the three variants of ChIPr for the cell lines GM12878, H1, and HepG2 correlate significantly better than the random interactions with the original ChIA-PET interactions of these three cell lines. The predictions in B are obtained using the models trained on the K562 cell line data. ****: p-value < 0.0001, Wilcoxon rank sum test
Fig. 2 Predicted interactions correlate well with the original ones at the peak-level-resolution. A Predicted interactions using the three variants of ChIPr for the cell lines K562, H1, and HepG2 correlate significantly better than the random interactions with the original ChIA-PET interactions of these three cell lines. The predictions in A are obtained using models trained on the GM12878 cell line data. B Predicted interactions using the three variants of ChIPr for the cell lines GM12878, H1, and HepG2 correlate significantly better than the random interactions with the original ChIA-PET interactions of these three cell lines. The predictions in B are obtained using the models trained on the K562 cell line data. ****: p-value < 0.0001, Wilcoxon rank sum testCC BY · PubMed Central
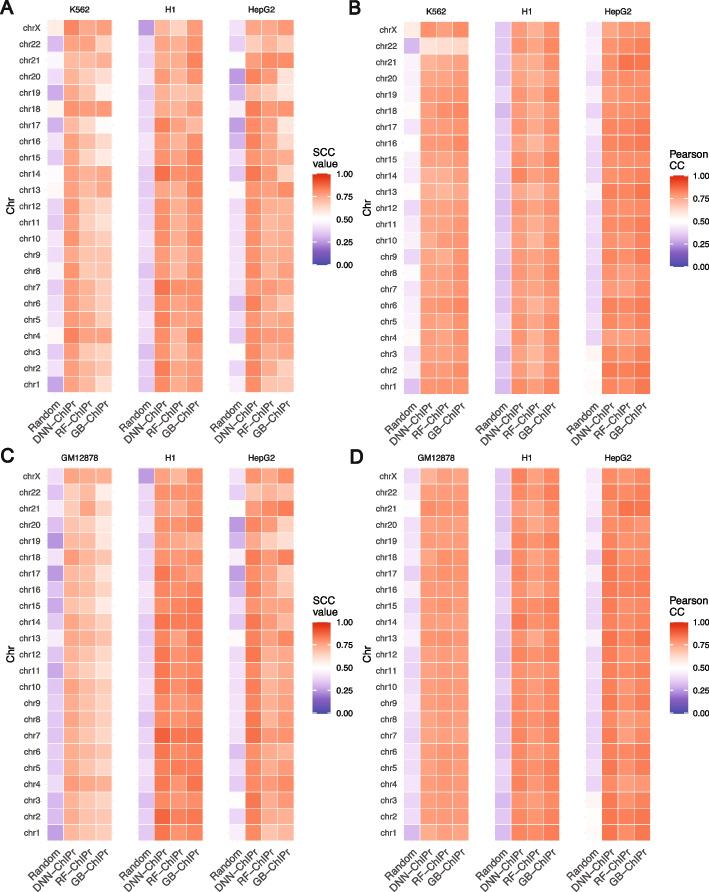
Fig. 3 Predicted interactions correlate well with the original ones at the 25 kbp bin resolution. A, B Comparison between the correlation coefficient values between the original interactions and the predicted ones using the three variants of ChIPr vs. those between the original and randomly generated ones for the three cell lines K562, H1, and HepG2. The correlation coefficients were calculated using stratum-adjusted correlation coefficients (A) and Pearson correlation coefficients (B), respectively. The predictions in A and B were generated using the models trained on GM12878 data. C, D Comparison between the correlation coefficient values between the original interactions and the predicted ones using the three variants of ChIPr vs. those between the original and randomly generated ones for the three cell lines GM12878, H1, and HepG2. The correlation coefficients were calculated using stratum-adjusted correlation coefficients (C) and Pearson correlation coefficients (D), respectively. The predictions in C and D were generated using the models trained on K562 data
Fig. 3 Predicted interactions correlate well with the original ones at the 25 kbp bin resolution. A, B Comparison between the correlation coefficient values between the original interactions and the predicted ones using the three variants of ChIPr vs. those between the original and randomly generated ones for the three cell lines K562, H1, and HepG2. The correlation coefficients were calculated using stratum-adjusted correlation coefficients (A) and Pearson correlation coefficients (B), respectively. The predictions in A and B were generated using the models trained on GM12878 data. C, D Comparison between the correlation coefficient values between the original interactions and the predicted ones using the three variants of ChIPr vs. those between the original and randomly generated ones for the three cell lines GM12878, H1, and HepG2. The correlation coefficients were calculated using stratum-adjusted correlation coefficients (C) and Pearson correlation coefficients (D), respectively. The predictions in C and D were generated using the models trained on K562 dataCC BY · PubMed Central
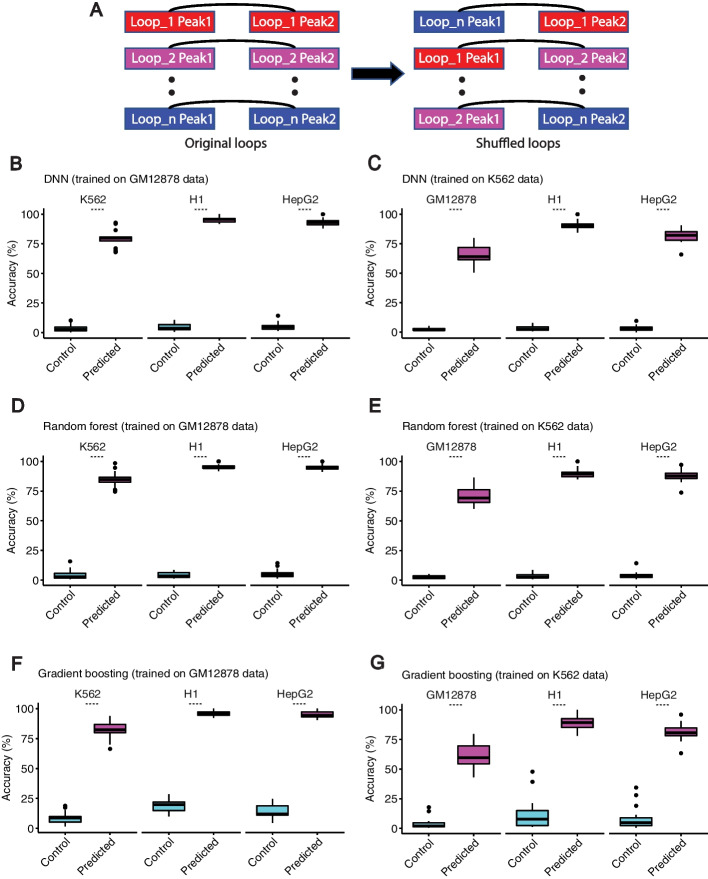
Fig. 4 Predicted interactions capture the majority of cell-type-dependent loops. A An illustration of how the random control loops were generated for the comparison. B–G Predicted interactions using DNN-ChIPr (B and C), RF-ChIPr (D and E), and GB-ChIPr (F and G) captured a significantly higher portion of the ChIA-PET identified cell-type-dependent loops vs. randomly introduced loops of the same number for the cell lines K562, H1, and HepG2. The models in panels B, D, and F were trained using the data of GM12878 cell line and the models in panels C, E, and G were trained using the data of K562 cell line. ****: p-value < 0.0001, Wilcoxon rank sum test
Fig. 4 Predicted interactions capture the majority of cell-type-dependent loops. A An illustration of how the random control loops were generated for the comparison. B–G Predicted interactions using DNN-ChIPr (B and C), RF-ChIPr (D and E), and GB-ChIPr (F and G) captured a significantly higher portion of the ChIA-PET identified cell-type-dependent loops vs. randomly introduced loops of the same number for the cell lines K562, H1, and HepG2. The models in panels B, D, and F were trained using the data of GM12878 cell line and the models in panels C, E, and G were trained using the data of K562 cell line. ****: p-value < 0.0001, Wilcoxon rank sum testCC BY · PubMed Central
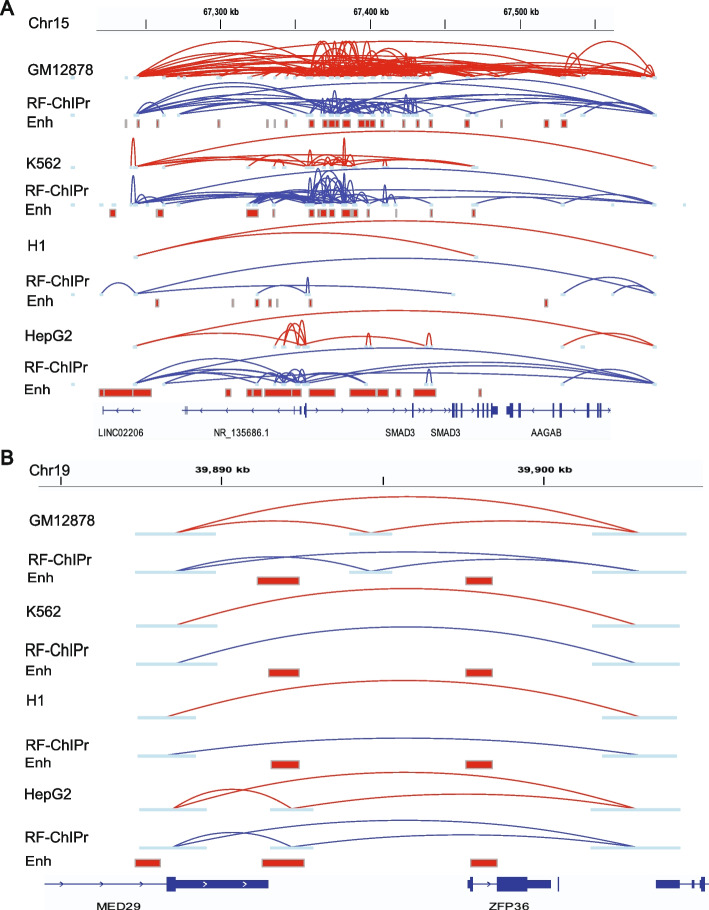
Fig. 5 Examples for the predictions of RF-ChIPr for variable and non-variable loops. A Predictions of RF-ChIPr are highly similar to the original data for the selected region surrounding SMAD3 gene. B Predictions of RF-ChIPr are highly similar to the original data for the non-variable loops in the region covering the two genes MED29 and ZFP36 in the four cell lines GM12878, K562, H1, and HepG2. Interactions shown in A and B are those having strength ≥ “3”. Red: original loops from RAD21 ChIA-PET data; blue: predicted loops by RF-ChIPr
Fig. 5 Examples for the predictions of RF-ChIPr for variable and non-variable loops. A Predictions of RF-ChIPr are highly similar to the original data for the selected region surrounding SMAD3 gene. B Predictions of RF-ChIPr are highly similar to the original data for the non-variable loops in the region covering the two genes MED29 and ZFP36 in the four cell lines GM12878, K562, H1, and HepG2. Interactions shown in A and B are those having strength ≥ “3”. Red: original loops from RAD21 ChIA-PET data; blue: predicted loops by RF-ChIPrCC BY · PubMed Central
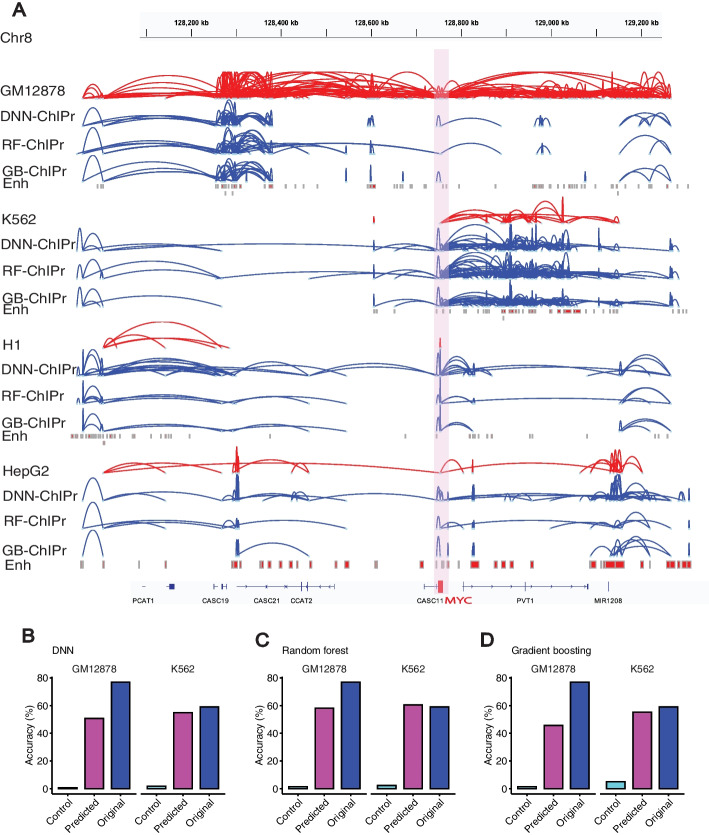
Fig. 6 ChIPr captures majority of cell-type-dependent interactions and Hi-C identified loops. A Original interactions and predicted ones for the four cell lines GM12878, K562, H1, and HepG2 using the three variants of ChIPr in the region surrounding the MYC oncogene. Interactions shown are those having strength ≥ “3”. Red: original loops from RAD21 ChIA-PET data; blue: predicted loops by ChIPr. B–D Predicted interactions using DNN-ChIPr (B), RF-ChIPr (C), and GB-ChIPr (D) captured the majority of the Hi-C identified loops captured by the original ChIA-PET data from the cell lines GM12878 and K562
Fig. 6 ChIPr captures majority of cell-type-dependent interactions and Hi-C identified loops. A Original interactions and predicted ones for the four cell lines GM12878, K562, H1, and HepG2 using the three variants of ChIPr in the region surrounding the MYC oncogene. Interactions shown are those having strength ≥ “3”. Red: original loops from RAD21 ChIA-PET data; blue: predicted loops by ChIPr. B–D Predicted interactions using DNN-ChIPr (B), RF-ChIPr (C), and GB-ChIPr (D) captured the majority of the Hi-C identified loops captured by the original ChIA-PET data from the cell lines GM12878 and K562CC BY · PubMed Central
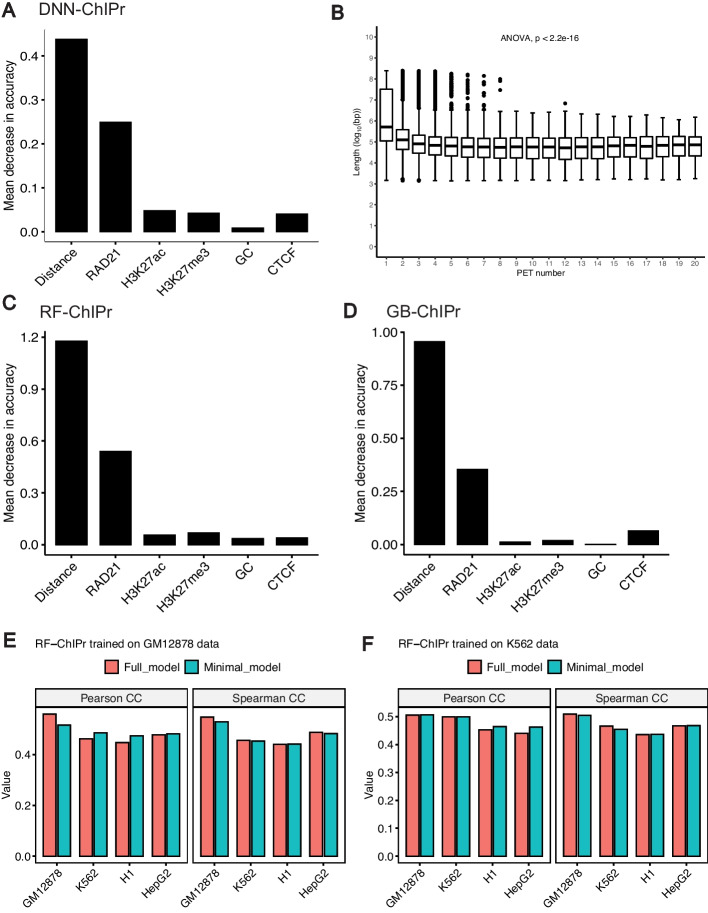
Fig. 7 Contributions of input features to ChIPr outputs. A The drop in mean absolute error when comparing predicted interactions with the original ones when training DNN-ChIPr while removing one of the input features at each time. B The relation between the number of RAD21 interactions with different strengths and the genomic distance between the two interacting peaks. C, D The importance of the inputs features for RF-ChIPr (C) and GB-ChIPr (D) using the permutations test. E, F Comparison between the genome-level performance of RF-ChIPr minimal and full models trained on GM12878 data (E) and K562 data (F), respectively. The data is split into training data (75%) and test data (25%). In E, the performance of GM12878 is measured on the GM12878 test data. Similarly, in F, the performance of K562 is also measured on the K562 test data
Fig. 7 Contributions of input features to ChIPr outputs. A The drop in mean absolute error when comparing predicted interactions with the original ones when training DNN-ChIPr while removing one of the input features at each time. B The relation between the number of RAD21 interactions with different strengths and the genomic distance between the two interacting peaks. C, D The importance of the inputs features for RF-ChIPr (C) and GB-ChIPr (D) using the permutations test. E, F Comparison between the genome-level performance of RF-ChIPr minimal and full models trained on GM12878 data (E) and K562 data (F), respectively. The data is split into training data (75%) and test data (25%). In E, the performance of GM12878 is measured on the GM12878 test data. Similarly, in F, the performance of K562 is also measured on the K562 test dataCC BY · PubMed Central
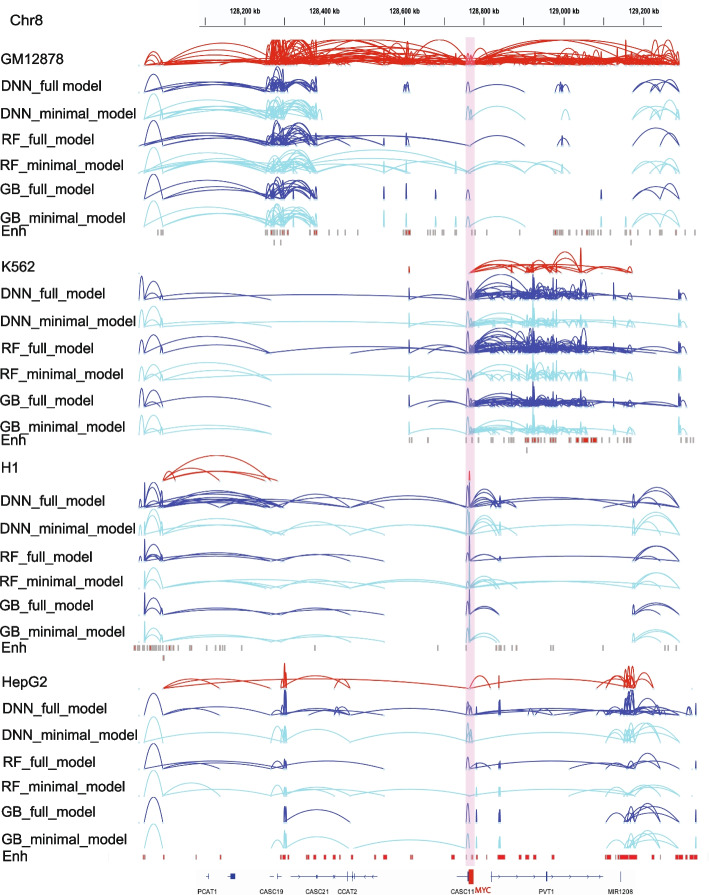
Fig. 8 Original interactions and predicted ones for the four cell lines GM12878, K562, H1, and HepG2 using the three variants of ChIPr in the region surrounding the MYC oncogene. Interactions shown are those having strength ≥ “3”. Red: original loops from RAD21 ChIA-PET data; blue: predicted loops by ChIPr full model, and cyan: predicted loops by ChIPr minimal model
Fig. 8 Original interactions and predicted ones for the four cell lines GM12878, K562, H1, and HepG2 using the three variants of ChIPr in the region surrounding the MYC oncogene. Interactions shown are those having strength ≥ “3”. Red: original loops from RAD21 ChIA-PET data; blue: predicted loops by ChIPr full model, and cyan: predicted loops by ChIPr minimal modelCC BY · PubMed Central
Fig. 9 Relationship between RAD21 interactions and CTCF motif orientation. A The relationship between the RAD21 interactions prevalence and the presence of CTCF motif in the interacting peaks. B, C The relationship between the strength of RAD21 interactions and the presence of CTCF motif in the interacting peaks for B GM12878 and C K562, respectively. D The percentage of interactions of different strengths and their relationship with the presence of CTCF motif in the interacting peaks
Fig. 9 Relationship between RAD21 interactions and CTCF motif orientation. A The relationship between the RAD21 interactions prevalence and the presence of CTCF motif in the interacting peaks. B, C The relationship between the strength of RAD21 interactions and the presence of CTCF motif in the interacting peaks for B GM12878 and C K562, respectively. D The percentage of interactions of different strengths and their relationship with the presence of CTCF motif in the interacting peaksCC BY · PubMed Central
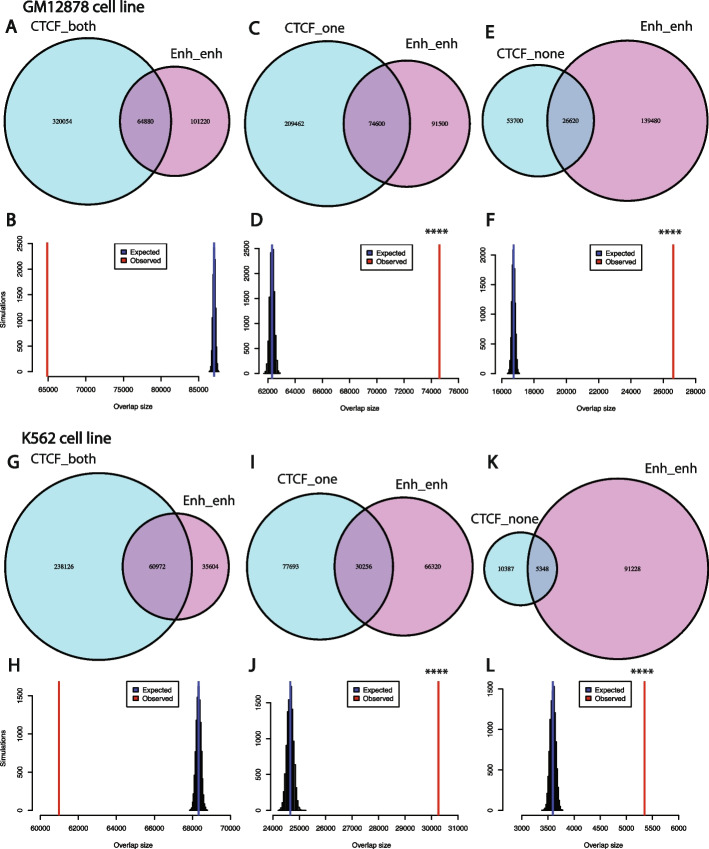
Fig. 10 RAD21 interactions without CTCF ChIP-Seq binding in both peaks are significantly enriched with enhancer-enhancer interactions. A, B Venn diagram showing the intersection between RAD21 interactions with CTCF binding in both peaks with those interactions with enhancer in both peaks for the GM12878 cell line (A), and simulations show that the intersection between the two sets of interactions is not significant (B). C, D Venn diagram showing the intersection between RAD21 interactions with CTCF binding in only one peak with those interactions with enhancer in both peaks for the GM12878 cell line (C), and simulations show that the intersection between the two sets of interactions is statistically significant (D). E, F Venn diagram showing the intersection between RAD21 interactions with no CTCF binding in both peaks with those interactions with enhancer in both peaks for the GM12878 cell line (E), and simulations show that the intersection between the two sets of interactions is statistically significant (F). G–L Same as A–F for the K562 cell line. ****: p-value < 0.0001, empirical test
Fig. 10 RAD21 interactions without CTCF ChIP-Seq binding in both peaks are significantly enriched with enhancer-enhancer interactions. A, B Venn diagram showing the intersection between RAD21 interactions with CTCF binding in both peaks with those interactions with enhancer in both peaks for the GM12878 cell line (A), and simulations show that the intersection between the two sets of interactions is not significant (B). C, D Venn diagram showing the intersection between RAD21 interactions with CTCF binding in only one peak with those interactions with enhancer in both peaks for the GM12878 cell line (C), and simulations show that the intersection between the two sets of interactions is statistically significant (D). E, F Venn diagram showing the intersection between RAD21 interactions with no CTCF binding in both peaks with those interactions with enhancer in both peaks for the GM12878 cell line (E), and simulations show that the intersection between the two sets of interactions is statistically significant (F). G–L Same as A–F for the K562 cell line. ****: p-value < 0.0001, empirical testCC BY · PubMed Central
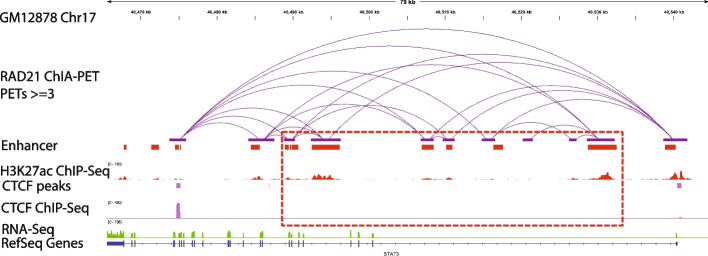
Fig. 11 Example of RAD21 interactions without CTCF in the two anchor peaks and are found to be enhancer-enhancer interactions in the GM12878 cell line (middle track in purple)
Fig. 11 Example of RAD21 interactions without CTCF in the two anchor peaks and are found to be enhancer-enhancer interactions in the GM12878 cell line (middle track in purple)CC BY · PubMed Central
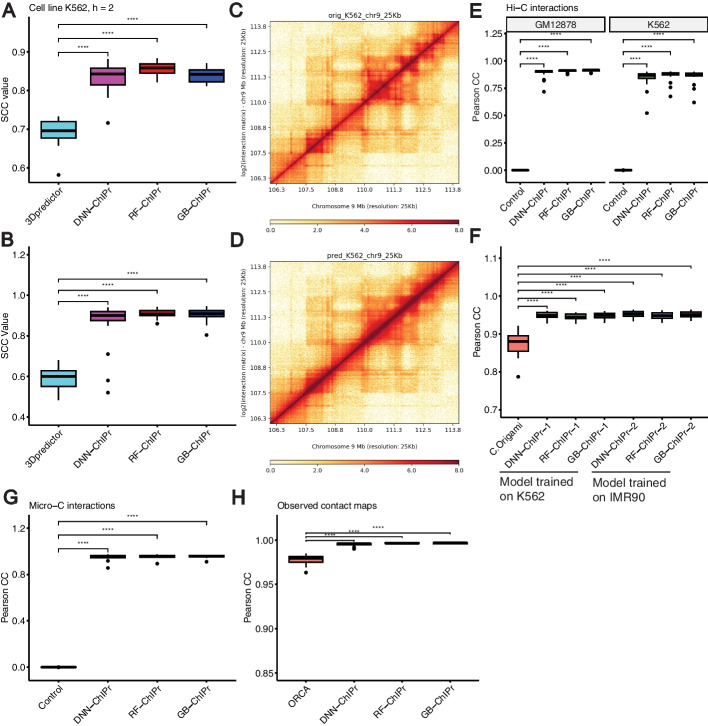
Fig. 12 ChIPr outperforms other 3D chromatin prediction methods. A The RAD21 25 kbp contact maps predicted by the three variants of ChIPr yield significantly higher SCC values when compared with the original contact maps than those yielded by 3Dpredictor contact maps. B The 25 kbp Hi-C contact maps predicted by the three variants of ChIPr yield significantly higher SCC values when compared with the original contact maps than those yielded by 3Dpredictor contact maps. C, D The original contact map of an 8 Mbp region in Chr9 (C) looks visually similar to its corresponding GB-ChIPr (D) prediction. E The predictions of the three variants of ChIPr, using the models trained on the IMR90 cell line data, correlate significantly better than control interactions when compared with the original Hi-C interactions for the two cell lines GM12878 and K562. F The predictions of the three variants of ChIPr, using the models trained on K562 and IMR90 cell line data, yield significantly higher Pearson correlation coefficient values than those obtained by C.Origami when comparing the 8 kbp resolution contact maps with the corresponding original ones for 23 randomly selected 2Mbp regions. G The predictions of the three variants of ChIPr, using the models trained on the H1 cell line Micro-C data (Chr1 only), correlate significantly better than control interactions when compared with the original Micro-C interactions for the remaining 22 chromosomes. H The three variants of ChIPr yield significantly higher Pearson correlation coefficient values when comparing the 5 kbp resolution observed contact maps with the original contact maps than those yielded by Orca 4 kbp contact maps for 16 selected regions in Chrs 8, 9, and 10. ****: p-value < 0.0001, Wilcoxon rank sum test. For SCC calculations in A, B, we set the smoothing window half-size h to “2” and the maximum genomic distance to include in calculations to 1.5 Mbp as used in 3Dpredictor paper. For C, D, visualization of contact maps is done using HiCPlotter [37]
Fig. 12 ChIPr outperforms other 3D chromatin prediction methods. A The RAD21 25 kbp contact maps predicted by the three variants of ChIPr yield significantly higher SCC values when compared with the original contact maps than those yielded by 3Dpredictor contact maps. B The 25 kbp Hi-C contact maps predicted by the three variants of ChIPr yield significantly higher SCC values when compared with the original contact maps than those yielded by 3Dpredictor contact maps. C, D The original contact map of an 8 Mbp region in Chr9 (C) looks visually similar to its corresponding GB-ChIPr (D) prediction. E The predictions of the three variants of ChIPr, using the models trained on the IMR90 cell line data, correlate significantly better than control interactions when compared with the original Hi-C interactions for the two cell lines GM12878 and K562. F The predictions of the three variants of ChIPr, using the models trained on K562 and IMR90 cell line data, yield significantly higher Pearson correlation coefficient values than those obtained by C.Origami when comparing the 8 kbp resolution contact maps with the corresponding original ones for 23 randomly selected 2Mbp regions. G The predictions of the three variants of ChIPr, using the models trained on the H1 cell line Micro-C data (Chr1 only), correlate significantly better than control interactions when compared with the original Micro-C interactions for the remaining 22 chromosomes. H The three variants of ChIPr yield significantly higher Pearson correlation coefficient values when comparing the 5 kbp resolution observed contact maps with the original contact maps than those yielded by Orca 4 kbp contact maps for 16 selected regions in Chrs 8, 9, and 10. ****: p-value < 0.0001, Wilcoxon rank sum test. For SCC calculations in A, B, we set the smoothing window half-size h to “2” and the maximum genomic distance to include in calculations to 1.5 Mbp as used in 3Dpredictor paper. For C, D, visualization of contact maps is done using HiCPlotter [37]CC BY · PubMed Central

Verification

Claims the paper makes

The claims and statistics of this paper haven’t been checked yet.

Run the check — free, no account needed. It reads the open-access text and checks the sources it cites.

A few free checks a day · papers already verified open instantly · results are public

Self-check

Percentages, sums and reported differences re-computed from the paper’s own numbers.

The self-check needs the paper’s full text.

Citations

Cites

Research works printed but not linked: 47

  1. 2021, Understanding 3D genome organization by multidisciplinary methods, Nature Reviews Molecular Cell Biology, 22, 511, 10.1038/s41580-021-00362-w · DOI
  2. 10.1126/science.1067799 · DOI · Paper page
  3. 10.1126/science.1181369 · DOI · Paper page
  4. 10.1038/nature08497 · DOI
  5. 10.1038/nature11082 · DOI · Paper page
  6. 10.1038/nature11049 · DOI · Paper page
  7. 10.1016/j.cell.2012.01.010 · DOI · Paper page
  8. 10.1016/j.molcel.2012.08.031 · DOI
  9. 10.1016/j.cell.2014.11.021 · DOI · Paper page
  10. 10.1016/j.cell.2015.11.024 · DOI · Paper page
  11. 10.1038/s41586-020-2151-x · DOI
  12. 10.1101/gr.230243.117 · DOI
  13. 2017, Long-read ChIA-PET for base-pair-resolution mapping of haplotype-specific chromatin interactions, Nature protocols, 12, 899, 10.1038/nprot.2017.012 · DOI
  14. 10.1038/nature11247 · DOI · Paper page
  15. 10.1093/nar/gkx1081 · DOI · Paper page
  16. 10.1093/nar/gku327 · DOI
  17. 10.1186/s13059-014-0572-2 · DOI
  18. 10.1093/nar/gkw225 · DOI
  19. 2016, Polymer physics of chromosome large-scale 3D organisation, Scientific reports, 6, 1
  20. 2016, Constructing 3D interaction maps from 1D epigenomes, Nature communications, 7, 1
  21. 10.1073/pnas.1714980114 · DOI
  22. 2018, Three-dimensional epigenome statistical model: genome-wide chromatin looping prediction, Scientific reports, 8, 1
  23. 2018, Predicting CTCF-mediated chromatin interactions by integrating genomic and epigenomic features, Nature communications, 9, 1
  24. 10.1101/gr.249367.119 · DOI
  25. 10.1093/nar/gkz167 · DOI
  26. 2019, Predicting enhancer-promoter interaction from genomic sequence with deep neural networks, Quantitative Biology, 7, 122, 10.1007/s40484-019-0154-0 · DOI
  27. 10.1186/s13059-020-02238-2 · DOI
  28. 2022, Connecting high-resolution 3D chromatin organization with epigenomics, Nature communications, 13, 1
  29. 2019, Integrating Hi-C and FISH data for modeling of the 3D organization of chromosomes, Nature communications, 10, 1
  30. 10.1038/s41588-022-01065-4 · DOI · Paper page
  31. Ramanand, S. G. et al. The landscape of RNA polymerase II–associated chromatin interactions in prostate cancer. The Journal of clinical investigation 130 (2020). · DOI
  32. 10.1101/gr.220640.117 · DOI · Paper page
  33. 2021, HiCRep. py: Fast comparison of Hi-C contact matrices in Python, Bioinformatics, 37, 2996, 10.1093/bioinformatics/btab097 · DOI
  34. Safran, M. et al. GeneCards Version 3: the human gene integrator. Database 2010 (2010). · DOI
  35. 2016, The GeneCards suite: from gene data mining to disease genome sequence analyses, Current protocols in bioinformatics, 54, 30
  36. 10.1016/j.molcel.2010.05.004 · DOI · Paper page
  37. 10.1093/nar/gkt1249 · DOI
  38. 10.1016/S1046-2023(02)00005-1 · DOI
  39. 10.1126/science.aaf8084 · DOI
  40. 10.1016/0378-1119(91)90364-H · DOI
  41. Goodfellow, I. , Bengio, Y. & Courville, A. Deep Learning. (MIT Press, 2016).
  42. Kingma, D. P. & Ba, J. Adam: A method for stochastic optimization. arXiv preprint arXiv:1412.6980 (2014). · arXiv
  43. 10.1093/nar/gkw809 · DOI
  44. 10.1093/bioinformatics/btq033 · DOI · Paper page
  45. 10.1093/bioinformatics/btq636 · DOI
  46. 2001, Random forests, Machine learning, 45, 5, 10.1023/A:1010933404324 · DOI · Paper page
  47. 2011, Scikit-learn: Machine learning in Python, the Journal of machine Learning research, 12, 2825

Metadata

Authors
Abbas, A., Chandratre, K., Gao, Y., Yuan, J., Zhang, M. Q., & Mani, R. S.
Affiliations
  • The University of Texas Southwestern Medical Center (US)
  • The University of Texas at Dallas (US)
  • Chinese Academy of Medical Sciences & Peking Union Medical College (CN)
  • Harold C. Simmons Comprehensive Cancer Center (US)
Corresponding author
  • Zhang, Michael Q.
  • Mani, Ram S.
Venue
Genome biology
Publisher
openRxiv
Published
2022-11-25
Volume
25
Issue
1
Pages
15-15
ISSN
1465-6906 (ISSN-L)
OpenAlex
W4390790903
Cited by
13
References
1
Citations by year
2026: 4 · 2025: 3 · 2024: 6
FWCI
1.76
Type
journal article
Language
en
Open access
Licence
cc-by
Locations
  • Genome biology (publishedVersion, cc-by)
  • bioRxiv (Cold Spring Harbor Laboratory) (acceptedVersion, cc-by-nc-nd)
  • PubMed Central (publishedVersion, cc-by)
  • PubMed (publishedVersion)
  • DOAJ (DOAJ: Directory of Open Access Journals) (submittedVersion, cc-by-sa)
Funders
  • U.S. Department of Defense (W81XWH, W81XWH2110114)
  • Cancer Prevention and Research Institute of Texas (RP230382)
  • University of Texas Southwestern Medical Center
  • National Institutes of Health (W81XWH)
  • National Cancer Institute (R01CA245294)
Topics
  • Life Sciences › Biochemistry, Genetics and Molecular Biology › Molecular Biology › Genomics and Chromatin Dynamics
  • Life Sciences › Biochemistry, Genetics and Molecular Biology › Molecular Biology › Chromatin Remodeling and Cancer
  • Life Sciences › Biochemistry, Genetics and Molecular Biology › Genetics › Chromosomal and Genetic Variations
Keywords
3D genome organization, RAD21, H3K27ac, H3K27me3, CTCF binding, chromatin interaction prediction, deep neural network, gradient boosting, random forest, ChIA-PET
MeSH terms
CCCTC-Binding Factor, Cohesins, Chromatin, Chromosomal Proteins, Non-Histone, Cell Cycle Proteins

About these checks

Registry, retraction, Cites and statistics results are computed, not judged, with one exception: a printed reference that no index lists is read once by a model before it counts as a citation error. Claims are extracted by a model and kept only when their quote appears verbatim in the text; each cited source is then checked, with a model’s help, for whether it says what the claim relies on. Those verdicts can be wrong — read the claim’s quote and the cited source before relying on one.

Statistics and arithmetic are recomputed, not judged.

Confidence bands are shown only for fields calibrated on our annotated test set. None is calibrated yet, so no band is shown.

What counts as a claim ›How we measure confidence ›How we check this ›

Are you an author, or do you see a problem with this page? Request a review