PreprintCited by 105Protein Structure and DynamicsEnzyme Structure and FunctionMachine Learning in Bioinformatics

The DOI matches its Crossref record; 79 of the 81 references it cites were found in a registry or an index.

Systematic discovery of protein interaction interfaces using AlphaFold and experimental validation

Open access
Lee, Chop Yan, Hubrich, Dalmira, Varga, Julia K., Schäfer, Christian, Welzel, Mareen, Schumbera, Eric, Đokić, Milena, Strom, Joelle M., Schönfeld, Jonas, Geist, Johanna L., Polat, Feyza, Gibson, Toby J., Keller Valsecchi, Claudia Isabelle, Kumar, Manjeet, Schueler-Furman, Ora, Luck, Katja·2023·Molecular Systems Biology

Preprint — published as 10.1038/s44320-023-00005-6 · Paper page

Abstract

Structural resolution of protein interactions enables mechanistic and functional studies as well as interpretation of disease variants. However, structural data is still missing for most protein interactions because we lack computational and experimental tools at scale. We thoroughly assessed AlphaFold-Multimer accuracy for structure prediction of interactions involving folded domains binding to short linear motifs from the ELM database. The structure predictions were highly sensitive but not very specific when using small protein fragments. Sensitivity decreased substantially when using long protein fragments or full length proteins with intrinsically disordered regions. We delineated a fragmentation strategy to optimize sensitivity and applied it to interactions between proteins associated with neurodevelopmental disorders. This enabled prediction of highly confident and likely disease-related novel interfaces, but also resulted in many high scoring false positive predictions. Experiments supported predicted interfaces between CREBZF-HCFC1, FBXO23-STX1B, STX1B-VAMP2, ESRRG-PSMC5, PEX3-PEX19, PEX3-PEX16, and SNRPB-GIGYF1 providing novel molecular insights for diverse biological processes. Our work highlights exciting perspectives, but also reveals clear limitations and the need for future developments to maximize the power of Alphafold-Multimer for interface predictions.

Overview

The claims and statistics of this paper haven’t been checked yet.

Run the check — free, no account needed. It reads the open-access text and checks the sources it cites.

A few free checks a day · papers already verified open instantly · results are public

Integrity signals

Registry

Crossref · 10.1101/2023.08.07.552219

Cites

79 of 79 references verified0 citation errors · 0 not checkable

Statistics

Figures

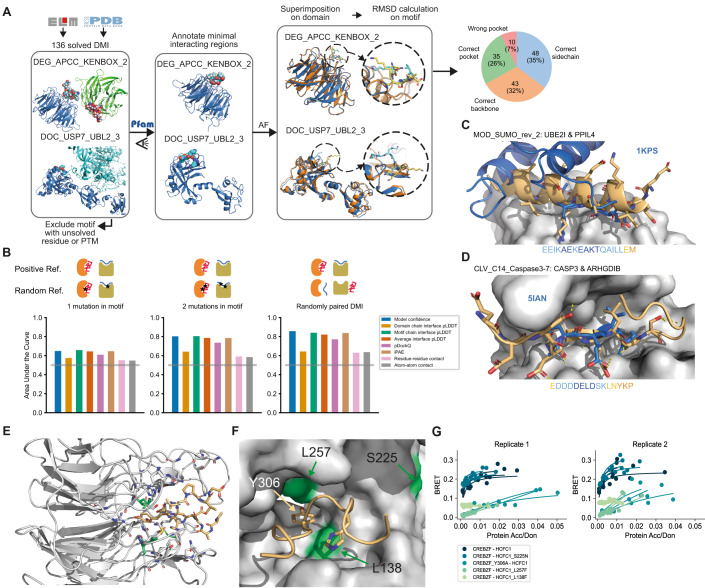
Figure 1 Benchmarking and application of AF for DMI interface prediction using minimal interacting fragments. (A) Schematic illustrating the assembly of the DMI positive reference dataset and evaluation of AF prediction accuracies by superimposition of the solved and modeled structures. Blue and cyan indicate the domain and motif in the native structure, respectively. Orange and yellow indicate the domain and motif in the modeled structure, respectively. Proportion of structures of DMIs predicted by AF to different levels of accuracy is shown on the right. (B) Area under the Receiver Operating Characteristics Curve (AUROC) for different metrics using the DMI benchmark dataset as positive reference and the following different random reference sets: Left, 1 mutation introduced in conserved motif position; middle, 2 mutations introduced in conserved motif positions; right, random reshuffling of domain-motif pairs. Gray horizontal line indicates the AUROC of a random predictor. (C) Superimposition of AF structural model for motif class MOD_SUMO_rev_2 (orange) with homologous solved structure (PDB:1KPS) from motif class MOD_SUMO_for_1 (blue). The motif sequence used for prediction is indicated at the bottom, colored by pLDDT (dark blue=highest pLDDT). (D) Superimposition of AF structural model for motif class CLV_C14_Caspase3-7 (orange) with homologous structure (PDB:5IAN) solved with a peptide-like inhibitor (blue). The motif sequence used for prediction is indicated at the bottom, colored by pLDDT (dark blue=highest pLDDT). (E) AF prediction of a LIG_HCF-1_HBM_1 motif in CREBZF (orange) binding to the beta-propeller Kelch domain of HCFC1 (gray). Mutated domain residues for experimental testing are colored in green. (F) Close up on the interface shown between CREBZF and HCFC1 from (E). Coloring is the same as in (E). Key conserved motif residues are drawn as sticks. Mutated residues in the domain and motif for experimental testing are labeled. (G) BRET titration curves are shown for wildtype interactions and mutant constructs for CREBZF-HCFC1 pairs for two biological replicates, each with three technical replicates. Protein acceptor over protein donor expression levels are plotted on the x-axis determined from fluorescence and luminescence measurements, respectively.
Figure 1 Benchmarking and application of AF for DMI interface prediction using minimal interacting fragments. (A) Schematic illustrating the assembly of the DMI positive reference dataset and evaluation of AF prediction accuracies by superimposition of the solved and modeled structures. Blue and cyan indicate the domain and motif in the native structure, respectively. Orange and yellow indicate the domain and motif in the modeled structure, respectively. Proportion of structures of DMIs predicted by AF to different levels of accuracy is shown on the right. (B) Area under the Receiver Operating Characteristics Curve (AUROC) for different metrics using the DMI benchmark dataset as positive reference and the following different random reference sets: Left, 1 mutation introduced in conserved motif position; middle, 2 mutations introduced in conserved motif positions; right, random reshuffling of domain-motif pairs. Gray horizontal line indicates the AUROC of a random predictor. (C) Superimposition of AF structural model for motif class MOD_SUMO_rev_2 (orange) with homologous solved structure (PDB:1KPS) from motif class MOD_SUMO_for_1 (blue). The motif sequence used for prediction is indicated at the bottom, colored by pLDDT (dark blue=highest pLDDT). (D) Superimposition of AF structural model for motif class CLV_C14_Caspase3-7 (orange) with homologous structure (PDB:5IAN) solved with a peptide-like inhibitor (blue). The motif sequence used for prediction is indicated at the bottom, colored by pLDDT (dark blue=highest pLDDT). (E) AF prediction of a LIG_HCF-1_HBM_1 motif in CREBZF (orange) binding to the beta-propeller Kelch domain of HCFC1 (gray). Mutated domain residues for experimental testing are colored in green. (F) Close up on the interface shown between CREBZF and HCFC1 from (E). Coloring is the same as in (E). Key conserved motif residues are drawn as sticks. Mutated residues in the domain and motif for experimental testing are labeled. (G) BRET titration curves are shown for wildtype interactions and mutant constructs for CREBZF-HCFC1 pairs for two biological replicates, each with three technical replicates. Protein acceptor over protein donor expression levels are plotted on the x-axis determined from fluorescence and luminescence measurements, respectively.CC BY · PubMed Central
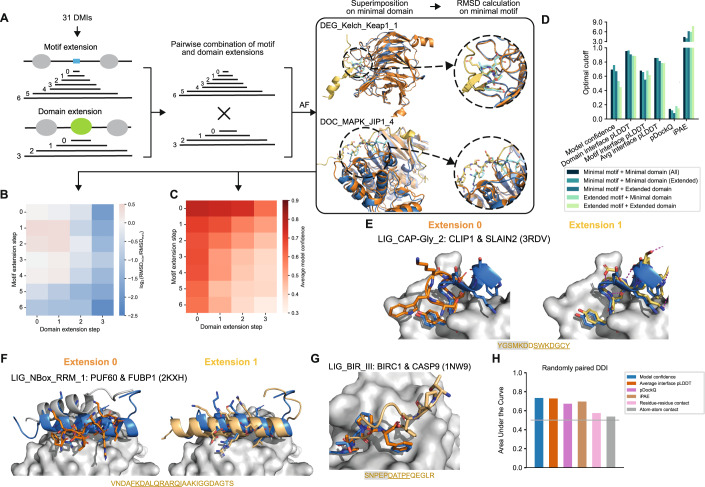
Figure 2 Effect of protein fragment extensions on the accuracy of AF predictions. (A) Workflow established to assess changes in AF performance upon protein fragment extension. Blue and cyan indicate the domain and motif in the native structure, respectively. Orange and yellow indicate the domain and motif in the modeled structure, respectively. (B) Heatmap showing the fold change in motif RMSD before and after extension where positive values indicate improved predictions from extension and negative values indicate worse prediction outcomes upon extension. (C) Heatmap of the average model confidence for combinations of different motif and domain sequence extensions. (D) Optimal cutoffs derived for different metrics from ROC analysis benchmarking AF different motif and domain extensions from the reference dataset used in A and random pairings of domain and motif sequences. pLDDT-related metrics were divided by 100 for visualization purposes. (E, F) Superimposition of the structural model of the minimal (left, orange) or extended (right, yellow) motif sequence with the solved structure (motif in blue) for two different motif classes as indicated on the top of each panel. The motif sequence from the solved structure is indicated at the bottom. Motif residues are underlined, motif residues not resolved in the structure have a gray background. Sticks indicate the motif residues, domain surfaces are shown in gray based on experimental structures. (G) Superimposition of the structural model of the minimal (orange) and extended (yellow) motif sequence with the solved structure (motif in blue) for a motif instance from the motif class LIG_BIR_III. Motif sequence indicated as in (E). (H) Area under the Receiver Operating Characteristics Curve (AUROC) for different metrics using the DDI benchmark dataset as positive reference and randomly shuffled domain-domain pairs as random reference. Gray horizontal line indicates the AUROC of a random predictor.
Figure 2 Effect of protein fragment extensions on the accuracy of AF predictions. (A) Workflow established to assess changes in AF performance upon protein fragment extension. Blue and cyan indicate the domain and motif in the native structure, respectively. Orange and yellow indicate the domain and motif in the modeled structure, respectively. (B) Heatmap showing the fold change in motif RMSD before and after extension where positive values indicate improved predictions from extension and negative values indicate worse prediction outcomes upon extension. (C) Heatmap of the average model confidence for combinations of different motif and domain sequence extensions. (D) Optimal cutoffs derived for different metrics from ROC analysis benchmarking AF different motif and domain extensions from the reference dataset used in A and random pairings of domain and motif sequences. pLDDT-related metrics were divided by 100 for visualization purposes. (E, F) Superimposition of the structural model of the minimal (left, orange) or extended (right, yellow) motif sequence with the solved structure (motif in blue) for two different motif classes as indicated on the top of each panel. The motif sequence from the solved structure is indicated at the bottom. Motif residues are underlined, motif residues not resolved in the structure have a gray background. Sticks indicate the motif residues, domain surfaces are shown in gray based on experimental structures. (G) Superimposition of the structural model of the minimal (orange) and extended (yellow) motif sequence with the solved structure (motif in blue) for a motif instance from the motif class LIG_BIR_III. Motif sequence indicated as in (E). (H) Area under the Receiver Operating Characteristics Curve (AUROC) for different metrics using the DDI benchmark dataset as positive reference and randomly shuffled domain-domain pairs as random reference. Gray horizontal line indicates the AUROC of a random predictor.CC BY · PubMed Central
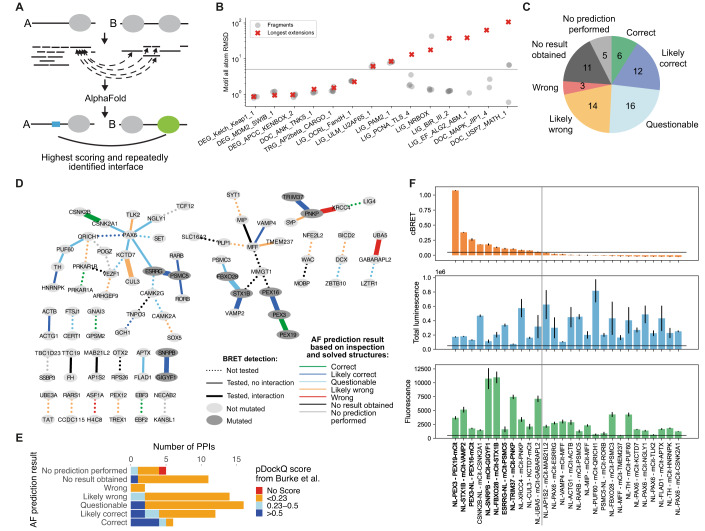
Figure 3 AF prediction and experiments on PPIs connecting NDD proteins. (A) Schematic of the fragmentation approach applied on a pair of interacting proteins, A and B. Proteins are fragmented into folded and disordered regions based on manual inspection. Disordered regions are further fragmented. All disordered and folded fragments of one protein are paired with the folded regions of the other protein and vice versa for AF prediction. (B) Accuracy measured in motif RMSD compared to native structures for models obtained from fragmenting proteins from 20 DMIs from the positive reference dataset and comparison to model accuracy obtained when using (near) full length proteins for structure prediction (red crosses). Only models that meet the cutoff for identifying high confident models are shown. Six DMIs did not result in any such model. The gray horizontal line indicates the RMSD cutoff used to identify accurate models (see methods for details). (C) AF prediction outcome on 67 HuRI PPIs connecting NDD proteins. (D) PPI networks illustrating AF prediction outcomes and experimental retesting of PPIs in BRET assay. (E) Number of PPIs connecting NDD proteins with structural models at indicated pDockQ cutoffs from (Burke et al, 2023) grouped based on AF prediction outcomes using the fragmentation approach as shown in (C). (F) cBRET, total luminescence, and fluorescence for 28 PPIs connecting NDD proteins that were tested in the BRET assay. Luminescence and fluorescence measurements indicate expression levels of NL and mCit fusion proteins, respectively. Black horizontal lines indicate expression level and PPI detection cutoffs. The gray vertical line separates the detected (left) from undetected PPIs. Protein pairs in bold indicate those selected for interface validation via site-directed mutagenesis. Error bars indicate STD of three technical replicates. Source data are available online for this figure.
Figure 3 AF prediction and experiments on PPIs connecting NDD proteins. (A) Schematic of the fragmentation approach applied on a pair of interacting proteins, A and B. Proteins are fragmented into folded and disordered regions based on manual inspection. Disordered regions are further fragmented. All disordered and folded fragments of one protein are paired with the folded regions of the other protein and vice versa for AF prediction. (B) Accuracy measured in motif RMSD compared to native structures for models obtained from fragmenting proteins from 20 DMIs from the positive reference dataset and comparison to model accuracy obtained when using (near) full length proteins for structure prediction (red crosses). Only models that meet the cutoff for identifying high confident models are shown. Six DMIs did not result in any such model. The gray horizontal line indicates the RMSD cutoff used to identify accurate models (see methods for details). (C) AF prediction outcome on 67 HuRI PPIs connecting NDD proteins. (D) PPI networks illustrating AF prediction outcomes and experimental retesting of PPIs in BRET assay. (E) Number of PPIs connecting NDD proteins with structural models at indicated pDockQ cutoffs from (Burke et al, 2023) grouped based on AF prediction outcomes using the fragmentation approach as shown in (C). (F) cBRET, total luminescence, and fluorescence for 28 PPIs connecting NDD proteins that were tested in the BRET assay. Luminescence and fluorescence measurements indicate expression levels of NL and mCit fusion proteins, respectively. Black horizontal lines indicate expression level and PPI detection cutoffs. The gray vertical line separates the detected (left) from undetected PPIs. Protein pairs in bold indicate those selected for interface validation via site-directed mutagenesis. Error bars indicate STD of three technical replicates. Source data are available online for this figure.CC BY · PubMed Central
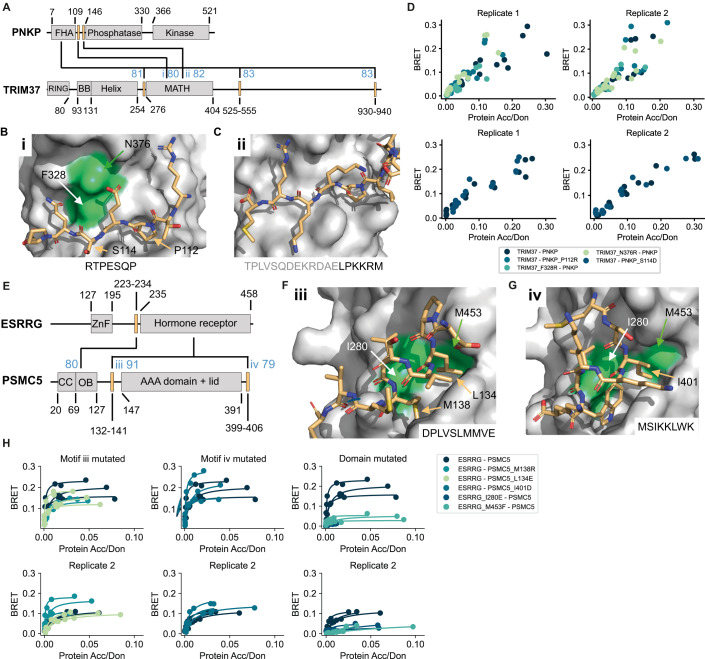
Figure 4 Verification of interface predictions for TRIM37-PNKP and ESRRG-PSMC5. (A) Schematic of the domain architecture of PNKP and TRIM37 with indication of top predicted interfaces. Numbers in blue indicate the motif interface pLDDT for the respective interface. Roman numbering refers to structural models in (B) and (C). (B) Structural model of interface i shown in (A) with labeled residues that were mutated. (C) Structural model of interface ii shown in (A). (D) BRET titration curves are shown for wildtype interaction and mutants for two biological replicates, each with three technical replicates. Protein acceptor over protein donor expression levels are plotted on the x-axis determined from fluorescence and luminescence measurements, respectively. The BRET trajectory could not be fitted because of an unusual saturation behavior (see methods for details). (E) Schematic of the domain architecture of ESRRG and PSMC5 with indication of top predicted interfaces. Numbers in blue indicate the motif interface pLDDT for the respective interface. Roman numbering refers to structural models in (F) and (G). (F) Structural model of interface iii shown in (E) with labeled residues that were mutated. (G) Structural model of interface iv shown in (E). (H) BRET titration curves are shown for wildtype interaction and mutants of ESRRG-PSMC5 pairs for two biological replicates, each with three technical replicates. Protein acceptor over protein donor expression levels are plotted on the x-axis determined from fluorescence and luminescence measurements, respectively. In panels (B), (C), (F), and (G) motif sequences are indicated at the bottom. Gray letters indicate residues not predicted to bind. Source data are available online for this figure.
Figure 4 Verification of interface predictions for TRIM37-PNKP and ESRRG-PSMC5. (A) Schematic of the domain architecture of PNKP and TRIM37 with indication of top predicted interfaces. Numbers in blue indicate the motif interface pLDDT for the respective interface. Roman numbering refers to structural models in (B) and (C). (B) Structural model of interface i shown in (A) with labeled residues that were mutated. (C) Structural model of interface ii shown in (A). (D) BRET titration curves are shown for wildtype interaction and mutants for two biological replicates, each with three technical replicates. Protein acceptor over protein donor expression levels are plotted on the x-axis determined from fluorescence and luminescence measurements, respectively. The BRET trajectory could not be fitted because of an unusual saturation behavior (see methods for details). (E) Schematic of the domain architecture of ESRRG and PSMC5 with indication of top predicted interfaces. Numbers in blue indicate the motif interface pLDDT for the respective interface. Roman numbering refers to structural models in (F) and (G). (F) Structural model of interface iii shown in (E) with labeled residues that were mutated. (G) Structural model of interface iv shown in (E). (H) BRET titration curves are shown for wildtype interaction and mutants of ESRRG-PSMC5 pairs for two biological replicates, each with three technical replicates. Protein acceptor over protein donor expression levels are plotted on the x-axis determined from fluorescence and luminescence measurements, respectively. In panels (B), (C), (F), and (G) motif sequences are indicated at the bottom. Gray letters indicate residues not predicted to bind. Source data are available online for this figure.CC BY · PubMed Central
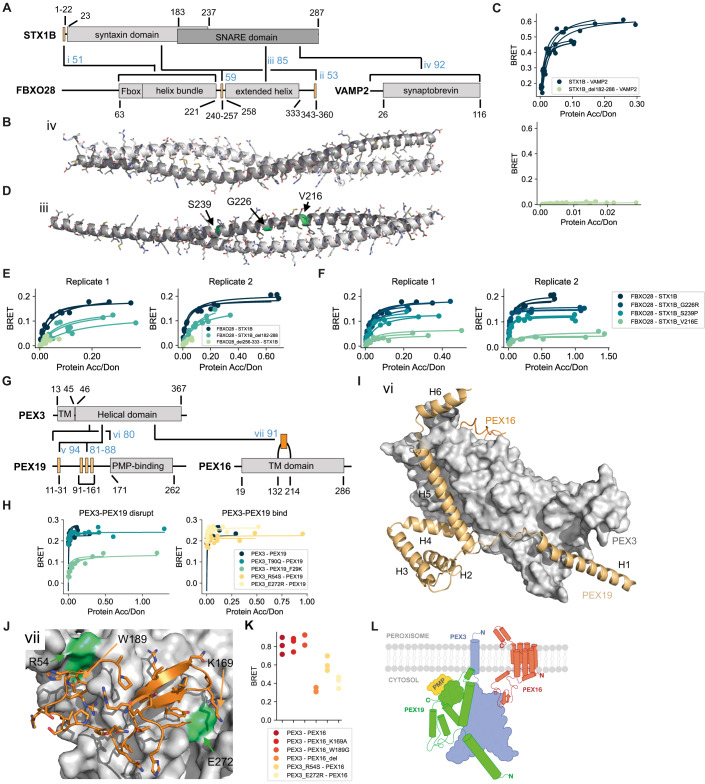
Figure 5 Verification of interface predictions for STX1B-FBXO28, STX1B-VAMP2, PEX3-PEX19, and PEX3-PEX16. (A) Schematic of the domain architecture of STX1B, FBXO28, and VAMP2 with indication of top predicted interfaces. Numbers in blue indicate the motif interface pLDDT (for order-disorder fragment pairs) or average interface pLDDT (for ordered-ordered fragment pairs) for the respective interface. Roman numbering refers to structural models in (B), (D), Appendix Fig. S8E, and Appendix Fig. S8I. (B) Structural model of interface iv shown in (A). In panel (B) and (D), the chains are color-coded according to the colors of the domains in (A). (C) BRET titration curves are shown for wildtype interactions and deletion constructs for two biological replicates, each with three technical replicates. Protein acceptor over protein donor expression levels are plotted on the x-axis determined from fluorescence and luminescence measurements, respectively. (D) Structural model of interface iii shown in (A) with tested pathogenic mutations labeled and colored in green. (E, F) BRET titration curves are shown for wildtype interactions and deletion constructs for two biological replicates, each with three technical replicates. Protein acceptor over protein donor expression levels are plotted on the x-axis determined from fluorescence and luminescence measurements, respectively. (G) Schematic of the domain architecture of PEX3, PEX19, and PEX16 with indication of top predicted interfaces. Numbers in blue indicate the motif interface pLDDT for the respective interface. Roman numbering refers to structural models in (I), (J), and Appendix Fig. S9A. Region vi covers residues 1–170, which includes the previously reported N-terminal motif as well as three putative motifs suggested by the AF models. (H) BRET titration curves are shown for wildtype interaction and mutants of PEX3-PEX19 pairs for three technical replicates. Protein acceptor over protein donor expression levels are plotted on the x-axis determined from fluorescence and luminescence measurements, respectively. The left plot displays mutants aimed at disrupting binding between PEX3-PEX19 while the right plot displays mutants aimed at disrupting the PEX3-PEX16 PPI why binding between PEX3-PEX19 should not be altered. (I) Superimposition of structural models of interface vi (PEX3-PEX19) and vii (PEX3-PEX16) on the PEX3 domain. Note that modeling smaller fragments of PEX19 generates alternative interactions with the binding sites. (J) Structural model of interface vii shown in (G). (K) BRET values with subtracted bleedthrough for PEX3-PEX16 wildtype and various mutated constructs. Three technical replicates are shown. (L) Proposed model for how the trimeric complex of PEX3, PEX19, and PEX16 might assemble at the peroxisomal membrane. Source data are available online for this figure.
Figure 5 Verification of interface predictions for STX1B-FBXO28, STX1B-VAMP2, PEX3-PEX19, and PEX3-PEX16. (A) Schematic of the domain architecture of STX1B, FBXO28, and VAMP2 with indication of top predicted interfaces. Numbers in blue indicate the motif interface pLDDT (for order-disorder fragment pairs) or average interface pLDDT (for ordered-ordered fragment pairs) for the respective interface. Roman numbering refers to structural models in (B), (D), Appendix Fig. S8E, and Appendix Fig. S8I. (B) Structural model of interface iv shown in (A). In panel (B) and (D), the chains are color-coded according to the colors of the domains in (A). (C) BRET titration curves are shown for wildtype interactions and deletion constructs for two biological replicates, each with three technical replicates. Protein acceptor over protein donor expression levels are plotted on the x-axis determined from fluorescence and luminescence measurements, respectively. (D) Structural model of interface iii shown in (A) with tested pathogenic mutations labeled and colored in green. (E, F) BRET titration curves are shown for wildtype interactions and deletion constructs for two biological replicates, each with three technical replicates. Protein acceptor over protein donor expression levels are plotted on the x-axis determined from fluorescence and luminescence measurements, respectively. (G) Schematic of the domain architecture of PEX3, PEX19, and PEX16 with indication of top predicted interfaces. Numbers in blue indicate the motif interface pLDDT for the respective interface. Roman numbering refers to structural models in (I), (J), and Appendix Fig. S9A. Region vi covers residues 1–170, which includes the previously reported N-terminal motif as well as three putative motifs suggested by the AF models. (H) BRET titration curves are shown for wildtype interaction and mutants of PEX3-PEX19 pairs for three technical replicates. Protein acceptor over protein donor expression levels are plotted on the x-axis determined from fluorescence and luminescence measurements, respectively. The left plot displays mutants aimed at disrupting binding between PEX3-PEX19 while the right plot displays mutants aimed at disrupting the PEX3-PEX16 PPI why binding between PEX3-PEX19 should not be altered. (I) Superimposition of structural models of interface vi (PEX3-PEX19) and vii (PEX3-PEX16) on the PEX3 domain. Note that modeling smaller fragments of PEX19 generates alternative interactions with the binding sites. (J) Structural model of interface vii shown in (G). (K) BRET values with subtracted bleedthrough for PEX3-PEX16 wildtype and various mutated constructs. Three technical replicates are shown. (L) Proposed model for how the trimeric complex of PEX3, PEX19, and PEX16 might assemble at the peroxisomal membrane. Source data are available online for this figure.CC BY · PubMed Central
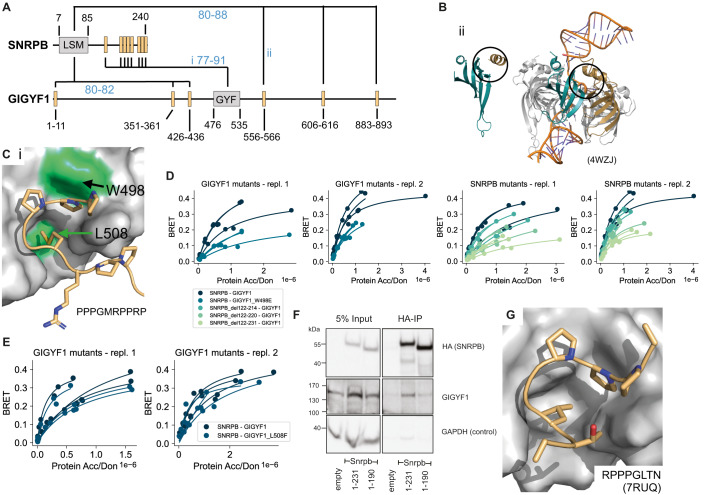
Figure 6 Verification of interface predictions for SNRPB-GIGYF1. (A) Schematic of the domain architecture of SNRPB and GIGYF1 with indication of top predicted interfaces. Numbers in blue indicate the motif interface pLDDT for the respective interface. Roman numbering refers to structural models in (B) and (C). (B) Structural model of interface ii shown in (A) (left) and in comparison a solved structure (PDB:4WZJ) of the Sm ring complex (right) bound to RNA (orange). The LSM domain of SNRPB is shown in cyan. The position of the predicted motif (left) or neighboring LSM domain of SNRPD3 (right) are indicated in gold. Black circles indicate the predicted interface in the model and corresponding interface in the complex on the LSM domain of SNRPB. (C) Structural model of interface i shown in (A) with tested domain mutations labeled and colored green. The motif sequence is indicated at the bottom. (D, E) BRET titration curves are shown for wildtype interactions, deletion constructs of SNRPB, and single point mutants in GIGYF1 for two biological replicates, each with three technical replicates. Protein acceptor over protein donor expression levels are plotted on the x-axis determined from fluorescence and luminescence measurements, respectively. (F) Cropped immunoblot of input (5%) and HA antibody immunoprecipitation (IP) performed in parental HEK cells (empty, untagged negative control), Snrpb(full-length, 1-231)-2xHA-mNeonGreen, Snrpb(1-190)-2xHA-mNeonGreen expressed from a single locus in Flp-In™ T-REx™ 293 Cell Lines. The HA antibody was used for detecting the immunoprecipitated Snrpb-proteins, endogenous GIGYF1 was detected with GIGYF1 antibody, GAPDH serves as a loading and negative-IP control. The experiment was performed twice with equivalent outcome, one representative experiment is shown. (G) Solved structure (PDB:7RUQ) of the GYF domain of GIGYF1 bound to a proline-rich motif in TNRC6C. The sequence of the motif in TNRC6C is indicated. Source data are available online for this figure.
Figure 6 Verification of interface predictions for SNRPB-GIGYF1. (A) Schematic of the domain architecture of SNRPB and GIGYF1 with indication of top predicted interfaces. Numbers in blue indicate the motif interface pLDDT for the respective interface. Roman numbering refers to structural models in (B) and (C). (B) Structural model of interface ii shown in (A) (left) and in comparison a solved structure (PDB:4WZJ) of the Sm ring complex (right) bound to RNA (orange). The LSM domain of SNRPB is shown in cyan. The position of the predicted motif (left) or neighboring LSM domain of SNRPD3 (right) are indicated in gold. Black circles indicate the predicted interface in the model and corresponding interface in the complex on the LSM domain of SNRPB. (C) Structural model of interface i shown in (A) with tested domain mutations labeled and colored green. The motif sequence is indicated at the bottom. (D, E) BRET titration curves are shown for wildtype interactions, deletion constructs of SNRPB, and single point mutants in GIGYF1 for two biological replicates, each with three technical replicates. Protein acceptor over protein donor expression levels are plotted on the x-axis determined from fluorescence and luminescence measurements, respectively. (F) Cropped immunoblot of input (5%) and HA antibody immunoprecipitation (IP) performed in parental HEK cells (empty, untagged negative control), Snrpb(full-length, 1-231)-2xHA-mNeonGreen, Snrpb(1-190)-2xHA-mNeonGreen expressed from a single locus in Flp-In™ T-REx™ 293 Cell Lines. The HA antibody was used for detecting the immunoprecipitated Snrpb-proteins, endogenous GIGYF1 was detected with GIGYF1 antibody, GAPDH serves as a loading and negative-IP control. The experiment was performed twice with equivalent outcome, one representative experiment is shown. (G) Solved structure (PDB:7RUQ) of the GYF domain of GIGYF1 bound to a proline-rich motif in TNRC6C. The sequence of the motif in TNRC6C is indicated. Source data are available online for this figure.CC BY · PubMed Central

Verification

Claims the paper makes

The claims and statistics of this paper haven’t been checked yet.

Run the check — free, no account needed. It reads the open-access text and checks the sources it cites.

A few free checks a day · papers already verified open instantly · results are public

Self-check

Percentages, sums and reported differences re-computed from the paper’s own numbers.

The self-check needs the paper’s full text.

Citations

Cites

Show all 81 references

Research works printed but not linked: 5

  1. 10.1101/2023.05.25.542287 · DOI · Paper page
  2. 10.1101/2023.03.23.533951 · DOI
  3. 10.1016/j.cell.2021.04.011 · DOI · Paper page
  4. Pedregosa F , Varoquaux G , Gramfort A , Michel V , Thirion B , Grisel O , Blondel M , Müller A , Nothman J , Louppe G , et al (2012) Scikit-learn: Machine Learning in Python. arXiv
  5. 10.1101/2023.06.14.544560 · DOI

Cited by

Sorted by citations

Items 101–105 of 105

Metadata

Authors
Lee, C. Y., Hubrich, D., Varga, J. K., Schäfer, C., Welzel, M., Schumbera, E., Đokić, M., Strom, J. M., Schönfeld, J., Geist, J. L., Polat, F., Gibson, T. J., Keller Valsecchi, C. I., Kumar, M., Schueler-Furman, O., & Luck, K.
Affiliations
  • Institute of Molecular Biology (DE)
  • Hebrew University of Jerusalem (IL)
  • European Molecular Biology Laboratory (DE)
Corresponding author
Luck, Katja
Venue
Molecular Systems Biology
Publisher
openRxiv
Published
2023-08-09
Volume
20
Issue
2
Pages
75-97
ISSN
1744-4292 (ISSN-L)
OpenAlex
W4390876228
Cited by
105
References
81
Citations by year
2026: 36 · 2025: 46 · 2024: 20 · 2023: 3
FWCI
13.84
Type
journal article
Language
en
Open access
Licence
cc-by
Locations
  • Molecular Systems Biology (publishedVersion, cc-by)
  • bioRxiv (Cold Spring Harbor Laboratory) (acceptedVersion, cc-by-nc-nd)
  • PubMed Central (publishedVersion, cc-by)
  • PubMed (publishedVersion)
  • DOAJ (DOAJ: Directory of Open Access Journals) (submittedVersion, cc-by-sa)
Funders
  • European Commission (HORIZON2020, 860517)
  • Deutsche Forschungsgemeinschaft (SFB1551, 464588647, LU2568/1–1)
  • Israel Science Foundation (301/2021)
Topics
  • Life Sciences › Biochemistry, Genetics and Molecular Biology › Molecular Biology › Protein Structure and Dynamics
  • Life Sciences › Biochemistry, Genetics and Molecular Biology › Structural Biology › Enzyme Structure and Function
  • Life Sciences › Biochemistry, Genetics and Molecular Biology › Molecular Biology › Machine Learning in Bioinformatics
Keywords
protein-protein interfaces, AlphaFold-Multimer, intrinsically disordered regions, short linear motifs, neurodevelopmental disorders
MeSH terms
Carrier Proteins, Humans, Membrane Proteins, Proteins

About these checks

Registry, retraction, Cites and statistics results are computed, not judged, with one exception: a printed reference that no index lists is read once by a model before it counts as a citation error. Claims are extracted by a model and kept only when their quote appears verbatim in the text; each cited source is then checked, with a model’s help, for whether it says what the claim relies on. Those verdicts can be wrong — read the claim’s quote and the cited source before relying on one.

Statistics and arithmetic are recomputed, not judged.

Confidence bands are shown only for fields calibrated on our annotated test set. None is calibrated yet, so no band is shown.

What counts as a claim ›How we measure confidence ›How we check this ›

Are you an author, or do you see a problem with this page? Request a review