

DeepEnzyme: a robust deep learning model for improved enzyme turnover number prediction by utilizing features of protein 3D structures
Open accessPreprint — published as 10.1093/bib/bbae409 · Paper page
The DOI matches its Crossref record; 2 of the 2 references it cites were found in a registry or an index.
Abstract
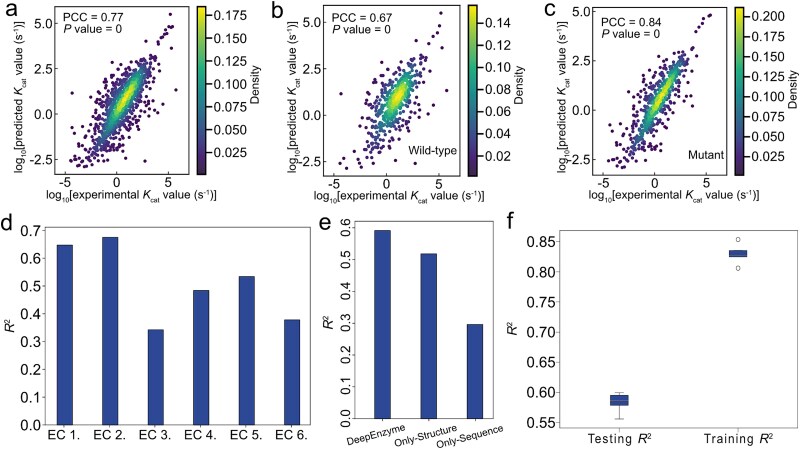
Turnover numbers (kcat), which indicate an enzyme’s catalytic efficiency, have a wide range of applications in fields including protein engineering and synthetic biology. Experimentally measuring the enzymes’ kcat is always time-consuming. Recently, the prediction of kcat using deep learning models has mitigated this problem. However, the accuracy and robustness in kcat prediction still needs to be improved significantly, particularly when dealing with enzymes with low sequence similarity compared to those within the training dataset. Herein, we present DeepEnzyme, a cutting-edge deep learning model that combines the most recent Transformer and Graph Convolutional Network (GCN) architectures. To improve the prediction accuracy, DeepEnzyme was trained by leveraging the integrated features from both sequences and 3D structures. Consequently, our model exhibits remarkable robustness when processing enzymes with low sequence similarity compared to those in the training dataset by utilizing additional features from high-quality protein 3D structures. DeepEnzyme also makes it possible to evaluate how point mutations affect the catalytic activity of the enzyme, which helps identify residue sites that are crucial for the catalytic function. In summary, DeepEnzyme represents a pioneering effort in predicting enzymes’ kcat values with superior accuracy and robustness compared to previous algorithms. This advancement will significantly contribute to our comprehension of enzyme function and its evolutionary patterns across species.
Overview
The claims and statistics of this paper haven’t been checked yet.
Free: it reads the open-access text and checks the first 5 claims that cite a source we can check. Create a free account to check every claim.
Integrity signals
Registry
Cites
Statistics
Figures



Verification
Claims the paper makes
The claims and statistics of this paper haven’t been checked yet.
Free: it reads the open-access text and checks the first 5 claims that cite a source we can check. Create a free account to check every claim.
Self-check
Percentages, sums and reported differences re-computed from the paper’s own numbers.
The self-check needs the paper’s full text.
Citations
Cites
Highly accurate protein structure prediction with AlphaFold
Jumper, J., Evans, R., Pritzel, A., Green, T., Figurnov, M., Ronneberger, O., Tunyasuvunakool, K., Bates, R., Žídek, A., Potapenko, A., et al. (2021) · Nature · doi:10.1038/s41586-021-03819-2 · Cited by 43,764
Deep learning-based kcat prediction enables improved enzyme-constrained model reconstruction
Li, F., Yuan, L., Lu, H., Li, G., Chen, Y., Engqvist, M. K. M., Kerkhoven, E. J., & Nielsen, J. (2022) · Nature Catalysis · doi:10.1038/s41929-022-00798-z · Cited by 466
Self-citation
Research works printed but not linked: 38
- 2023, Data integration across conditions improves turnover number estimates and metabolic predictions, Nature Communications, 14, 1485, 10.1038/s41467-023-37151-2 · DOI · Paper page
- 10.1073/pnas.1514240113 · DOI · Paper page
- 2017, Metabolic models of protein allocation call for the kinetome, Cell Systems, 5, 538, 10.1016/j.cels.2017.11.013 · DOI · Paper page
- Sánchez, B.J. , et al. Improving the phenotype predictions of a yeast genome -scale metabolic model by incorporating enzymatic constraints. Molecular systems biology 13, 935 (2017). · DOI · Paper page
- 10.1016/j.mib.2018.01.002 · DOI · Paper page
- 2017, The BRENDA enzyme information system–From a database to an expert system, Journal of biotechnology, 261, 194, 10.1016/j.jbiotec.2017.04.020 · DOI · Paper page
- 10.1093/nar/gkx1065 · DOI · Paper page
- 10.1093/NAR/GKAC1052 · DOI · Paper page
- 2021, Structure-based protein function prediction using graph convolutional networks, Nature communications, 12, 3168, 10.1038/s41467-021-23303-9 · DOI · Paper page
- 2020, Deep learning suggests that gene expression is encoded in all parts of a co-evolving interacting gene regulatory structure, Nature Communications, 11, 6141, 10.1038/s41467-020-19921-4 · DOI · Paper page
- 2018, Machine learning applied to enzyme turnover numbers reveals protein structural correlates and improves metabolic models, Nature communications, 9, 5252, 10.1038/s41467-018-07652-6 · DOI · Paper page
- Kroll, A. , Hu, X.-P. , Liebrand, N.A. & Lercher, M.J . Turnover number predictions for kinetically uncharacterized enzymes using machine and deep learning. bioRxiv, 2022.2011. 2010.516024 (2022). · DOI
- Goodsell, D.S. The machinery of life. (2009). · DOI · Paper page
- 2019, The importance of catalytic promiscuity for enzyme design and evolution, Nature Reviews Chemistry, 3, 687, 10.1038/s41570-019-0143-x · DOI · Paper page
- 2019, Elucidating structure–performance relationships in whole-cell cooperative enzyme catalysis, Nature catalysis, 2, 809, 10.1038/s41929-019-0321-8 · DOI
- 10.1371/journal.pcbi.1008291 · DOI · Paper page
- 2018, High precision protein functional site detection using 3D convolutional neural networks, Bioinformatics, 35, 1503
- 10.1126/science.abj8754 · doi:10.1126/science.abj8754 · Paper page
- 2022, ColabFold: making protein folding accessible to all, Nature methods, 19, 679, 10.1038/s41592-022-01488-1 · doi:10.1038/s41592-022-01488-1 · Paper page
- Kipf, T.N. & Welling, M. Semi-supervised classification with graph convolutional networks. arXiv preprint arXiv:1609.02907 (2016). · arXiv
- Duvenaud, D.K. , et al. Convolutional networks on graphs for learning molecular fingerprints. Advances in neural information processing systems 28 (2015).
- 2017, Convolutional embedding of attributed molecular graphs for physical property prediction, Journal of chemical information and modeling, 57, 1757, 10.1021/acs.jcim.6b00601 · DOI · Paper page
- Vaswani, A. , et al. Attention is all you need. Advances in neural information processing systems 30 (2017).
- 10.1126/science.ade2574 · doi:10.1126/science.ade2574 · Paper page
- Madani, A. , et al. Large language models generate functional protein sequences across diverse families. Nature Biotechnology, 1–8 (2023). · DOI · Paper page
- Landrum, G . RDKit: A software suite for cheminformatics, computational chemistry, and predictive modeling. Greg Landrum 8, 31 (2013).
- 2023, A general model to predict small molecule substrates of enzymes based on machine and deep learning, Nature Communications, 14, 2787, 10.1038/s41467-023-38347-2 · DOI · Paper page
- 10.1038/nbt.3988 · DOI · Paper page
- van Kempen, M. , et al. Fast and accurate protein structure search with Foldseek. Nature Biotechnology (2023). · DOI · Paper page
- 2022, US-align: universal structure alignments of proteins, nucleic acids, and macromolecular complexes, Nature Methods, 19, 1109, 10.1038/s41592-022-01585-1 · DOI · Paper page
- 10.1146/annurev.pharmtox.45.120403.095821 · DOI · Paper page
- 2013, Cytochrome P450 enzymes in drug metabolism: regulation of gene expression, enzyme activities, and impact of genetic variation, Pharmacology & therapeutics, 138, 103, 10.1016/j.pharmthera.2012.12.007 · DOI · Paper page
- 10.1097/00008571-199710000-00004 · DOI · Paper page
- 10.1016/j.ajhg.2021.07.001 · DOI
- 10.1371/journal.pbio.3001402 · DOI · Paper page
- Yu, H. , Deng, H. , He, J. , Keasling, J. & Luo, X. Highly accurate enzyme turnover number prediction and enzyme engineering with PreKcat. (2023). · DOI · Paper page
- 2022, Lm-gvp: an extensible sequence and structure informed deep learning framework for protein property prediction, Scientific reports, 12, 6832, 10.1038/s41598-022-10775-y · DOI · Paper page
- 2020, SciPy 1.0: fundamental algorithms for scientific computing in Python, Nature methods, 17, 261, 10.1038/s41592-019-0686-2 · DOI · Paper page
Metadata
- Authors
- Wang, T., Xiang, G., He, S., Su, L., Yan, X., & Lu, H.
- Affiliations
- Shanghai Jiao Tong University (CN)
- Chongqing University of Technology (CN)
- East China University of Science and Technology (CN)
- Corresponding author
- Lu, Hongzhong
- Venue
- Briefings in Bioinformatics
- Publisher
- openRxiv
- Published
- 2023-12-10
- Volume
- 25
- Issue
- 5
- ISSN
- 1467-5463 (ISSN-L)
- PMC
- PMC11880767
- OpenAlex
- W4401715368
- Cited by
- 57
- References
- 2
- Citations by year
- 2026: 30 · 2025: 22 · 2024: 5
- FWCI
- 7.74
- Type
- journal article
- Language
- en
- Open access
- gold
- doi.org
- Licence
- cc-by
- Locations
- Briefings in Bioinformatics (publishedVersion, cc-by)
- bioRxiv (Cold Spring Harbor Laboratory) (acceptedVersion)
- PubMed Central (publishedVersion, cc-by)
- PubMed (publishedVersion)
- Funders
- National Natural Science Foundation of China (22208211, 22378263)
- Shanghai Jiao Tong University
- National Key Research and Development Program of China (2022YFA0913000)
- Topics
- Life Sciences › Biochemistry, Genetics and Molecular Biology › Molecular Biology › Machine Learning in Bioinformatics
- Life Sciences › Biochemistry, Genetics and Molecular Biology › Molecular Biology › Protein Structure and Dynamics
- Life Sciences › Biochemistry, Genetics and Molecular Biology › Structural Biology › Enzyme Structure and Function
- Keywords
- turnover number, catalytic efficiency, protein 3D structure, protein sequences, transformer models, graph convolutional networks, low sequence similarity, catalytic residues
- MeSH terms
- Deep Learning, Algorithms, Enzymes, Models, Molecular, Protein Conformation, Proteins, Computational Biology
About these checks
Registry, retraction, Cites and statistics results are computed, not judged, with one exception: a printed reference that no index lists is read once by a model before it counts as a citation error. Claims are extracted by a model and kept only when their quote appears verbatim in the text; each cited source is then checked, with a model’s help, for whether it says what the claim relies on. Those verdicts can be wrong — read the claim’s quote and the cited source before relying on one.
Statistics and arithmetic are recomputed, not judged.
Confidence bands are shown only for fields calibrated on our annotated test set. None is calibrated yet, so no band is shown.
What counts as a claim ›How we measure confidence ›How we check this ›
Are you an author, or do you see a problem with this page? Request a review
How to cite
Cite CoChat for the checks on this page, and the paper for its own findings.
- This page
- CoChat. (2026). Citation check: DeepEnzyme: a robust deep learning model for improved enzyme turnover number prediction by utilizing features of protein 3D structures. https://app.cochat.ai/papers/10.1101/2023.12.09.570923
- The paper
- Wang, T., Xiang, G., He, S., Su, L., Yan, X., & Lu, H. (2023). DeepEnzyme: a robust deep learning model for improved enzyme turnover number prediction by utilizing features of protein 3D structures. Briefings in Bioinformatics. https://doi.org/10.1101/2023.12.09.570923
Data sources
Bibliographic data: Semantic Scholar, OpenAlex, Crossref.
Contains information from the Semantic Scholar Academic Graph Datasets, made available under the ODC Attribution License (ODC-BY 1.0).
Semantic Scholar’s data is described in: Kinney, R., et al. (2023). The Semantic Scholar Open Data Platform. arXiv:2301.10140.
