PreprintCited by 29Protein Structure and DynamicsMachine Learning in BioinformaticsBioinformatics and Genomic Networks

The DOI matches its Crossref record; 1 of the 1 references it cites were found in a registry or an index.

SpatialPPI: three-dimensional space protein-protein interaction prediction with AlphaFold Multimer

Open access
Hu, Wenxing, Ohue, Masahito·2023·Computational and Structural Biotechnology Journal

Preprint — published as 10.1016/j.csbj.2024.03.009

Abstract

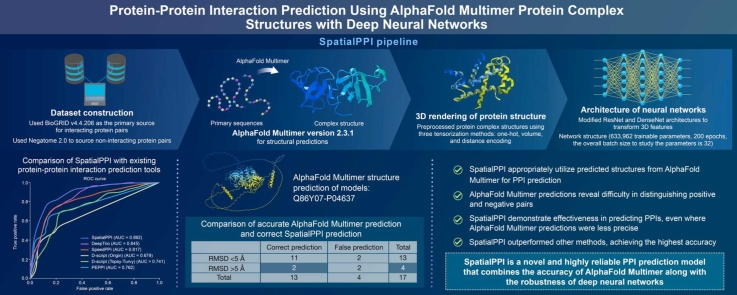
The rapid advancement of protein sequencing technology has resulted in a gap between proteins with identified sequences and those with mapped structures. Although sequence-based predictions offer insights, they can be incomplete due to the absence of structural details. On the other hand, structure-based methods face challenges with newly sequenced proteins. AlphaFold emerges as a potential solution, especially in predicting protein-protein interactions. This research delves into using deep neural networks, specifically analyzing protein complex structures as predicted by AlphaFold Multimer. By transforming atomic coordinates and utilizing sophisticated image processing techniques, the study extracts vital 3D structural details from protein complexes. Recognizing the significance of evaluating residue distances in protein interactions, the study leverages image recognition approaches, notably integrating DenseNet and ResNet within 3D convolutional networks for protein 3D structure analysis. When benchmarked against leading protein-protein interaction prediction methods like SpeedPPI, D-script, DeepTrio, and PEPPI, our proposed method, named SpatialPPI, exhibits notable efficacy, emphasizing the promising role of 3D spatial processing in advancing the realm of structural biology. Abstract Figure:

Overview

The claims and statistics of this paper haven’t been checked yet.

Run the check — free, no account needed. It reads the open-access text and checks the sources it cites.

A few free checks a day · papers already verified open instantly · results are public

Integrity signals

Registry

Crossref · 10.1101/2023.12.14.571766

Cites

1 of 1 references verified0 citation errors · 0 not checkable

Statistics

Figures

Graphical abstract
Graphical abstract CC BY · PubMed Central
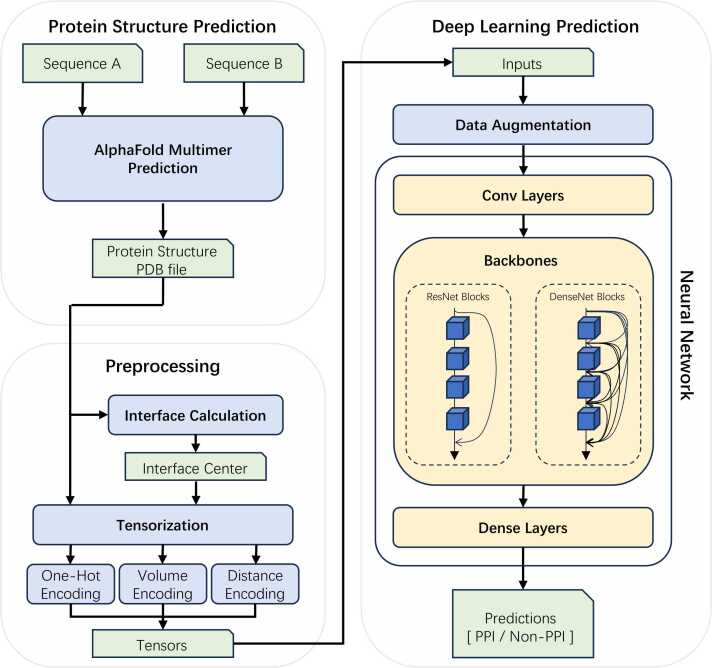
Fig. 1 Flow chart of SpatialPPI. First, the AlphaFold Multimer predicts the two-input protein sequences and generates the structure of the protein complex, which is stored in a PDB file. The protein complex is tensorized by calculating its interface using either one-hot encoding, volume encoding, or distance encoding. The tensor is then passed to the neural network as input data. After data augmentation, the DenseNet backbone or ResNet backbone predicts and outputs the probability that the input proteins can interact with each other.
Fig. 1 Flow chart of SpatialPPI. First, the AlphaFold Multimer predicts the two-input protein sequences and generates the structure of the protein complex, which is stored in a PDB file. The protein complex is tensorized by calculating its interface using either one-hot encoding, volume encoding, or distance encoding. The tensor is then passed to the neural network as input data. After data augmentation, the DenseNet backbone or ResNet backbone predicts and outputs the probability that the input proteins can interact with each other.CC BY · PubMed Central
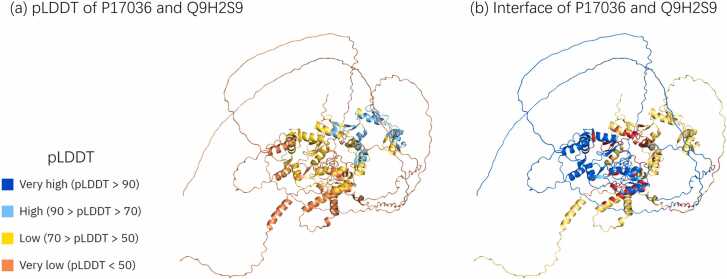
Fig. 2 Examples of disordered areas, which usually appear in the AlphaFold prediction result. Disordered areas are often flexible and float in space. In the prediction results of the AlphaFold Multimer, the disordered area is often intertwined with the rest of the structure, and the distance is lower than the common contact threshold, which is 8 Å. (a) and (b) Represent AlphaFold Multimer predicted structure of protein complexes P17036 and Q9H2S9. (a) The pLDDT score of the predicted structure, where the color indicates the level of the pLDDT score. It can be observed that there is a large disordered area on the periphery of the structure. (b) The interface between the two structures. The blue and yellow parts represent two chains, respectively, and the red area represents the interface residues whose distance is less than 8 Å. Multiple contact areas formed by disordered areas intertwining with each other are presented in the figure.
Fig. 2 Examples of disordered areas, which usually appear in the AlphaFold prediction result. Disordered areas are often flexible and float in space. In the prediction results of the AlphaFold Multimer, the disordered area is often intertwined with the rest of the structure, and the distance is lower than the common contact threshold, which is 8 Å. (a) and (b) Represent AlphaFold Multimer predicted structure of protein complexes P17036 and Q9H2S9. (a) The pLDDT score of the predicted structure, where the color indicates the level of the pLDDT score. It can be observed that there is a large disordered area on the periphery of the structure. (b) The interface between the two structures. The blue and yellow parts represent two chains, respectively, and the red area represents the interface residues whose distance is less than 8 Å. Multiple contact areas formed by disordered areas intertwining with each other are presented in the figure.CC BY · PubMed Central
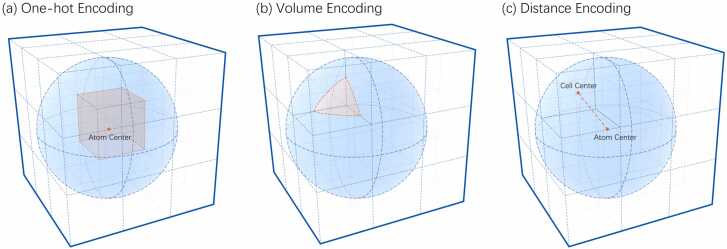
Fig. 3 Schematic diagram of the three encoding methods used for rendering atoms into space. The dotted grid represents part of the tensor, while the blue sphere represents the radius of the atom to be calculated. (a) One-hot Encoding: Marks the cell where the atom center is located. The red point in the center represents the atom center, and the cell location is marked in red. (b) Volume Encoding: Values of each cell equal to the volume of the intersection of the cell and the atom. The red part represents the intersection of the closest upper left corner cell and atom, and the volume of this part is marked as the value of the cell. (c) Distance Encoding: Values of each cell are equal to the distance from the atom center to the cell. The red dotted line represents the distance between the closest upper left corner cell and the atom center. This value is marked as the value of the cell.
Fig. 3 Schematic diagram of the three encoding methods used for rendering atoms into space. The dotted grid represents part of the tensor, while the blue sphere represents the radius of the atom to be calculated. (a) One-hot Encoding: Marks the cell where the atom center is located. The red point in the center represents the atom center, and the cell location is marked in red. (b) Volume Encoding: Values of each cell equal to the volume of the intersection of the cell and the atom. The red part represents the intersection of the closest upper left corner cell and atom, and the volume of this part is marked as the value of the cell. (c) Distance Encoding: Values of each cell are equal to the distance from the atom center to the cell. The red dotted line represents the distance between the closest upper left corner cell and the atom center. This value is marked as the value of the cell.CC BY · PubMed Central
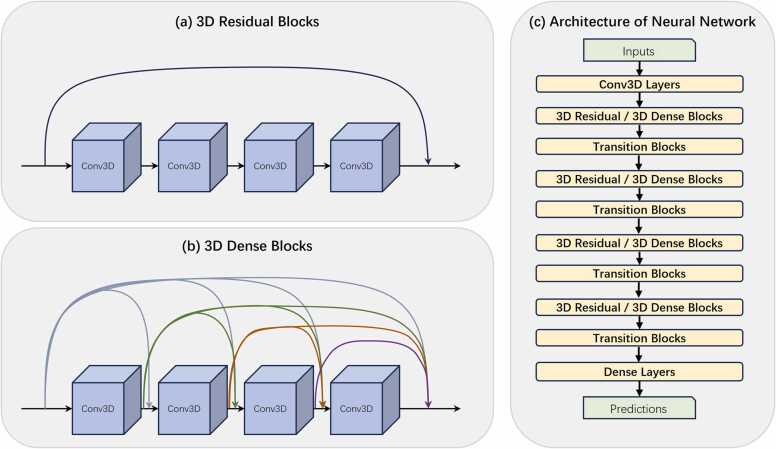
Fig. 4 Detailed description of the SpatialPPI network structure. (a) Structure of 3D Residual Blocks. In each residual block, the input data is directly accumulated into the output layer through a shortcut. (b) Structure of 3D Dense Blocks. For dense blocks, the input data and the output data of each layer of the convolutional network except the last layer are passed backward using a shortcut. (c) Architecture of the neural network. Multiple backbone blocks are gradually reduced in size after being connected using transition blocks, and finally, dense layers conclude and output the prediction.
Fig. 4 Detailed description of the SpatialPPI network structure. (a) Structure of 3D Residual Blocks. In each residual block, the input data is directly accumulated into the output layer through a shortcut. (b) Structure of 3D Dense Blocks. For dense blocks, the input data and the output data of each layer of the convolutional network except the last layer are passed backward using a shortcut. (c) Architecture of the neural network. Multiple backbone blocks are gradually reduced in size after being connected using transition blocks, and finally, dense layers conclude and output the prediction.CC BY · PubMed Central
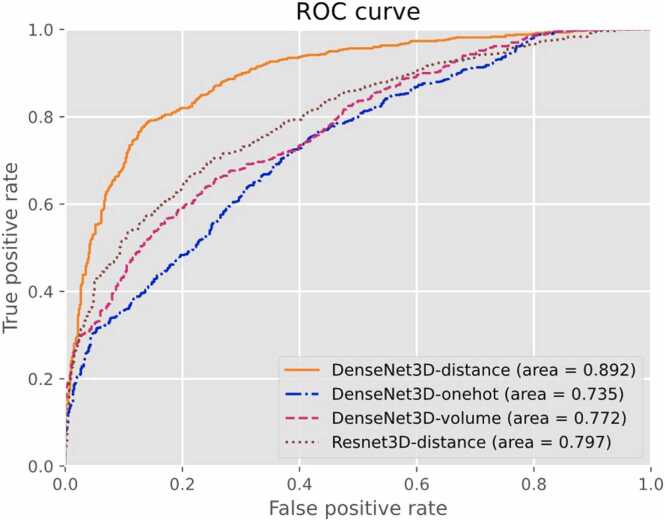
Fig. 5 Receiver operating characteristic (ROC) curve for different encoding methods and network backbones based on the 5-fold cross-validation result of the dataset.
Fig. 5 Receiver operating characteristic (ROC) curve for different encoding methods and network backbones based on the 5-fold cross-validation result of the dataset.CC BY · PubMed Central
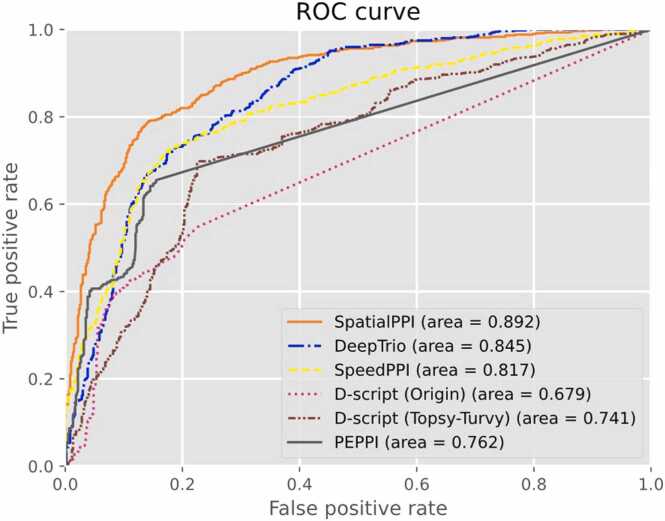
Fig. 6 Receiver operating characteristic (ROC) curve for SpatialPPI, DeepTrio, SpeedPPI, PEPPI, and D-script with 2 types of models.
Fig. 6 Receiver operating characteristic (ROC) curve for SpatialPPI, DeepTrio, SpeedPPI, PEPPI, and D-script with 2 types of models.CC BY · PubMed Central
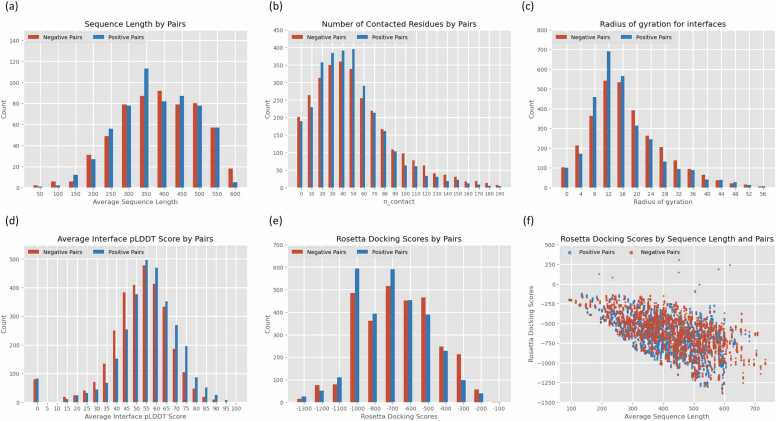
Fig. 7 Quality assessment of the AlphaFold Multimer predictions on the dataset. The threshold used to measure residue contacts was 8 Å. (a) Sequence length distribution of negative pairs (Red) and positive pairs (Blue). (b) The distribution of the number of contacted residues of negative pairs (Red) and positive pairs (Blue). (c) The distribution of radius of gyration for the interfaces between negative pairs (Red) and positive pairs (Blue). (d) The distribution of average interface pLDDT scores for negative pairs (Red) and positive pairs (Blue). (e) The distribution of Rosetta docking scores for negative pairs (Red) and positive pairs (Blue). (f) The scatter plot of Rosetta docking scores versus sequence length between negative pairs (Red) and positive pairs (Blue).
Fig. 7 Quality assessment of the AlphaFold Multimer predictions on the dataset. The threshold used to measure residue contacts was 8 Å. (a) Sequence length distribution of negative pairs (Red) and positive pairs (Blue). (b) The distribution of the number of contacted residues of negative pairs (Red) and positive pairs (Blue). (c) The distribution of radius of gyration for the interfaces between negative pairs (Red) and positive pairs (Blue). (d) The distribution of average interface pLDDT scores for negative pairs (Red) and positive pairs (Blue). (e) The distribution of Rosetta docking scores for negative pairs (Red) and positive pairs (Blue). (f) The scatter plot of Rosetta docking scores versus sequence length between negative pairs (Red) and positive pairs (Blue).CC BY · PubMed Central
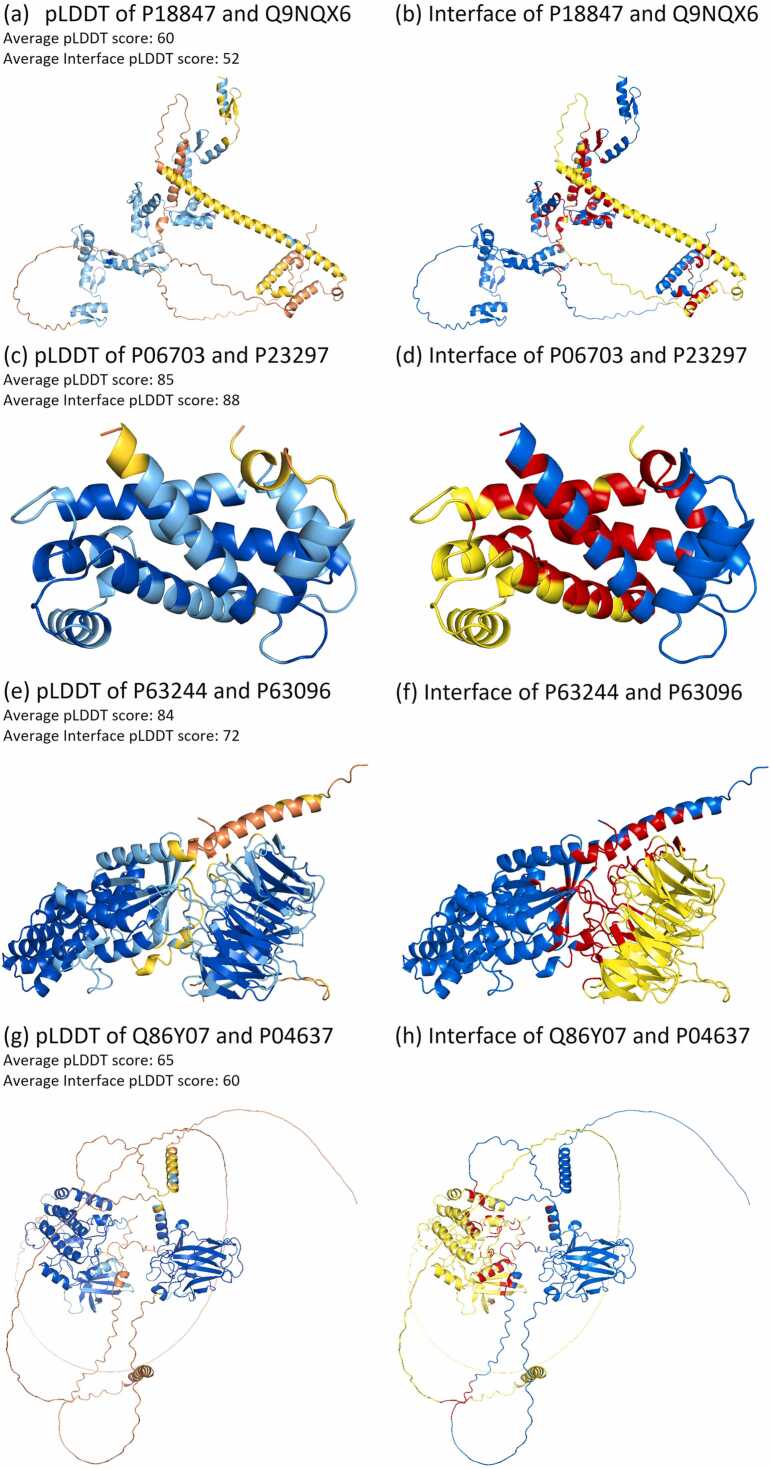
Fig. 8 Examples of structures predicted by the AlphaFold Multimer. (a)(c)(e)(g) pLDDT scores of predicted structures, where colors stand for the value of the pLDDT score. Blue: Very high (pLDDT > 90); Cyan-blue: High (90 > pLDDT > 70); Yellow: Low (70 > pLDDT > 50); and Orange: Very low (pLDDT < 50). The average plddt score of each protein complex and their average plddt score of the interface are labeled in the figure. (b)(d)(f)(h) Interface between two chains. The blue and yellow parts represent two chains respectively, and the red area represents interface residues whose distance to each other is less than 8 Å. Among the models, (a, b) P18847-Q9NQX6, (c, d) P06703-P23297, and (e, f) P63244-P63096 are experimentally determined pairs of proteins that cannot interact. (g, h) Experimentally determined interacting pair.
Fig. 8 Examples of structures predicted by the AlphaFold Multimer. (a)(c)(e)(g) pLDDT scores of predicted structures, where colors stand for the value of the pLDDT score. Blue: Very high (pLDDT > 90); Cyan-blue: High (90 > pLDDT > 70); Yellow: Low (70 > pLDDT > 50); and Orange: Very low (pLDDT < 50). The average plddt score of each protein complex and their average plddt score of the interface are labeled in the figure. (b)(d)(f)(h) Interface between two chains. The blue and yellow parts represent two chains respectively, and the red area represents interface residues whose distance to each other is less than 8 Å. Among the models, (a, b) P18847-Q9NQX6, (c, d) P06703-P23297, and (e, f) P63244-P63096 are experimentally determined pairs of proteins that cannot interact. (g, h) Experimentally determined interacting pair.CC BY · PubMed Central

Verification

Claims the paper makes

The claims and statistics of this paper haven’t been checked yet.

Run the check — free, no account needed. It reads the open-access text and checks the sources it cites.

A few free checks a day · papers already verified open instantly · results are public

Self-check

Percentages, sums and reported differences re-computed from the paper’s own numbers.

The self-check needs the paper’s full text.

Citations

Cites

Research works printed but not linked: 58

  1. 10.3390/molecules27010041 · DOI
  2. 10.1093/bib/bbab232 · DOI
  3. 10.1186/s12859-016-1452-4 · DOI
  4. 10.1109/iciibms.2017.8279749 · DOI
  5. 10.1093/nar/gku397 · DOI
  6. 10.1186/s12859-022-04590-5 · DOI
  7. 10.1186/1471-2105-15-1 · DOI
  8. 10.1093/nar/gkp309 · DOI
  9. 10.1093/bioinformatics/bty573 · DOI
  10. 10.7717/peerj.7126 · DOI
  11. 10.1093/bioinformatics/btz328 · DOI
  12. 10.3390/molecules23081923 · DOI
  13. 10.1016/j.str.2013.08.007 · DOI
  14. 10.1038/nsb1203-980 · DOI · Paper page
  15. 10.1093/nar/gkac1052 · DOI · Paper page
  16. 10.1016/j.csbj.2022.08.070 · DOI
  17. 10.1073/pnas.1200678109 · DOI · Paper page
  18. 10.1371/journal.pcbi.0030043 · DOI
  19. 10.1101/2021.10.04.463034 · DOI · Paper page
  20. 10.1038/s41467-022-28865-w · DOI · Paper page
  21. 10.1016/j.jmb.2022.167530 · DOI · Paper page
  22. Pedregosa, F. , Varoquaux, G. , Gramfort, A. , Michel, V. , Thirion, B. , Grisel, O. , Blondel, M. , Prettenhofer, P. , Weiss, R. , Dubourg, V. , Vanderplas, J. , Passos, A. , Cournapeau, D. , Brucher, M. , Perrot, M. , & Duchesnay, E . Scikit-Learn: Machine learning in Python. Journal of Machine Learning Research.
  23. 10.1021/acs.jcim.0c01306 · DOI
  24. 10.1007/978-3-030-32245-8_4 · DOI
  25. Tran, D. , Wang, H. , Torresani, L. , Ray, J. , LeCun, Y. , & Paluri, M . (2018, April 12). A closer look at spatiotemporal convolutions for action recognition. CVPR2018 · DOI
  26. 10.48550/arXiv.2004.04968 · DOI
  27. Huang, G. , Liu, Z. , van der Maaten, L. , & Weinberger, K. Q. (2018, January 28). Densely connected Convolutional Networks. CVPR2017 · DOI · Paper page
  28. He, K. , Zhang, X. , Ren, S. , & Sun, J . (2015, December 10). Deep residual learning for image recognition. CVPR2016 · DOI · Paper page
  29. 10.1016/j.cels.2021.08.010 · DOI
  30. 10.1093/bioinformatics/btab737 · DOI
  31. 10.1101/2023.04.15.536993 · DOI
  32. 10.1093/bioinformatics/btac258 · DOI
  33. 10.1021/ci300579r · DOI · Paper page
  34. 10.1006/jmbi.1990.9999 · DOI · Paper page
  35. 10.1016/s0166-218x(97)81456-4 · DOI
  36. 10.1093/nar/gkj109 · DOI · Paper page
  37. 10.1016/j.artmed.2017.03.001 · DOI · Paper page
  38. 10.1093/nar/gkt1079 · DOI
  39. 10.1038/s41586-019-1923-7 · DOI · Paper page
  40. 10.1093/bioinformatics/btm098 · DOI · Paper page
  41. 10.1093/nar/gkac1080 · DOI
  42. 10.1038/s41592-019-0437-4 · DOI · Paper page
  43. 10.1038/s41467-018-04964-5 · DOI · Paper page
  44. 10.1038/nmeth.1818 · DOI · Paper page
  45. 10.1038/s41598-020-70273-x · DOI
  46. 10.1093/bib/bbac165 · DOI
  47. 10.1093/nar/gkab1061 · DOI · Paper page
  48. 10.1093/nar/gks1226 · DOI · Paper page
  49. 10.1038/s41586-021-03828-1 · DOI · Paper page
  50. 10.1007/978-1-4939-3572-7_24 · DOI
  51. 10.1063/1.1725697 · DOI
  52. 10.1021/acs.chemrev.1c00757 · DOI
  53. Graham, B. , & van der Maaten, L. (2017, June 5). Submanifold sparse convolutional networks. CVPR 2018
  54. He, T. , Zhang, Z. , Zhang, H. , Zhang, Z. , Xie, J. , & Li, M. (2018, December 5). Bag of tricks for image classification with Convolutional Neural Networks. CVPR2019 · DOI · Paper page
  55. Huang, G. , Liu, S. , van der Maaten, L. , & Weinberger, K. Q. (2018, June 7). CondenseNet: An efficient DenseNet using learned group convolutions. CVPR 2018 · DOI · Paper page
  56. 10.1093/bib/bbac524 · DOI
  57. 10.1007/978-1-4939-9873-9_6 · DOI
  58. 10.1007/BF02193624 · DOI

Metadata

Authors
Hu, W., & Ohue, M.
Affiliations
Tokyo Institute of Technology (JP)
Corresponding author
Ohue, Masahito
Venue
Computational and Structural Biotechnology Journal
Publisher
openRxiv
Published
2023-12-15
Volume
23
Pages
1214-1225
ISSN
2001-0370 (ISSN-L)
OpenAlex
W4392858197
Cited by
29
References
1
Citations by year
2026: 5 · 2025: 18 · 2024: 6
FWCI
3.95
Type
journal article
Language
en
Open access
Licence
cc-by
Locations
  • Computational and Structural Biotechnology Journal (publishedVersion, cc-by)
  • bioRxiv (Cold Spring Harbor Laboratory) (acceptedVersion)
  • PubMed Central (publishedVersion, cc-by)
  • PubMed (publishedVersion)
  • DOAJ (DOAJ: Directory of Open Access Journals) (submittedVersion, cc-by-sa)
Funders
  • Japan Agency for Medical Research and Development (JP23ama121026)
  • Japan Society for the Promotion of Science (JPMJAX20A3, 23K28186)
  • Japan Science and Technology Agency (JPMJFR216J)
  • ACT-X
Topics
  • Life Sciences › Biochemistry, Genetics and Molecular Biology › Molecular Biology › Protein Structure and Dynamics
  • Life Sciences › Biochemistry, Genetics and Molecular Biology › Molecular Biology › Machine Learning in Bioinformatics
  • Life Sciences › Biochemistry, Genetics and Molecular Biology › Molecular Biology › Bioinformatics and Genomic Networks
Keywords
protein-protein interaction prediction, AlphaFold-Multimer, protein complex structure, 3D convolutional neural networks

About these checks

Registry, retraction, Cites and statistics results are computed, not judged, with one exception: a printed reference that no index lists is read once by a model before it counts as a citation error. Claims are extracted by a model and kept only when their quote appears verbatim in the text; each cited source is then checked, with a model’s help, for whether it says what the claim relies on. Those verdicts can be wrong — read the claim’s quote and the cited source before relying on one.

Statistics and arithmetic are recomputed, not judged.

Confidence bands are shown only for fields calibrated on our annotated test set. None is calibrated yet, so no band is shown.

What counts as a claim ›How we measure confidence ›How we check this ›

Are you an author, or do you see a problem with this page? Request a review