PreprintCited by 6Microbial bioremediation and biosurfactantsEnzyme-mediated dye degradationEnzyme Production and Characterization

The DOI matches its Crossref record; 1 of the 1 references it cites were found in a registry or an index.

Discovery of the 1-naphthylamine biodegradation pathway reveals an enzyme that catalyzes 1-naphthylamine glutamylation

Open access

Preprint — published as 10.7554/elife.95555

Abstract

1-Naphthylamine (1NA), which is harmful to human and aquatic animals, has been used widely in the manufacturing of dyes, pesticides, and rubber antioxidants. Nevertheless, little is known about its environmental behavior and no bacteria have been reported to use it as the growth substrate. Herein, we describe a pathway for 1NA degradation in isolate Pseudomonas sp. strain JS3066, determine the structure and mechanism of the enzyme NpaA1 that catalyzes the initial reaction, and reveal how the pathway evolved. From genetic and enzymatic analysis, a cluster of 5 genes encoding a dioxygenase system was determined to be responsible for the initial steps in 1NA degradation through glutamylation of 1NA. The γ-glutamylated 1NA was subsequently oxidized to 1,2-dihydroxynaphthalene which was further degraded by the well-established pathway of naphthalene degradation via catechol. Enzymatic analysis showed that NpaA1 catalyzed conversion of various anilines and naphthylamine derivatives. Structural and biochemical studies of NpaA1 revealed that the broad substrate specificity of NpaA1 is due to a large hydrophobic pocket, which is different from type I glutamine synthetase (GSI). The findings enhance understanding of degrading polycyclic aromatic amines, and will also enable the application of bioremediation at naphthylamine contaminated sites.

Overview

The claims and statistics of this paper haven’t been checked yet.

Run the check — free, no account needed. It reads the open-access text and checks the sources it cites.

A few free checks a day · papers already verified open instantly · results are public

Integrity signals

Registry

Crossref · 10.1101/2024.01.21.576549

Cites

1 of 1 references verified0 citation errors · 0 not checkable

Statistics

Figures

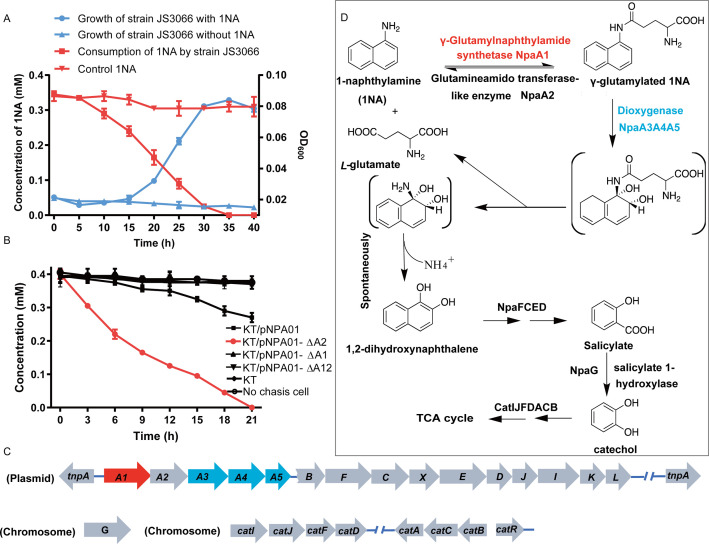
Figure 1. Degradation of 1-Naphthylamine (1NA) by Pseudomonas sp. strain JS3066. (A) Growth with 1NA as the sole carbon and nitrogen source. (B) 1NA conversion by cell suspensions of P. putida KT2440-ΔcatAΔggt harboring pNPA01 (npaA1 to npaA5), pNPA01-ΔA1 (npaA2 to npaA5), pNPA01-ΔA2 (npaA1 and npaA3 to npaA5), and pNPA01-ΔA12 (npaA3 to npaA5). The ability of P. putida KT2440-ΔcatAΔggt to convert 1NA together with the spontaneous decomposition of 1NA were also determined as control. The error bars represent the standard deviation while the points represent the mean of two independent measurements. (C) Organization of the genes involved in 1NA degradation by strain JS3066. Gene tnpA encodes a transposase. Proposed functions of the rest of genes are presented in Supplementary file 1. (D) Proposed pathway of 1NA catabolism in Pseudomonas sp. strain JS3066. TCA, tricarboxylic acid. Unstable compounds are enclosed in brackets.
Figure 1. Degradation of 1-Naphthylamine (1NA) by Pseudomonas sp. strain JS3066. (A) Growth with 1NA as the sole carbon and nitrogen source. (B) 1NA conversion by cell suspensions of P. putida KT2440-ΔcatAΔggt harboring pNPA01 (npaA1 to npaA5), pNPA01-ΔA1 (npaA2 to npaA5), pNPA01-ΔA2 (npaA1 and npaA3 to npaA5), and pNPA01-ΔA12 (npaA3 to npaA5). The ability of P. putida KT2440-ΔcatAΔggt to convert 1NA together with the spontaneous decomposition of 1NA were also determined as control. The error bars represent the standard deviation while the points represent the mean of two independent measurements. (C) Organization of the genes involved in 1NA degradation by strain JS3066. Gene tnpA encodes a transposase. Proposed functions of the rest of genes are presented in Supplementary file 1. (D) Proposed pathway of 1NA catabolism in Pseudomonas sp. strain JS3066. TCA, tricarboxylic acid. Unstable compounds are enclosed in brackets.CC BY · PubMed Central
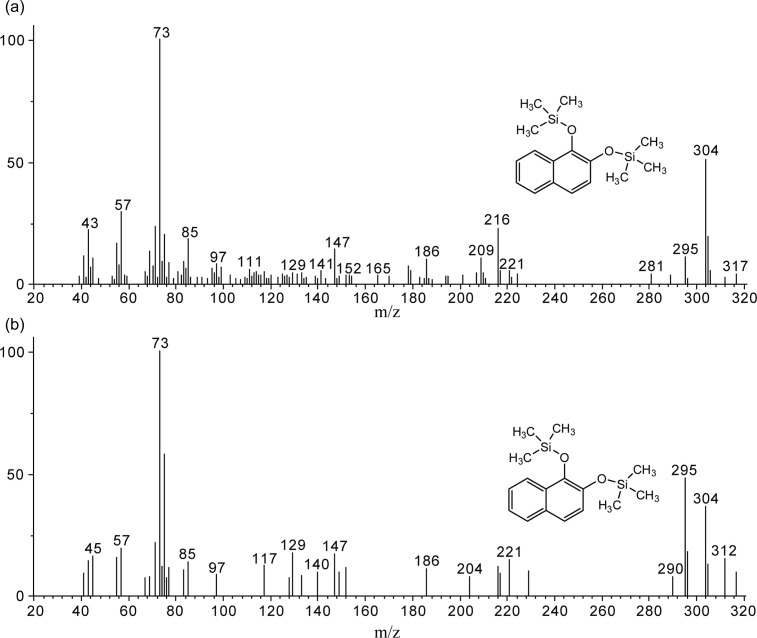
Figure 1—figure supplement 1. Gas chromatography-mass spectrometry (GC-MS) analysis of the intermediate accumulated during 1-Naphthylamine (1NA) transformation by the cell suspension of P. putida KT2440-ΔcatAΔggt harboring pNPA01. The mass spectra of theoretical trimethylsilylated 1,2-dihydroxynaphthalene (a) and authentic trimethylsilylated 1,2-dihydroxynaphthalene (b) are shown.
Figure 1—figure supplement 1. Gas chromatography-mass spectrometry (GC-MS) analysis of the intermediate accumulated during 1-Naphthylamine (1NA) transformation by the cell suspension of P. putida KT2440-ΔcatAΔggt harboring pNPA01. The mass spectra of theoretical trimethylsilylated 1,2-dihydroxynaphthalene (a) and authentic trimethylsilylated 1,2-dihydroxynaphthalene (b) are shown.CC BY · PubMed Central
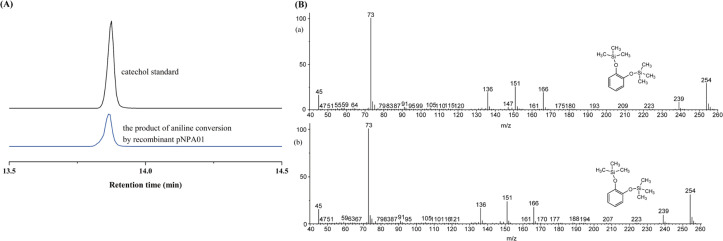
Figure 1—figure supplement 2. Conversion of aniline by strain P. putida KT2440-ΔcatAΔggt harboring plasmid pNPA01 (recombinant KT/pNPA01). (A) The ion current chromatograms at m/z 254.00±0.70 extracted from the total ion current chromatograms of standard catechol and the product of aniline conversion by recombinant KT/pNPA01. (B) Gas chromatography-mass spectrometry (GC-MS) analysis of the intermediate captured during aniline degradation by the cell suspension of KT/pNPA01. The mass spectra of proposed trimethylsilylated catechol (A) and authentic trimethylsilylated catechol (B) are shown.
Figure 1—figure supplement 2. Conversion of aniline by strain P. putida KT2440-ΔcatAΔggt harboring plasmid pNPA01 (recombinant KT/pNPA01). (A) The ion current chromatograms at m/z 254.00±0.70 extracted from the total ion current chromatograms of standard catechol and the product of aniline conversion by recombinant KT/pNPA01. (B) Gas chromatography-mass spectrometry (GC-MS) analysis of the intermediate captured during aniline degradation by the cell suspension of KT/pNPA01. The mass spectra of proposed trimethylsilylated catechol (A) and authentic trimethylsilylated catechol (B) are shown.CC BY · PubMed Central
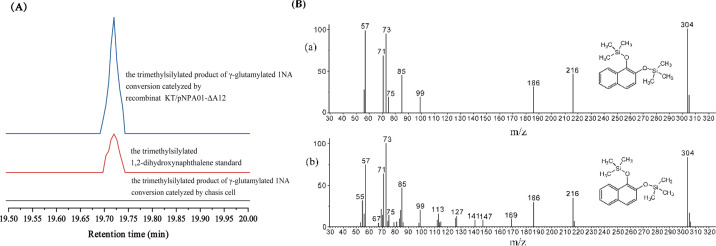
Figure 1—figure supplement 3. Conversion of γ-glutamylated 1-naphthylamine by recombinant strain KT/pNPA01-ΔA12. (A) The ion current chromatograms at m/z 304.00±0.70 extracted from the total ion current chromatograms of standard 1,2-dihydroxynaphthalene and the product of γ-glutamylated 1NA conversion by recombinant KT/pNPA01-ΔA12 are presented. (B) Gas chromatography-mass spectrometry (GC-MS) analysis of the intermediate captured during γ-glutamylated 1NA transformation by the cell suspension of KT/pNPA01-ΔA12. The mass spectra of theoretical 1,2-dihydroxynaphthalene (a) and authentic 1,2-dihydroxynaphthalene (b) are shown.
Figure 1—figure supplement 3. Conversion of γ-glutamylated 1-naphthylamine by recombinant strain KT/pNPA01-ΔA12. (A) The ion current chromatograms at m/z 304.00±0.70 extracted from the total ion current chromatograms of standard 1,2-dihydroxynaphthalene and the product of γ-glutamylated 1NA conversion by recombinant KT/pNPA01-ΔA12 are presented. (B) Gas chromatography-mass spectrometry (GC-MS) analysis of the intermediate captured during γ-glutamylated 1NA transformation by the cell suspension of KT/pNPA01-ΔA12. The mass spectra of theoretical 1,2-dihydroxynaphthalene (a) and authentic 1,2-dihydroxynaphthalene (b) are shown.CC BY · PubMed Central
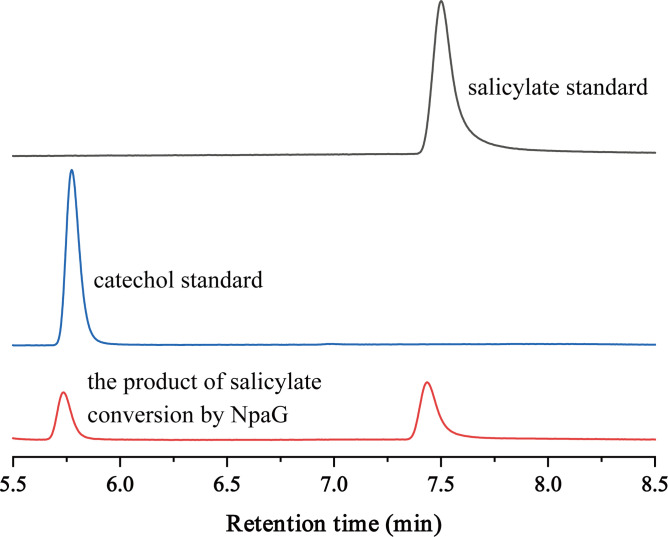
Figure 1—figure supplement 4. High-performance liquid chromatography (HPLC) chromatographs of salicylate standard, catechol standard, and the reaction product of salicylate conversion catalyzed by the recombinant protein NpaG.
Figure 1—figure supplement 4. High-performance liquid chromatography (HPLC) chromatographs of salicylate standard, catechol standard, and the reaction product of salicylate conversion catalyzed by the recombinant protein NpaG.CC BY · PubMed Central
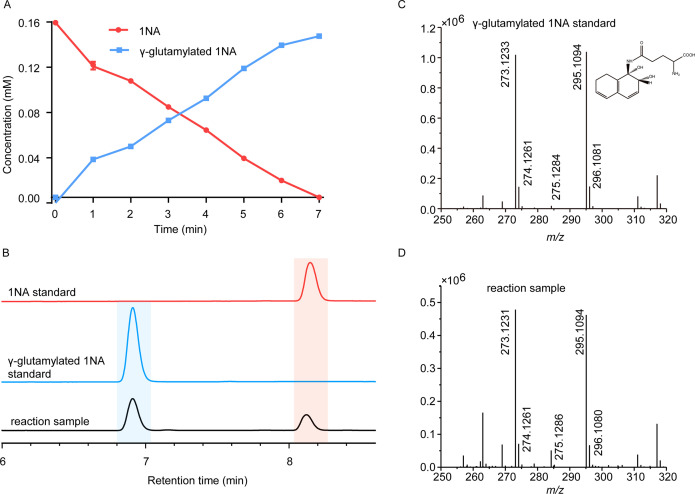
Figure 2. Conversion of 1-Naphthylamine (1NA) by recombinant protein NpaA1. (A) The time course of 1NA degradation and γ-glutamylated 1NA accumulation. The error bars represent the standard deviation while the points represent the mean of two independent measurements. (B) High-performance liquid chromatography (HPLC) profiles of 1NA standard, γ-glutamylated 1NA standard, and the reaction products of 1NA conversion catalyzed by NpaA1. The detection wavelength was 280 nm. (C–D) UPLC/QTOF-MS analysis of the intermediate captured during 1NA transformation by NpaA1. The mass spectra of authentic γ-glutamylated 1NA (C) and reaction product γ-glutamylated 1NA (D).
Figure 2. Conversion of 1-Naphthylamine (1NA) by recombinant protein NpaA1. (A) The time course of 1NA degradation and γ-glutamylated 1NA accumulation. The error bars represent the standard deviation while the points represent the mean of two independent measurements. (B) High-performance liquid chromatography (HPLC) profiles of 1NA standard, γ-glutamylated 1NA standard, and the reaction products of 1NA conversion catalyzed by NpaA1. The detection wavelength was 280 nm. (C–D) UPLC/QTOF-MS analysis of the intermediate captured during 1NA transformation by NpaA1. The mass spectra of authentic γ-glutamylated 1NA (C) and reaction product γ-glutamylated 1NA (D).CC BY · PubMed Central
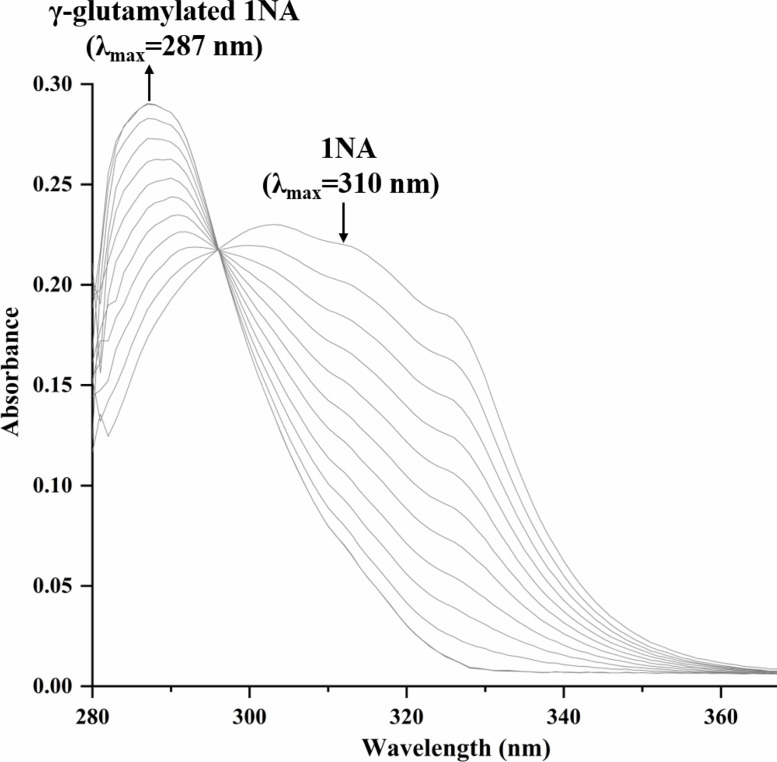
Figure 2—figure supplement 1. Spectral changes during the transformation of 1-Naphthylamine (1NA) by purified N-terminal Strep II-tagged NpaA1. The maximum characteristic absorption peaks of 1NA and γ-glutamylated 1NA are 310 nm and 287 nm. The arrows indicate the directions of spectral changes.
Figure 2—figure supplement 1. Spectral changes during the transformation of 1-Naphthylamine (1NA) by purified N-terminal Strep II-tagged NpaA1. The maximum characteristic absorption peaks of 1NA and γ-glutamylated 1NA are 310 nm and 287 nm. The arrows indicate the directions of spectral changes.CC BY · PubMed Central
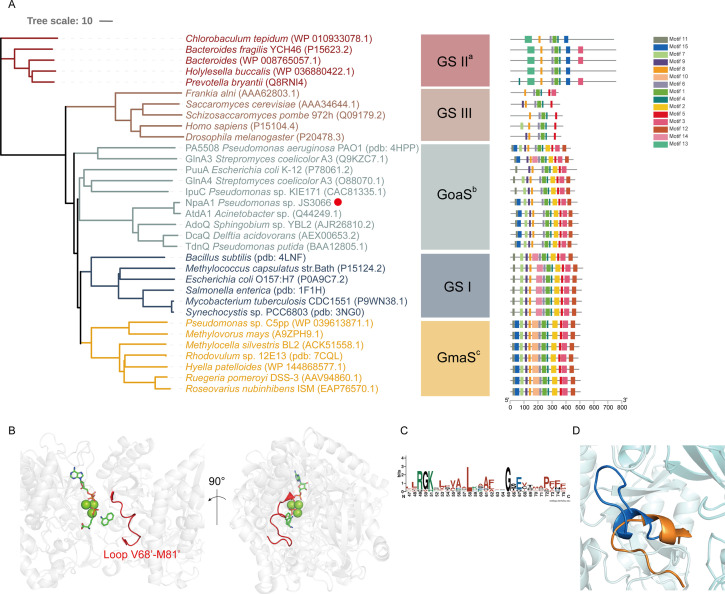
Figure 3. Phylogenetic analysis and motif analysis of GS-like enzymes. (A) Phylogenetic tree illustrating the evolutionary relationship between amino acid sequences of NpaA1 from Pseudomonas sp. strain JS3066 labeled with a red dot and other related sequences. (B) The loop V68’-M81’ (represented as a red cartoon) in NpaA1─ADP─MetSox-P docking with 1NA complex. Ligands of this complex are colored in green. (C) Sequence logo of the 15th motif. (D) The overlapping structure of loop V68’-M81’ of NpaA1 (in blue) and the corresponding region in StGS (in orange). GS: glutamine synthetase; GoaS: organic amine glutamine synthetases. GmaS: γ-Glutamylmethylamide synthetase.
Figure 3. Phylogenetic analysis and motif analysis of GS-like enzymes. (A) Phylogenetic tree illustrating the evolutionary relationship between amino acid sequences of NpaA1 from Pseudomonas sp. strain JS3066 labeled with a red dot and other related sequences. (B) The loop V68’-M81’ (represented as a red cartoon) in NpaA1─ADP─MetSox-P docking with 1NA complex. Ligands of this complex are colored in green. (C) Sequence logo of the 15th motif. (D) The overlapping structure of loop V68’-M81’ of NpaA1 (in blue) and the corresponding region in StGS (in orange). GS: glutamine synthetase; GoaS: organic amine glutamine synthetases. GmaS: γ-Glutamylmethylamide synthetase.CC BY · PubMed Central
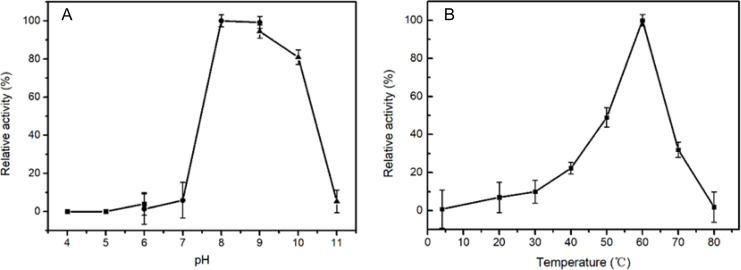
Figure 3—figure supplement 1. The optimal pH (A) and temperature (B) of wild-type NpaA1 activity. The optimal pH was determined at 25 °C using Bis -Tris buffer for pH 4–6, Tris buffer for pH 6–9, and glycine-NaOH buffer for 9–11. The activity of NpaA1 was measured in a range from 5–80°C at pH 8.0 (50 mM Tris-HCl buffer). Error bars represent the standard deviation of three biological replicates.
Figure 3—figure supplement 1. The optimal pH (A) and temperature (B) of wild-type NpaA1 activity. The optimal pH was determined at 25 °C using Bis -Tris buffer for pH 4–6, Tris buffer for pH 6–9, and glycine-NaOH buffer for 9–11. The activity of NpaA1 was measured in a range from 5–80°C at pH 8.0 (50 mM Tris-HCl buffer). Error bars represent the standard deviation of three biological replicates.CC BY · PubMed Central
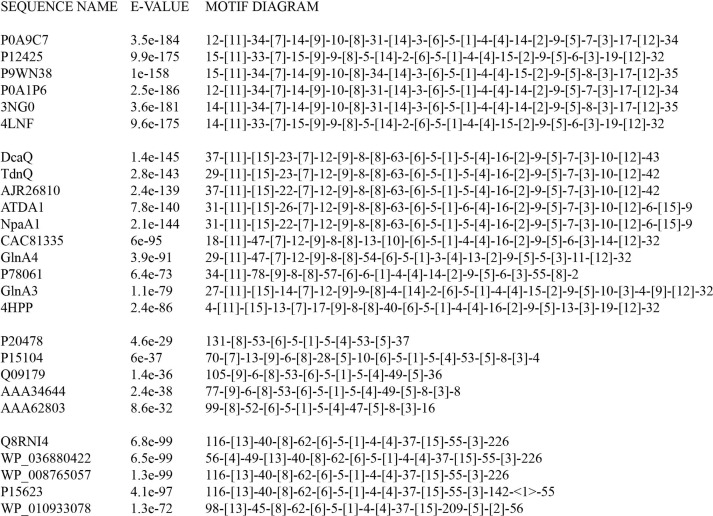
Figure 3—figure supplement 2. Motif order and spacing for glutamine synthetase (GS)-like proteins.
Figure 3—figure supplement 2. Motif order and spacing for glutamine synthetase (GS)-like proteins.CC BY · PubMed Central
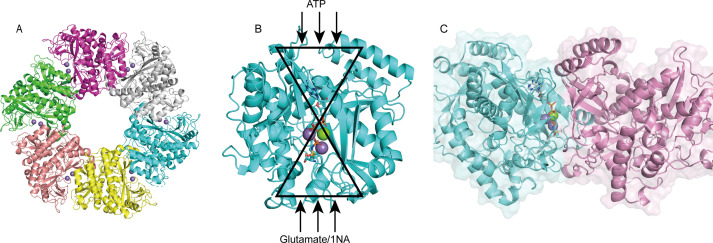
Figure 4. Structure analysis of NpaA1. (A) The overall structure of NpaA1. There are six monomers arranged as a hexamer in an asymmetric unit. The six monomers are in different colors. (B) The glutamine synthetase (GS) active site is illustrated as a bifunnel with the ATP, glutamate, and amine entry and binding sites at opposite ends. (C) Active site of NpaA1 located at the interface of adjacent subunits. The purple spheres represent the Mn2+ ions, and the green spheres represent the Mg2+ ions. Ligands are indicated by green sticks.
Figure 4. Structure analysis of NpaA1. (A) The overall structure of NpaA1. There are six monomers arranged as a hexamer in an asymmetric unit. The six monomers are in different colors. (B) The glutamine synthetase (GS) active site is illustrated as a bifunnel with the ATP, glutamate, and amine entry and binding sites at opposite ends. (C) Active site of NpaA1 located at the interface of adjacent subunits. The purple spheres represent the Mn2+ ions, and the green spheres represent the Mg2+ ions. Ligands are indicated by green sticks.CC BY · PubMed Central
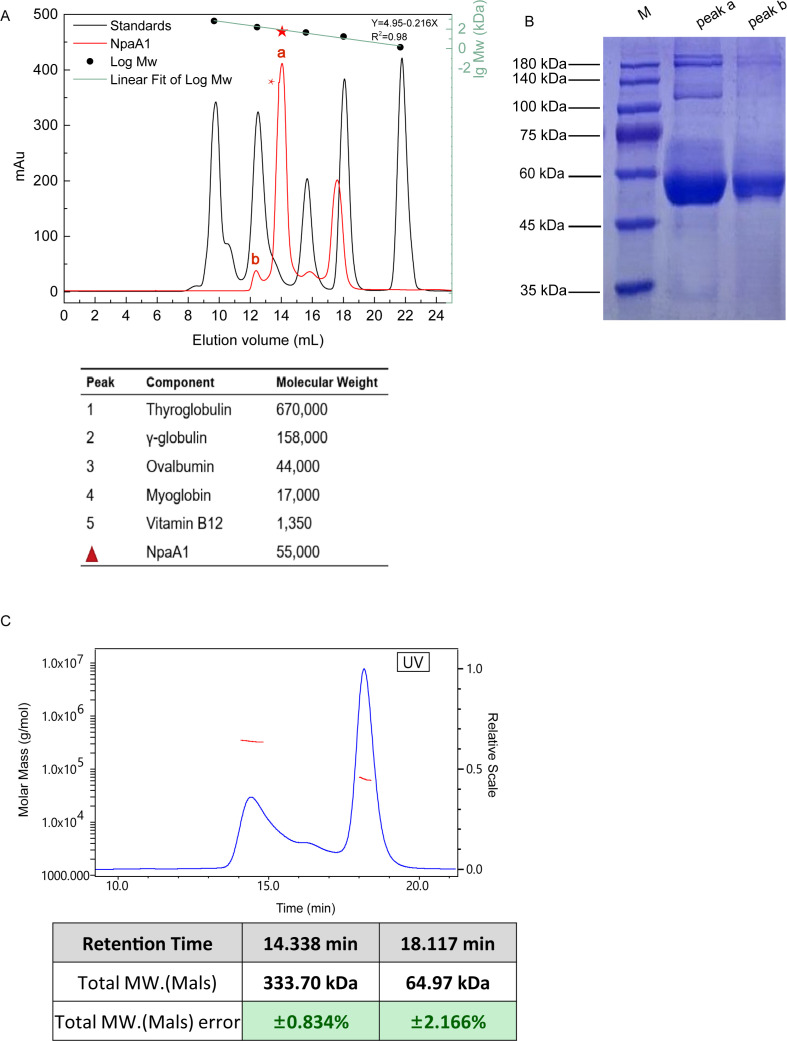
Figure 4—figure supplement 1. Aggregate state analysis of NpaA1. (A) Gel filtration of NpaA1. (B) SDS-PAGE showed that peak a and peak b were both NpaA1. (C) Multi-angle light scattering (MALS) analysis of NpaA1. The molecular weight and error of each peak are counted in the table.
Figure 4—figure supplement 1. Aggregate state analysis of NpaA1. (A) Gel filtration of NpaA1. (B) SDS-PAGE showed that peak a and peak b were both NpaA1. (C) Multi-angle light scattering (MALS) analysis of NpaA1. The molecular weight and error of each peak are counted in the table.CC BY · PubMed Central
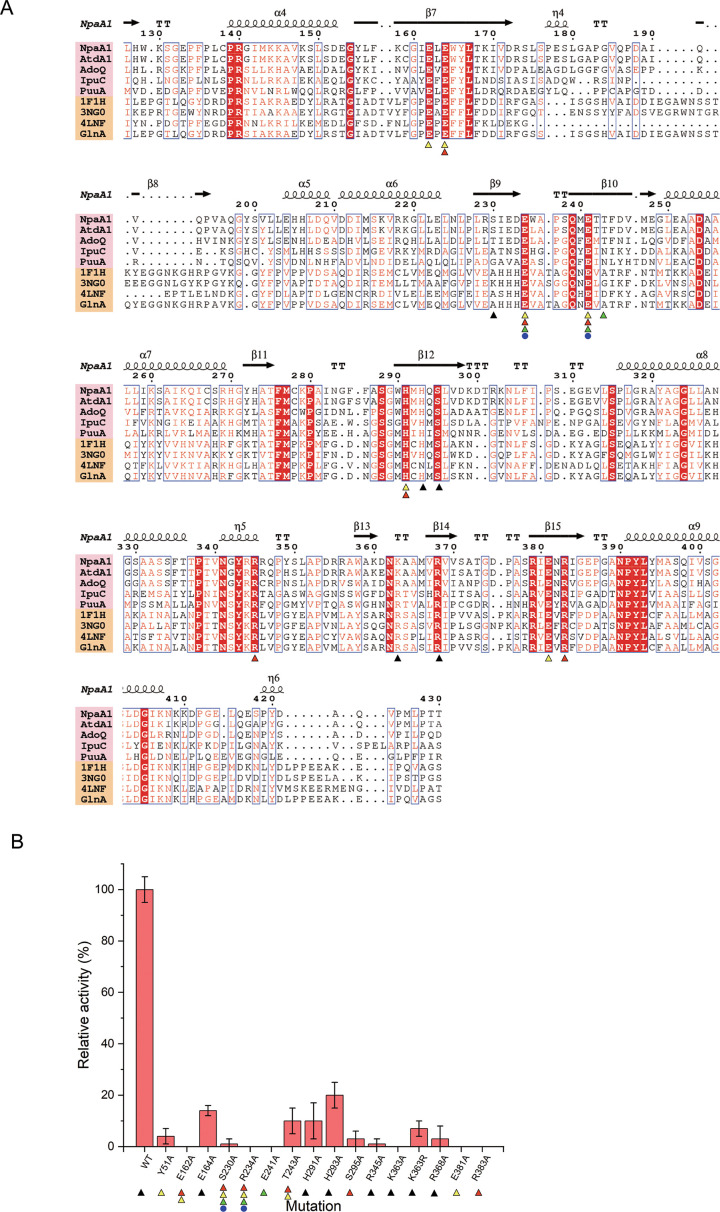
Figure 4—figure supplement 2. Conserved residues and mutant analysis of ligand binding sites. (A) Sequence alignment of glutamine synthetase (GS)-like proteins (pink background) with GS proteins (yellow background). Residues involved in binding ATP, glutamate, Mg2+, and ammonium are marked with black triangles, red triangles, yellow triangles, and green triangles, respectively. (B) Mutational analysis of important residues participating in binding substrate and catalysis. Error bars represent the standard deviation of three biological replicates.
Figure 4—figure supplement 2. Conserved residues and mutant analysis of ligand binding sites. (A) Sequence alignment of glutamine synthetase (GS)-like proteins (pink background) with GS proteins (yellow background). Residues involved in binding ATP, glutamate, Mg2+, and ammonium are marked with black triangles, red triangles, yellow triangles, and green triangles, respectively. (B) Mutational analysis of important residues participating in binding substrate and catalysis. Error bars represent the standard deviation of three biological replicates.CC BY · PubMed Central
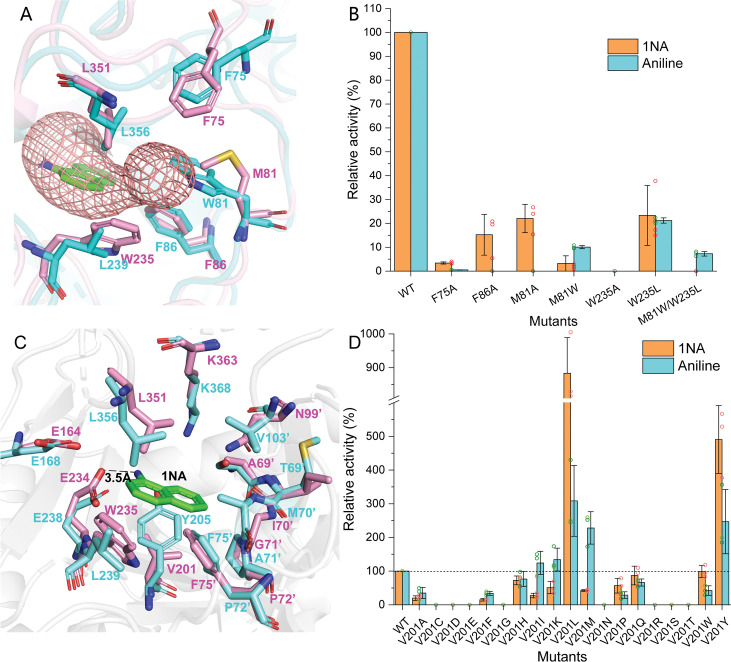
Figure 5. Residues involved in 1-Naphthylamine (1NA) binding. (A) The 1NA entry tunnel was predicted by Caver 3.0 (in red). The structures of NpaA1 (in pink) and AtdA1 (in cyan) overlap, with the amino acids contributing to the formation of tunnel bottlenecks highlighted as sticks. (B) Relative activity of mutants for 1NA entry tunnel. The activity of wild-type NpaA1 for 1NA is set to 100% (21.6±1.2 U/g), and wild-type NpaA1 showed equivalent activity to 1NA and aniline. Error bars represent the standard deviation of three biological replicates. (C) The aromatic amine binding pocket of NpaA1 is superimposed on AtdA1. 1NA is green, residues for NpaA1 are pink, and residues for AtdA1 are cyan. The black dashed line represents the hydrogen bond. (D) Relative activity of saturation mutants for V201. The activity of wild-type NpaA1 for 1NA is set to 100% (20.8±0.5 U/g), and wild-type NpaA1 showed equivalent activity to 1NA and aniline. Dots represent the relative activity of the respective biological replicates (n = 3) and error bars represent the standard deviation.
Figure 5. Residues involved in 1-Naphthylamine (1NA) binding. (A) The 1NA entry tunnel was predicted by Caver 3.0 (in red). The structures of NpaA1 (in pink) and AtdA1 (in cyan) overlap, with the amino acids contributing to the formation of tunnel bottlenecks highlighted as sticks. (B) Relative activity of mutants for 1NA entry tunnel. The activity of wild-type NpaA1 for 1NA is set to 100% (21.6±1.2 U/g), and wild-type NpaA1 showed equivalent activity to 1NA and aniline. Error bars represent the standard deviation of three biological replicates. (C) The aromatic amine binding pocket of NpaA1 is superimposed on AtdA1. 1NA is green, residues for NpaA1 are pink, and residues for AtdA1 are cyan. The black dashed line represents the hydrogen bond. (D) Relative activity of saturation mutants for V201. The activity of wild-type NpaA1 for 1NA is set to 100% (20.8±0.5 U/g), and wild-type NpaA1 showed equivalent activity to 1NA and aniline. Dots represent the relative activity of the respective biological replicates (n = 3) and error bars represent the standard deviation.CC BY · PubMed Central
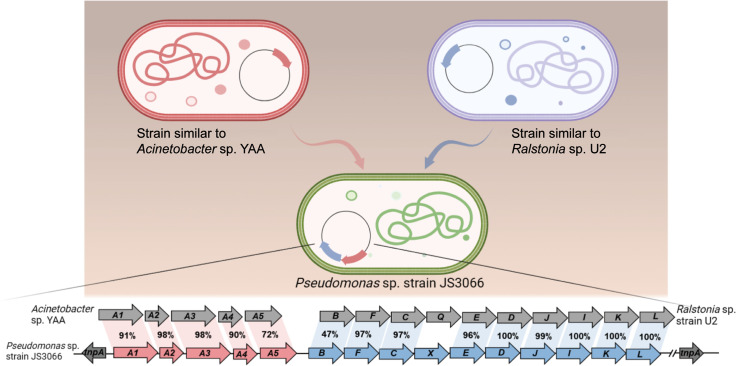
Figure 6. Likely sequence of horizontal gene transfer (HGT) for recruitment of genes involved in 1-Naphthylamine (1NA) degradation pathway in strain JS3066.
Figure 6. Likely sequence of horizontal gene transfer (HGT) for recruitment of genes involved in 1-Naphthylamine (1NA) degradation pathway in strain JS3066.CC BY · PubMed Central

Verification

Claims the paper makes

The claims and statistics of this paper haven’t been checked yet.

Run the check — free, no account needed. It reads the open-access text and checks the sources it cites.

A few free checks a day · papers already verified open instantly · results are public

Self-check

Percentages, sums and reported differences re-computed from the paper’s own numbers.

The self-check needs the paper’s full text.

Citations

Cites

Research works printed but not linked: 54

  1. 10.1016/j.chroma.2006.06.075 · DOI
  2. 10.1038/323304a0 · DOI
  3. 10.1111/j.1742-4658.2007.05638.x · DOI
  4. 10.1007/s00253-008-1710-0 · DOI
  5. 10.3389/fmicb.2015.00820 · DOI
  6. 10.1007/BF00175876 · DOI
  7. 10.1128/aem.53.1.208-210.1987 · DOI
  8. 10.1371/journal.pcbi.1002708 · DOI
  9. 2000, Mutagenicity and carcinogenicity of aromatic amines metabolically produced from Azo Dyes. Journal of Environmental Science and Health, Part C, 18, 51
  10. 10.1128/AEM.68.5.2368-2375.2002 · DOI
  11. 10.1111/evo.14434 · DOI
  12. 10.1128/JB.180.7.1951-1954.1998 · DOI
  13. 10.1016/j.jmb.2004.06.034 · DOI
  14. 10.5772/18279 · DOI
  15. 10.1107/S0907444910007493 · DOI · Paper page
  16. 10.2741/e429 · DOI
  17. 10.1128/JB.180.9.2522-2530.1998 · DOI
  18. 10.1128/jb.179.2.399-408.1997 · DOI
  19. 10.1101/gr.130000 · DOI
  20. 10.1021/bi002438h · DOI
  21. 10.1186/1471-2180-10-138 · DOI
  22. 10.1128/aem.63.6.2330-2337.1997 · DOI
  23. 10.1128/JB.183.23.6936-6942.2001 · DOI
  24. IARC, 1974, Monographs on the Evaluation of the Carcinogenic Risk of Chemicals to Humans, 88, V4
  25. 10.1128/AEM.72.2.1086-1095.2006 · DOI
  26. 10.1007/s00253-019-09871-3 · DOI
  27. 10.1038/s41598-018-30191-5 · DOI
  28. 10.1128/AEM.01519-07 · DOI
  29. 10.1111/febs.14418 · DOI
  30. 10.1128/AEM.07480-11 · DOI
  31. 10.1128/mBio.01945-19 · DOI
  32. 10.3389/fmicb.2017.00726 · DOI
  33. 10.1074/jbc.M411114200 · DOI
  34. 10.1074/jbc.M800133200 · DOI
  35. 10.1021/bi3014856 · DOI
  36. 2008, Microbial biodegradation and toxicity of vinclozolin and its toxic metabolite 3,5-dichloroaniline, J Microbiol Biotechnol, 18, 343
  37. 10.1099/mic.0.28137-0 · DOI
  38. 10.1107/s2059798319011471 · DOI · Paper page
  39. 10.1128/AEM.64.10.4089-4092.1998 · DOI
  40. 10.1074/jbc.M113.519496 · DOI
  41. 10.1016/S0045-6535(00)00109-0 · DOI
  42. 10.1128/JB.01188-10 · DOI
  43. 10.1007/s00203-006-0159-8 · DOI
  44. 10.1128/JB.00185-06 · DOI
  45. 10.1128/AEM.02789-10 · DOI
  46. 10.1146/annurev.ge.28.120194.001321 · DOI
  47. 10.1128/JB.00397-13 · DOI
  48. 10.1093/molbev/msab120 · DOI
  49. 10.1006/plas.1996.0037 · DOI
  50. 10.1038/s41467-022-31573-0 · DOI
  51. 10.1128/mr.56.4.677-694.1992 · DOI
  52. 10.1074/jbc.RA120.015952 · DOI
  53. 10.1128/JB.183.2.700-708.2001 · DOI
  54. 10.1111/mmi.14771 · DOI

Metadata

Authors
Zhang, S.-T., Deng, S.-K., Li, T., Maloney, M. E., Li, D.-F., Spain, J. C., & Zhou, N.-Y.
Affiliations
  • Shanghai Jiao Tong University (CN)
  • University of West Florida (US)
  • Chinese Academy of Sciences (CN)
Corresponding author
  • Spain, Jim C.
  • Zhou, Ning-Yi
Venue
eLife
Publisher
openRxiv
Published
2024-01-22
Volume
13
ISSN
2050-084X (ISSN-L)
OpenAlex
W4401728232
Cited by
6
References
1
Citations by year
2026: 1 · 2025: 4 · 2024: 1
FWCI
0.60
Type
journal article
Language
en
Open access
Licence
cc-by
Locations
  • eLife (publishedVersion, cc-by)
  • bioRxiv (Cold Spring Harbor Laboratory) (acceptedVersion, cc-by)
  • PubMed Central (publishedVersion, cc-by)
  • PubMed (publishedVersion)
  • DOAJ (DOAJ: Directory of Open Access Journals) (submittedVersion, cc-by-sa)
Funders
  • National Key Research and Development Program of China (2021YFA0909500)
  • Chemours
Topics
  • Physical Sciences › Environmental Science › Pollution › Microbial bioremediation and biosurfactants
  • Life Sciences › Immunology and Microbiology › Applied Microbiology and Biotechnology › Enzyme-mediated dye degradation
  • Life Sciences › Biochemistry, Genetics and Molecular Biology › Biotechnology › Enzyme Production and Characterization
Keywords
1-naphthylamine, biodegradation pathways, glutamylation, Pseudomonas, 1,2-dihydroxynaphthalene, catechol pathway, polycyclic aromatic amines, substrate specificity, enzyme structure, bioremediation
MeSH terms
Bacterial Proteins, Biodegradation, Environmental, Multigene Family, Pseudomonas, Substrate Specificity, 1-Naphthylamine, Dioxygenases, Metabolic Networks and Pathways

About these checks

Registry, retraction, Cites and statistics results are computed, not judged, with one exception: a printed reference that no index lists is read once by a model before it counts as a citation error. Claims are extracted by a model and kept only when their quote appears verbatim in the text; each cited source is then checked, with a model’s help, for whether it says what the claim relies on. Those verdicts can be wrong — read the claim’s quote and the cited source before relying on one.

Statistics and arithmetic are recomputed, not judged.

Confidence bands are shown only for fields calibrated on our annotated test set. None is calibrated yet, so no band is shown.

What counts as a claim ›How we measure confidence ›How we check this ›

Are you an author, or do you see a problem with this page? Request a review