PreprintCited by 21Antimicrobial Peptides and ActivitiesInvertebrate Immune Response MechanismsAntimicrobial agents and applications

The DOI matches its Crossref record; 1 of the 1 references it cites were found in a registry or an index.

The discovery of antimicrobial peptides from the gut microbiome of cockroach Blattella germanica using deep learning pipeline

Open access

Preprint — published as 10.1186/s40168-024-01985-9

Abstract

Antimicrobial peptides (AMPs) are candidates for use against antibiotic-resistant microorganisms. However, due to high cytotoxicity and poor performance in biological contexts, most AMPs are unable to satisfy the requirements. The gut microbiomes of pathogenic species like Blattella germanica represent unexploited reservoirs of naturally evolved biocompatible AMPs. Here we developed a lightweight AI pipeline called AMPidentifer with two nine-layers Dense-Net blocks and one embedded new self-attention module to enable the discovery of biocompatible AMPs from microbiome. The core structure of AMPidentifer is simple, not requiring complexing code basis. On the independent test dataset, it showed robust performance and avoided high false-positive results. From the gut microbiome of B. germanica , new AMP candidates with potential low toxicities and antimicrobial activities were identified by AMPidentifer. The selected two AMPs demonstrated good antimicrobial effects in vitro and in vivo . The Cys residue was demonstrated to perform different action mechanisms in the antimicrobial activity of two AMPs, providing insights for future rational design. New efficient AMPs with low cytotoxicity identified by the new high-throughput AI pipeline from the gut microbiome of B. germanica successfully showed an important interdisciplinary strategy for discovering bio-safe AMPs from nature. Abstract Figure: The Graphic Abstract

Overview

The claims and statistics of this paper haven’t been checked yet.

Run the check — free, no account needed. It reads the open-access text and checks the sources it cites.

A few free checks a day · papers already verified open instantly · results are public

Integrity signals

Registry

Crossref · 10.1101/2024.02.12.580024

Cites

1 of 1 references verified0 citation errors · 0 not checkable

Statistics

Figures

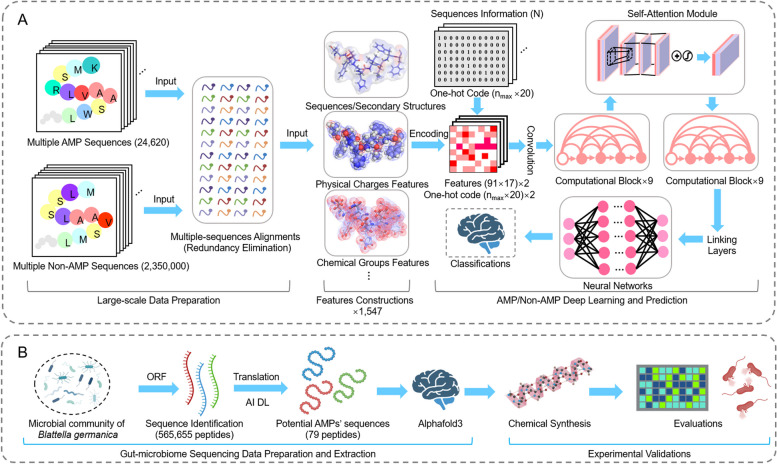
Fig. 1 Schematic workflow of AMPidentifier tool. The gut microbiome data were utilized to discover potential AMP candidates, leading to candidate AMPs for chemical synthesis and laboratory testing. A Advanced deep learning models were employed to distinguish AMPs from non-AMPs, using various features such as physical, chemical, sequence, and structural data as model inputs. B Methods for discovering AMPs from gut microbiome data sourced from the pathogenic insect B. germanica
Fig. 1 Schematic workflow of AMPidentifier tool. The gut microbiome data were utilized to discover potential AMP candidates, leading to candidate AMPs for chemical synthesis and laboratory testing. A Advanced deep learning models were employed to distinguish AMPs from non-AMPs, using various features such as physical, chemical, sequence, and structural data as model inputs. B Methods for discovering AMPs from gut microbiome data sourced from the pathogenic insect B. germanicaCC BY-NC-ND · PubMed Central
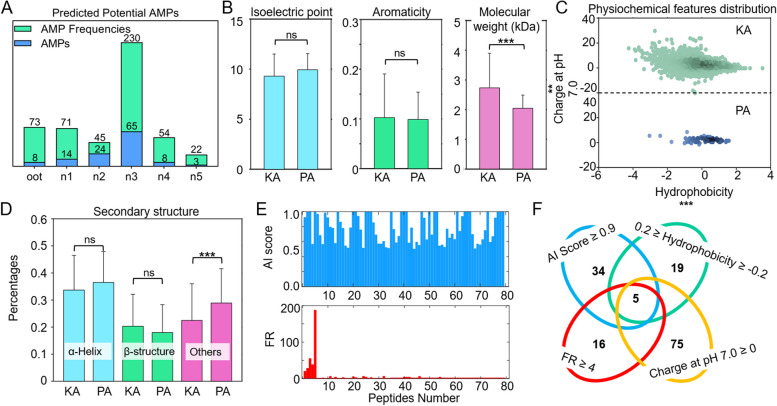
Fig. 2 Mining potential AMPs from the gut microbiome of B. germanica. A The AI deep learning model predicted potential AMP sequences from various developmental stages of B. germanica’s gut microbiome. These samples were classified as oot, n1, n2, n3, n4, and n5, corresponding to embryos and individuals on days 2, 11, 15, 22, and 34 after hatching, respectively. B, C, D Comparative analysis of physiochemical properties including isoelectric points, aromaticity, molecular weight, hydrophobicity, charge at pH 7.0, and secondary structure compositions (α-helix, β-structure, and others) between known AMPs (KA) and AI-predicted AMPs (PA). E AI scores and occurrence rates of 79 potential AMPs identified in B. germanica. F Selection criteria for AMP used in experimental validation
Fig. 2 Mining potential AMPs from the gut microbiome of B. germanica. A The AI deep learning model predicted potential AMP sequences from various developmental stages of B. germanica’s gut microbiome. These samples were classified as oot, n1, n2, n3, n4, and n5, corresponding to embryos and individuals on days 2, 11, 15, 22, and 34 after hatching, respectively. B, C, D Comparative analysis of physiochemical properties including isoelectric points, aromaticity, molecular weight, hydrophobicity, charge at pH 7.0, and secondary structure compositions (α-helix, β-structure, and others) between known AMPs (KA) and AI-predicted AMPs (PA). E AI scores and occurrence rates of 79 potential AMPs identified in B. germanica. F Selection criteria for AMP used in experimental validationCC BY-NC-ND · PubMed Central
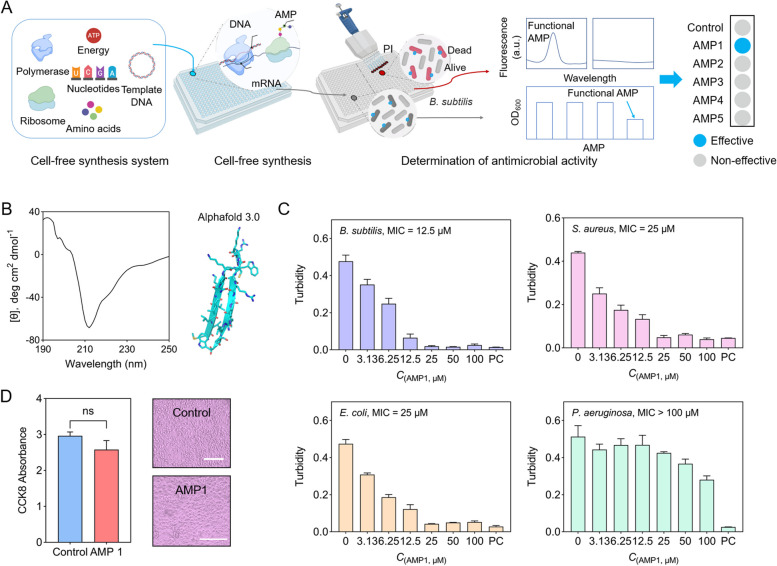
Fig. 3 Experiments verify the potencies of functional AMPs. A Experimental pipeline for rapid cell-free biosynthesis of the predicted AMPs from synthetic DNA fragments and direct testing of produced AMPs in the cell-free mix to bacterial cultures followed by propidium iodide (PI) fluorescence detection assay. B Circular dichroism (CD) spectra of AMP1 and predicted atomic structure of AMP1 by AlphaFold 3.0. AMP1 was in deionized water, and the concentration of AMP1 was fixed at 0.1 mg/mL. C Antibacterial activities of AMP1 towards different bacteria. PC, positive control. In the evaluation of the antimicrobial activity of AMPs against B. subtilis 23,857, E. coli 25,404, and S. aureus 6538, the positive control was represented by 100-μM kanamycin. In the assessment of AMPs against P. aeruginosa 27,853, the positive control was represented by 100-μM ampicillin. D Detection of cytotoxicity of AMP1. The representative optical microscopy images of C2C12 cells are shown here, with a scale bar = 200 µm
Fig. 3 Experiments verify the potencies of functional AMPs. A Experimental pipeline for rapid cell-free biosynthesis of the predicted AMPs from synthetic DNA fragments and direct testing of produced AMPs in the cell-free mix to bacterial cultures followed by propidium iodide (PI) fluorescence detection assay. B Circular dichroism (CD) spectra of AMP1 and predicted atomic structure of AMP1 by AlphaFold 3.0. AMP1 was in deionized water, and the concentration of AMP1 was fixed at 0.1 mg/mL. C Antibacterial activities of AMP1 towards different bacteria. PC, positive control. In the evaluation of the antimicrobial activity of AMPs against B. subtilis 23,857, E. coli 25,404, and S. aureus 6538, the positive control was represented by 100-μM kanamycin. In the assessment of AMPs against P. aeruginosa 27,853, the positive control was represented by 100-μM ampicillin. D Detection of cytotoxicity of AMP1. The representative optical microscopy images of C2C12 cells are shown here, with a scale bar = 200 µmCC BY-NC-ND · PubMed Central
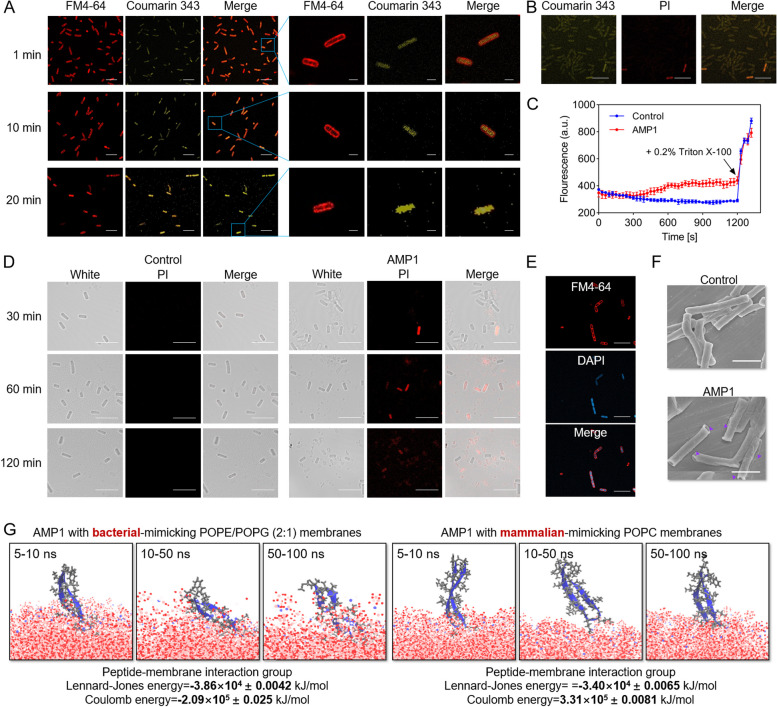
Fig. 4 Action mechanisms of AMP1. A Representative images obtained from confocal laser scanning microscopy to analyze the behavior of AMP1. B. subtilis cells were treated with coumarin 343-labeled AMP1 at a concentration of 100 μM for various durations before observation. During observation, the B. subtilis cells membrane was stained with FM4-64. The scale bar on the left represents 10 μm, while the magnified view provides a scale bar of 2 μm. B Representative confocal laser scanning microscopy image showing dead cell staining after treatment with AMP1 at a concentration of 100 μM for 1 min. The scale bar represents 10 μm. C The quantification of cell membrane potential revealed by DiSC3(5) fluorescence. Triton-X100 (final concentration 0.2%) was the positive control. D Representative confocal laser scanning microscopy images of dead cells stained with PI at various time points following treatment with AMP1 at a concentration of 100 μM. The scale bar represents 10 μm. E Representative confocal laser scanning microscopy image of B. subtilis cells treated with AMP1 at a concentration of 100 μM for 6 h. DNA was stained using DAPI. The scale bar represents 10 μm. F The SEM examination of B. subtilis cells treated with AMPs at concentrations of 100 μM showed cell content leakage and disruption of cell wall. All ruptured cells were indicated by a purple arrow. The scale bar represents 2 μm. G Molecular dynamics (MD) simulations calculating AMP1 with bacterial-mimicking POPE/POPG (2:1) membranes or mammalian POPC membranes
Fig. 4 Action mechanisms of AMP1. A Representative images obtained from confocal laser scanning microscopy to analyze the behavior of AMP1. B. subtilis cells were treated with coumarin 343-labeled AMP1 at a concentration of 100 μM for various durations before observation. During observation, the B. subtilis cells membrane was stained with FM4-64. The scale bar on the left represents 10 μm, while the magnified view provides a scale bar of 2 μm. B Representative confocal laser scanning microscopy image showing dead cell staining after treatment with AMP1 at a concentration of 100 μM for 1 min. The scale bar represents 10 μm. C The quantification of cell membrane potential revealed by DiSC3(5) fluorescence. Triton-X100 (final concentration 0.2%) was the positive control. D Representative confocal laser scanning microscopy images of dead cells stained with PI at various time points following treatment with AMP1 at a concentration of 100 μM. The scale bar represents 10 μm. E Representative confocal laser scanning microscopy image of B. subtilis cells treated with AMP1 at a concentration of 100 μM for 6 h. DNA was stained using DAPI. The scale bar represents 10 μm. F The SEM examination of B. subtilis cells treated with AMPs at concentrations of 100 μM showed cell content leakage and disruption of cell wall. All ruptured cells were indicated by a purple arrow. The scale bar represents 2 μm. G Molecular dynamics (MD) simulations calculating AMP1 with bacterial-mimicking POPE/POPG (2:1) membranes or mammalian POPC membranesCC BY-NC-ND · PubMed Central
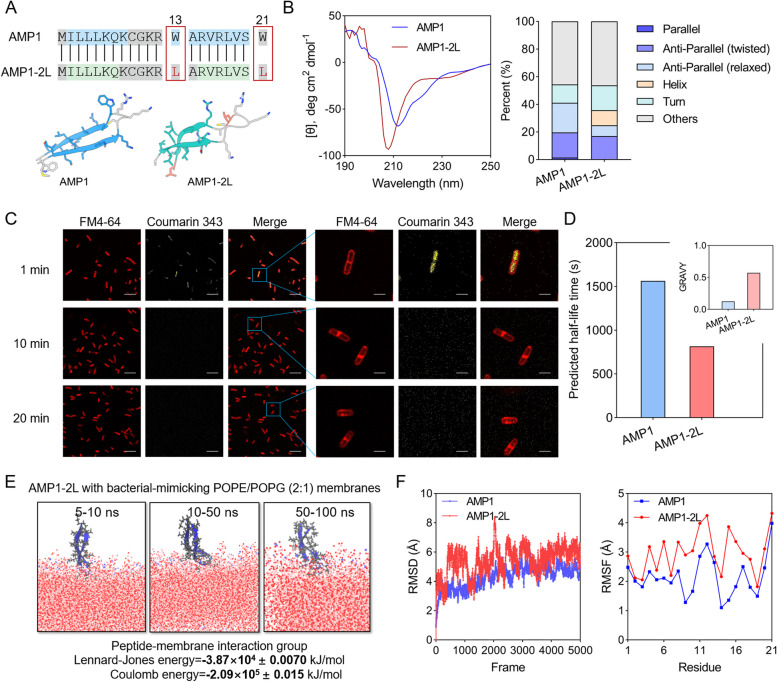
Fig. 5 Action mechanisms of AMP1-2L. A Comparative analysis of AMP1 and AMP1-2L sequences and AlphaFold 3.0 predicted structures. The blue and green regions of the sequence correspond to sequences that form β-strands, respectively. Gray areas correspond to sequences forming other secondary structures. Trp and Leu are highlighted in orange boxes. B Comparative analysis of CD spectra and structural composition of AMP1 and AMP1-2L at a concentration of 0.1 mg/mL. C Representative images obtained from confocal laser scanning microscopy to analyze the behavior of AMP1-2L. B. subtilis cells were treated with coumarin 343-labeled AMP1-2L at a concentration of 100 μM for various durations before observation. During observation, the B. subtilis cells membrane was stained with FM4-64. The scale bar on the left represents 10 μm, while the magnified view provides a scale bar of 2 μm. D The predicted half-life time for AMP1 and AMP1-2L. The inset illustrates the hydrophobicity scores of AMP1 and AMP1-2L, with GRAVY (grand average of hydrophobicity) indicating positive values for hydrophobicity. E MD simulations calculating AMP1-2L with bacterial-mimicking POPE/POPG (2:1) membranes. F MD simulations calculating AMP1 and AMP1-2L in aqueous environments with results of RMSD and RMSF for assessing the structural stability
Fig. 5 Action mechanisms of AMP1-2L. A Comparative analysis of AMP1 and AMP1-2L sequences and AlphaFold 3.0 predicted structures. The blue and green regions of the sequence correspond to sequences that form β-strands, respectively. Gray areas correspond to sequences forming other secondary structures. Trp and Leu are highlighted in orange boxes. B Comparative analysis of CD spectra and structural composition of AMP1 and AMP1-2L at a concentration of 0.1 mg/mL. C Representative images obtained from confocal laser scanning microscopy to analyze the behavior of AMP1-2L. B. subtilis cells were treated with coumarin 343-labeled AMP1-2L at a concentration of 100 μM for various durations before observation. During observation, the B. subtilis cells membrane was stained with FM4-64. The scale bar on the left represents 10 μm, while the magnified view provides a scale bar of 2 μm. D The predicted half-life time for AMP1 and AMP1-2L. The inset illustrates the hydrophobicity scores of AMP1 and AMP1-2L, with GRAVY (grand average of hydrophobicity) indicating positive values for hydrophobicity. E MD simulations calculating AMP1-2L with bacterial-mimicking POPE/POPG (2:1) membranes. F MD simulations calculating AMP1 and AMP1-2L in aqueous environments with results of RMSD and RMSF for assessing the structural stabilityCC BY-NC-ND · PubMed Central
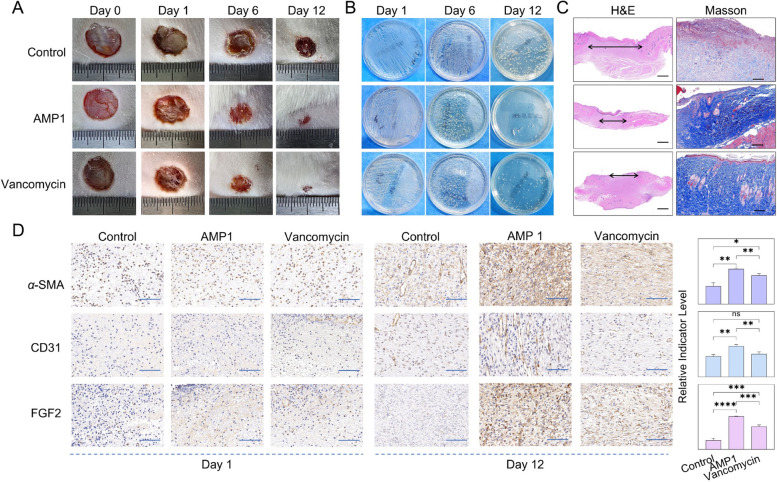
Fig. 6 The wound healing in vivo therapeutic assessments of AMP1. A Representative wound healing results in an infected mouse model treated with control PBS, AMP1, and vancomycin at the same dosage in vivo. B Experimental verification of S. aureus infection load in control, AMP1-treated, and vancomycin-treated groups by streaking on LB agar plates. C Representative histological images of infected tissues from control, AMP1-treated, and vancomycin-treated groups, generated using H&E and Masson staining methods. D Representative histological images selected from repeated experiments for indicating α-SMA, CD31, and FGF2 levels of the AMP1 treatment group and control group at days 1 and 12. The statistical analysis of biomarkers α-SMA, CD31, and FGF2 indicator levels is calculated by ImageJ software among control, AMP1-treated, and vancomycin-treated groups at days 12 with 3 sampling replicates in each group. The scale bar represents 100 μm. The overall significance was assessed by t-test (p* ≤ 0.05, p** ≤ 0.01, p*** ≤ 0.001)
Fig. 6 The wound healing in vivo therapeutic assessments of AMP1. A Representative wound healing results in an infected mouse model treated with control PBS, AMP1, and vancomycin at the same dosage in vivo. B Experimental verification of S. aureus infection load in control, AMP1-treated, and vancomycin-treated groups by streaking on LB agar plates. C Representative histological images of infected tissues from control, AMP1-treated, and vancomycin-treated groups, generated using H&E and Masson staining methods. D Representative histological images selected from repeated experiments for indicating α-SMA, CD31, and FGF2 levels of the AMP1 treatment group and control group at days 1 and 12. The statistical analysis of biomarkers α-SMA, CD31, and FGF2 indicator levels is calculated by ImageJ software among control, AMP1-treated, and vancomycin-treated groups at days 12 with 3 sampling replicates in each group. The scale bar represents 100 μm. The overall significance was assessed by t-test (p* ≤ 0.05, p** ≤ 0.01, p*** ≤ 0.001)CC BY-NC-ND · PubMed Central

Verification

Claims the paper makes

The claims and statistics of this paper haven’t been checked yet.

Run the check — free, no account needed. It reads the open-access text and checks the sources it cites.

A few free checks a day · papers already verified open instantly · results are public

Self-check

Percentages, sums and reported differences re-computed from the paper’s own numbers.

The self-check needs the paper’s full text.

Citations

Cites

Research works printed but not linked: 57

  1. 10.1016/S1473-3099(20)30332-7 · DOI · Paper page
  2. 10.1016/S1473-3099(22)00370-X · DOI
  3. 10.1038/s41579-022-00820-y · DOI · Paper page
  4. 10.1038/s41579-019-0293-3 · DOI
  5. 10.1126/science.aau5480 · DOI
  6. 10.1038/s41564-018-0313-5 · DOI
  7. 10.1039/d0cs01026j · DOI
  8. 10.1002/psc.2947 · DOI
  9. 10.1021/acsnano.0c09509 · DOI
  10. 10.1038/nrmicro1441 · DOI
  11. 10.1371/journal.ppat.1002158 · DOI
  12. 10.1002/pep2.24122 · DOI
  13. 10.1038/s41570-018-0066-y · DOI
  14. 10.1021/acsnano.1c11206 · DOI
  15. 10.1038/s41587-019-0222-z · DOI
  16. 10.1038/nature05233 · DOI
  17. 10.1038/s41573-019-0058-8 · DOI · Paper page
  18. 10.1039/d0cs00729c · DOI
  19. 10.1007/s12274-017-1702-4 · DOI
  20. 10.1124/pr.55.1.2 · DOI
  21. 10.1038/s41467-021-26992-4 · DOI
  22. 10.1016/j.cub.2015.11.063 · DOI
  23. 10.1098/rstb.2015.0291 · DOI
  24. 10.1128/mBio.00040-17 · DOI
  25. 10.1016/j.mib.2008.05.001 · DOI
  26. 10.7554/elife.44341 · DOI
  27. 10.1038/nri.2016.29 · DOI
  28. 10.1126/science.1260580 · DOI · Paper page
  29. 10.1099/mic.0.26265-0 · DOI
  30. 10.1038/s41598-020-77982-3 · DOI
  31. 10.1371/journal.pbio.3001330 · DOI
  32. 10.1038/s41598-021-03695-w · DOI
  33. 10.1007/s00253-020-10973-6 · DOI
  34. 10.1038/s41551-021-00689-x · DOI
  35. C. A, 2023, Voigt Nat. Microbiol, 8, 2420, 10.1038/s41564-023-01524-6 · DOI
  36. 10.3389/fmicb.2019.03097 · DOI
  37. 10.1098/rsfs.2016.0153 · DOI
  38. 10.1371/journal.pone.0051444 · DOI
  39. 10.1038/s41598-018-19752-w · DOI
  40. 10.1021/acs.jcim.2c00089 · DOI
  41. 10.1186/s12859-019-3327-y · DOI
  42. 10.1038/nrd3591 · DOI
  43. 10.1093/bioinformatics/btac715 · DOI
  44. 10.1016/j.omtn.2020.05.006 · DOI
  45. 10.1038/s41551-022-00991-2 · DOI
  46. 10.1038/s41587-022-01226-0 · DOI
  47. 10.1101/2022.01.27.478054 · DOI · Paper page
  48. 10.1109/CVPR.2017.243 · DOI · Paper page
  49. 10.2436/20.1501.01.212 · DOI
  50. 10.1016/j.jcis.2015.09.036 · DOI
  51. 10.1007/s10989-010-9230-z · DOI
  52. 10.1002/anie.201703360 · DOI
  53. 10.1039/d1sc05662j · DOI
  54. 10.1155/2015/475062 · DOI
  55. 10.1093/nar/gkv1278 · DOI
  56. 10.1093/nar/gkac933 · DOI
  57. 10.1371/journal.pone.0066557 · DOI

Metadata

Authors
Chen, S., Qi, H., Zhu, X., Liu, T., Teng, Y., Gong, Q., Jia, C., Liu, T., Chen, S., Qi, H., Zhu, X., Liu, T., Teng, Y., Gong, Q., Jia, C., & Liu, T.
Affiliations
  • Chinese University of Hong Kong (HK)
  • Dalian University of Technology (CN)
  • First Affiliated Hospital of Xi'an Jiaotong University (CN)
  • Dalian Maritime University (CN)
Corresponding author
  • Gong, Qiuyu
  • Liu, Tian
  • Gong, Q
  • Jia, C
Venue
Microbiome
Publisher
openRxiv
Published
2024-02-13
Volume
12
Issue
1
Pages
272-272
ISSN
2049-2618 (ISSN-L)
OpenAlex
W4405659674
Cited by
21
References
1
Citations by year
2026: 10 · 2025: 11
FWCI
5.48
Type
journal article
Language
en
Open access
Licence
cc-by-nc-nd
Locations
  • Microbiome (publishedVersion, cc-by-nc-nd)
  • bioRxiv (Cold Spring Harbor Laboratory) (acceptedVersion)
  • PubMed Central (publishedVersion, cc-by-nc-nd)
  • PubMed (publishedVersion)
  • DOAJ (DOAJ: Directory of Open Access Journals) (submittedVersion)
Funders
  • National Natural Science Foundation of China (62071079)
  • Natural Science Foundation of Liaoning Province (2022-KF-15-02)
Topics
  • Life Sciences › Immunology and Microbiology › Microbiology › Antimicrobial Peptides and Activities
  • Life Sciences › Immunology and Microbiology › Immunology › Invertebrate Immune Response Mechanisms
  • Life Sciences › Immunology and Microbiology › Applied Microbiology and Biotechnology › Antimicrobial agents and applications
Keywords
antimicrobial peptides, Blattella germanica, symbiotic bacteria, antibacterial activity, bacterial cell wall synthesis inhibition, membrane depolarization, wound healing, antibiotic alternatives, antimicrobial resistance
MeSH terms
Gastrointestinal Microbiome, Antimicrobial Peptides, Animals, Anti-Bacterial Agents, Bacteria, Cockroaches, Humans, Microbial Sensitivity Tests, Blattellidae, Mice

About these checks

Registry, retraction, Cites and statistics results are computed, not judged, with one exception: a printed reference that no index lists is read once by a model before it counts as a citation error. Claims are extracted by a model and kept only when their quote appears verbatim in the text; each cited source is then checked, with a model’s help, for whether it says what the claim relies on. Those verdicts can be wrong — read the claim’s quote and the cited source before relying on one.

Statistics and arithmetic are recomputed, not judged.

Confidence bands are shown only for fields calibrated on our annotated test set. None is calibrated yet, so no band is shown.

What counts as a claim ›How we measure confidence ›How we check this ›

Are you an author, or do you see a problem with this page? Request a review