PreprintCited by 7RNA Research and SplicingRNA and protein synthesis mechanismsNuclear Structure and Function

The DOI matches its Crossref record; 1 of the 1 references it cites were found in a registry or an index.

A unique mechanism of snRNP core assembly

Open access
Wang, Yingzhi, Chen, Xiaoshuang, Kong, Xi, Chen, Yunfeng, Xiang, Zixi, Xiang, Yue, Hu, Yan, Hou, Yan, Zhou, Shijie, Shen, Congcong, Mu, Li, Su, Dan, Zhang, Rundong·2024·Nature Communications

Preprint — published as 10.1038/s41467-025-58461-7 · Paper page

Abstract

The assembly of spliceosomal snRNP cores involves seven Sm proteins (D1/D2/F/E/G/D3/B) forming a ring around each snRNA and typically requires several essential assembly chaperones, particularly the SMN-Gemins complex implicated in spinal muscular atrophy (SMA). Strikingly, in budding yeast, snRNP core assembly only involves Brr1, a nonessential homolog of Gemin2. To unravel this enigma, we systematically investigated snRNP core assembly in budding yeast using biochemical and genetic approaches. We discovered two distinct pathways in budding yeast: chaperone-mediated and direct. The chaperone-mediated pathway involves two proteins, Brr1 and a novel protein, Lot5, but is inefficient. Lot5 binds D1/D2/F/E/G to form a heterohexameric ring (6S). Brr1 binds D1/D2/F/E/G and 6S but cannot displace Lot5 to facilitate assembly. Disruption of both BRR1 and LOT5 genes caused mild growth retardation, but LOT5 overexpression substantially impeded growth. The direct pathway uniquely involves F/E/G as a trimer and a stable D1/D2/F/E/G intermediate complex, explaining the non-essentiality of assembly chaperones. These findings unveil a unique assembly mechanism of snRNP cores, illuminate the evolution of assembly chaperones, and suggest avenues for studying SMA pathophysiology.

Overview

The claims and statistics of this paper haven’t been checked yet.

Run the check — free, no account needed. It reads the open-access text and checks the sources it cites.

A few free checks a day · papers already verified open instantly · results are public

Integrity signals

Registry

Crossref · 10.1101/2024.07.09.602679

Cites

1 of 1 references verified0 citation errors · 0 not checkable

Statistics

Figures

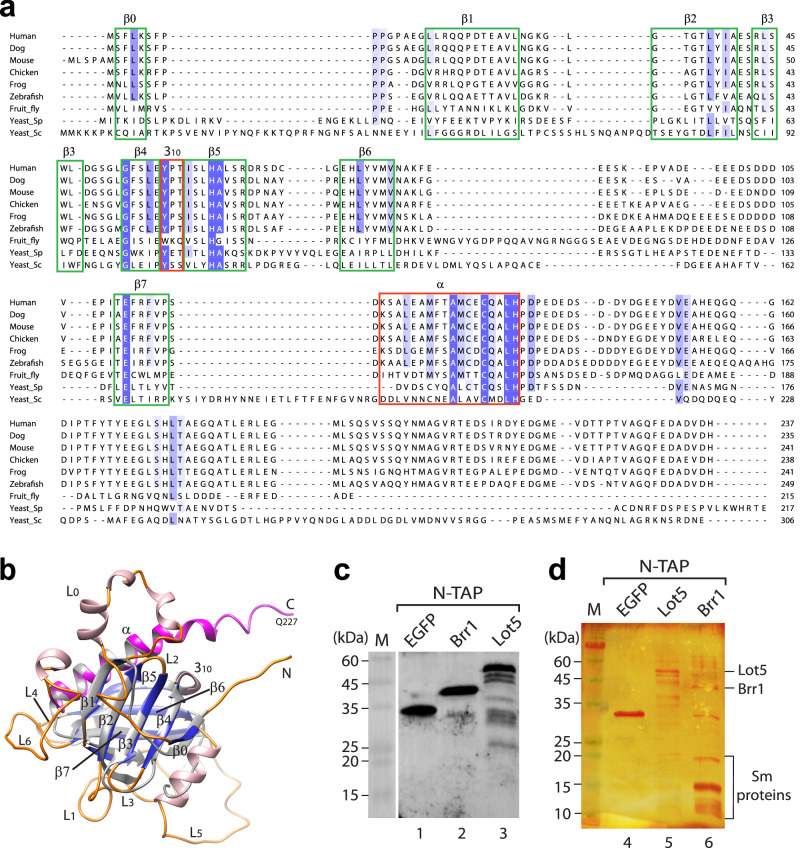
Fig. 1 Alignment of Lot5 with pICln homologs and identification of proteins interacting with Lot5 and Brr1. a Sequence alignment of Lot5 (Yeast_Sc) with pICln homologs from various species. Secondary structures (β0-β7 strands, 310 and α helices) are annotated based on the crystal structure of fruit fly pICln (PDB: 4F7U). Conserved residues are highlighted in blue, with the intensity of the color reflecting the level of conservation. b Structural alignment between the AlphaFold structure model of Lot5 (residues 1–227) (β0-β7 strands are colored in blue, α helix in purple, other α helices in pink, and loops in orange) and the structure of fruit fly pICln (in grey); c, d Identification of proteins interacting with the N-terminally TAP-tagged Lot5 or Brr1 by a pull-down assay followed by Western blot analysis probed with a FLAG-antibody (c) and silver staining (d), as well as mass spectrometry analysis (Supplementary Table 1). EGFP served as a control. For each set, a representative result from two independent experiments is shown.
Fig. 1 Alignment of Lot5 with pICln homologs and identification of proteins interacting with Lot5 and Brr1. a Sequence alignment of Lot5 (Yeast_Sc) with pICln homologs from various species. Secondary structures (β0-β7 strands, 310 and α helices) are annotated based on the crystal structure of fruit fly pICln (PDB: 4F7U). Conserved residues are highlighted in blue, with the intensity of the color reflecting the level of conservation. b Structural alignment between the AlphaFold structure model of Lot5 (residues 1–227) (β0-β7 strands are colored in blue, α helix in purple, other α helices in pink, and loops in orange) and the structure of fruit fly pICln (in grey); c, d Identification of proteins interacting with the N-terminally TAP-tagged Lot5 or Brr1 by a pull-down assay followed by Western blot analysis probed with a FLAG-antibody (c) and silver staining (d), as well as mass spectrometry analysis (Supplementary Table 1). EGFP served as a control. For each set, a representative result from two independent experiments is shown.CC BY-NC-ND · PubMed Central
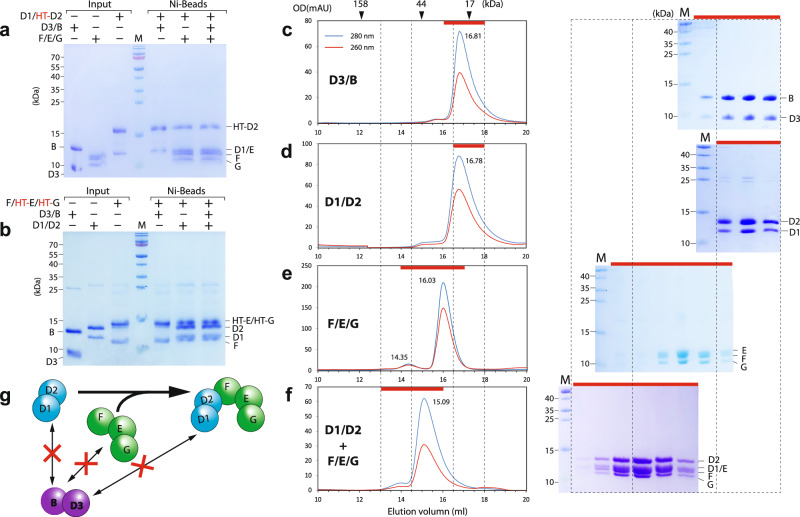
Fig. 2 Oligomerization states of 3 Sm subcomplexes from S. cerevisiae and their interactions. Interactions among Sm subcomplexes were tested by a pull-down assay. In each reaction, only one Sm subcomplex, D1/D2 (a) or F/E/G (b), was tagged with His-TEV (HT-), while the other subcomplex(es) had the HT-tag removed. The indicated Sm subcomplexes were incubated and then pulled down using Ni-beads. M markers. The oligomerization states of D3/B (c), D1/D2 (d), and F/E/G (e) and the interaction between D1/D2 and F/E/G (f) were tested using GFC (left panels). The eluted fractions (indicated by red bars) were then analyzed by SDS-PAGE/CBB staining (right panels). For each set, a representative result from two independent experiments is shown. g Summary of the oligomerization states and interactions of the three Sm subcomplexes.
Fig. 2 Oligomerization states of 3 Sm subcomplexes from S. cerevisiae and their interactions. Interactions among Sm subcomplexes were tested by a pull-down assay. In each reaction, only one Sm subcomplex, D1/D2 (a) or F/E/G (b), was tagged with His-TEV (HT-), while the other subcomplex(es) had the HT-tag removed. The indicated Sm subcomplexes were incubated and then pulled down using Ni-beads. M markers. The oligomerization states of D3/B (c), D1/D2 (d), and F/E/G (e) and the interaction between D1/D2 and F/E/G (f) were tested using GFC (left panels). The eluted fractions (indicated by red bars) were then analyzed by SDS-PAGE/CBB staining (right panels). For each set, a representative result from two independent experiments is shown. g Summary of the oligomerization states and interactions of the three Sm subcomplexes.CC BY-NC-ND · PubMed Central
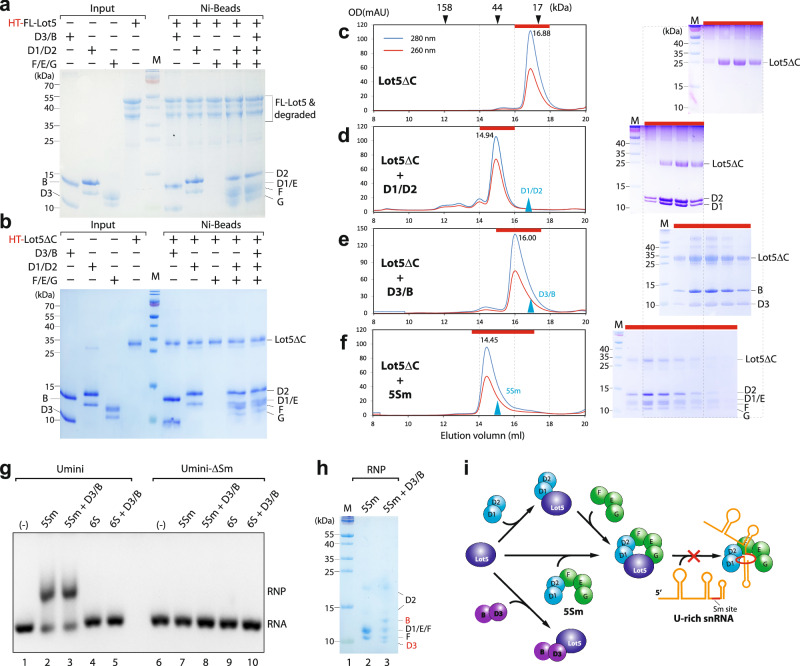
Fig. 3 Lot5 acts as a pICln homolog in interacting with the Sm subcomplexes and snRNA. The binding assay was performed using full-length Lot5 from S. cerevisiae (a) or a C-terminally truncated form of Lot5 (b), with each of the three Sm subcomplexes individually and together. The interaction was assessed through a pull-down assay using Ni-beads. M markers. c–f Complexation assays. Lot5 alone (c) or equimolar amounts of Lot5 mixed with D1/D2 (d), D3/B (e), or 5Sm (f), was subjected to GFC (left panels). The eluted fractions (indicated by red bars) were then analyzed by SDS-PAGE/CBB staining (right panels). The blue arrowheads indicate the GFC peaks of the input components (D1/D2, D3/B, and 5Sm) for comparison. g Lot5 blocks snRNA binding to the Sm subcore and core. Reconstituted 5Sm or 6S, either alone or together with D3/B, was pre-incubated with Umini-snRNA or Umini-ΔSm-snRNA (as a control) and subjected to electrophoresis mobility shift assay (EMSA). h The protein components binding to Umini-snRNA, of the shifted bands in (g), were analyzed using SDS-PAGE/CBB staining. For each set, one representative of at least two independent experiments is shown. i A cartoon model of the interactions of Lot5 with the Sm proteins and snRNA.
Fig. 3 Lot5 acts as a pICln homolog in interacting with the Sm subcomplexes and snRNA. The binding assay was performed using full-length Lot5 from S. cerevisiae (a) or a C-terminally truncated form of Lot5 (b), with each of the three Sm subcomplexes individually and together. The interaction was assessed through a pull-down assay using Ni-beads. M markers. c–f Complexation assays. Lot5 alone (c) or equimolar amounts of Lot5 mixed with D1/D2 (d), D3/B (e), or 5Sm (f), was subjected to GFC (left panels). The eluted fractions (indicated by red bars) were then analyzed by SDS-PAGE/CBB staining (right panels). The blue arrowheads indicate the GFC peaks of the input components (D1/D2, D3/B, and 5Sm) for comparison. g Lot5 blocks snRNA binding to the Sm subcore and core. Reconstituted 5Sm or 6S, either alone or together with D3/B, was pre-incubated with Umini-snRNA or Umini-ΔSm-snRNA (as a control) and subjected to electrophoresis mobility shift assay (EMSA). h The protein components binding to Umini-snRNA, of the shifted bands in (g), were analyzed using SDS-PAGE/CBB staining. For each set, one representative of at least two independent experiments is shown. i A cartoon model of the interactions of Lot5 with the Sm proteins and snRNA.CC BY-NC-ND · PubMed Central
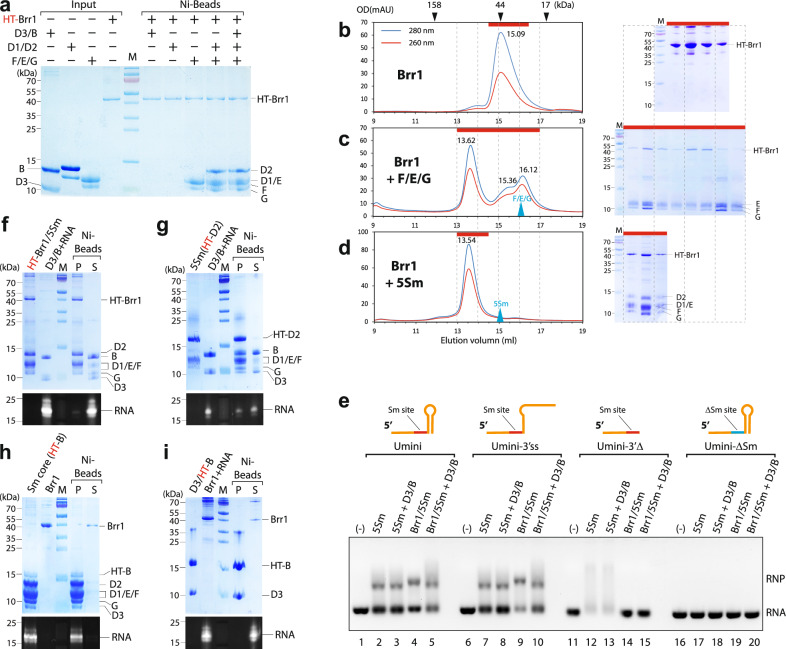
Fig. 4 Brr1 acts like Gemin2/SMNGe2BD in interacting with the Sm subcomplexes and snRNA. a The binding assay was performed using S. cerevisiae Brr1 with each of the three Sm subcomplexes individually and together. The interaction was assessed through a pull-down assay using Ni-beads. b–d Complexation assays. Brr1 alone (b), or equimolar amounts of Brr1 mixed with F/E/G (c) or 5Sm (d), were subjected to GFC (left panels). The eluted fractions (red bar) were analyzed by SDS-PAGE/CBB staining (right panels). Blue arrowheads indicate the GFC peaks of the input components (F/E/G and 5Sm) for comparison. e The role of Brr1 in assembly of the Sm subcore and core was assessed using EMSA. Reconstituted 5Sm or Brr1/5Sm, either alone or together with D3/B, was pre-incubated with Umini, Umini-3′ss, Umini-3′Δ, or Umini-ΔSm snRNA and subjected to EMSA. f–i Ni-beads pull-down assays were performed to test the dissociation of Brr1 from Sm core assembly. Source data are provided as a Source Data file. The forward reaction was initiated with either HT-Brr1/5Sm (f) or 5Sm (HT-D2) as a positive control (g) and incubated with D3/B and Umini-snRNA. The reverse reaction started with pre-assembled Sm core (HT-B) (h) or HT-B/D3 plus Umini-snRNA (i) and incubated with Brr1. The samples were then analyzed using SDS-PAGE /CBB staining and GelRed staining. For each set, one representative of at least two independent experiments is shown.
Fig. 4 Brr1 acts like Gemin2/SMNGe2BD in interacting with the Sm subcomplexes and snRNA. a The binding assay was performed using S. cerevisiae Brr1 with each of the three Sm subcomplexes individually and together. The interaction was assessed through a pull-down assay using Ni-beads. b–d Complexation assays. Brr1 alone (b), or equimolar amounts of Brr1 mixed with F/E/G (c) or 5Sm (d), were subjected to GFC (left panels). The eluted fractions (red bar) were analyzed by SDS-PAGE/CBB staining (right panels). Blue arrowheads indicate the GFC peaks of the input components (F/E/G and 5Sm) for comparison. e The role of Brr1 in assembly of the Sm subcore and core was assessed using EMSA. Reconstituted 5Sm or Brr1/5Sm, either alone or together with D3/B, was pre-incubated with Umini, Umini-3′ss, Umini-3′Δ, or Umini-ΔSm snRNA and subjected to EMSA. f–i Ni-beads pull-down assays were performed to test the dissociation of Brr1 from Sm core assembly. Source data are provided as a Source Data file. The forward reaction was initiated with either HT-Brr1/5Sm (f) or 5Sm (HT-D2) as a positive control (g) and incubated with D3/B and Umini-snRNA. The reverse reaction started with pre-assembled Sm core (HT-B) (h) or HT-B/D3 plus Umini-snRNA (i) and incubated with Brr1. The samples were then analyzed using SDS-PAGE /CBB staining and GelRed staining. For each set, one representative of at least two independent experiments is shown.CC BY-NC-ND · PubMed Central
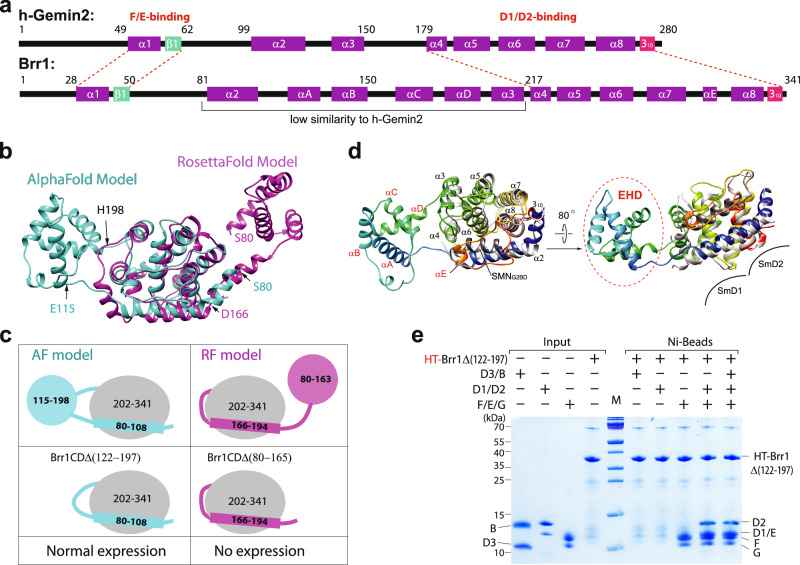
Fig. 5 Characterization of the Brr1 structure. a Secondary structural elements of human Gemin2 and S. cerevisiae Brr1. Known domain compositions are indicated. b Superimposition of the AlphaFold and RosettaFold models of Brr1(80-341). c The summary of the truncated constructs of Brr1CD and expression test results. See details in Supplementary Fig. 7. d The superimposition of the AlphaFold structure model of Brr1(80-341) (colored in rainbow: the N-terminus in blue, the C-terminus in red) with the structure of human Gemin2-CD (in light gray, PDB: 5XJL). The superimposition reveals that the long loop between α7 and α8 in Brr1 (in orange), which contains αE, occupies the position where SMNGe2BD (in dark gray) binds to Gemin2. Moreover, the EHD of Brr1 is far away from SmD1/D2. e The binding assay was conducted to test the interaction of Brr1Δ(122-197) with each of the three Sm subcomplexes, individually and together. The interaction was assessed using a pull-down assay with Ni-beads. One representative of two independent experiments is shown. M markers.
Fig. 5 Characterization of the Brr1 structure. a Secondary structural elements of human Gemin2 and S. cerevisiae Brr1. Known domain compositions are indicated. b Superimposition of the AlphaFold and RosettaFold models of Brr1(80-341). c The summary of the truncated constructs of Brr1CD and expression test results. See details in Supplementary Fig. 7. d The superimposition of the AlphaFold structure model of Brr1(80-341) (colored in rainbow: the N-terminus in blue, the C-terminus in red) with the structure of human Gemin2-CD (in light gray, PDB: 5XJL). The superimposition reveals that the long loop between α7 and α8 in Brr1 (in orange), which contains αE, occupies the position where SMNGe2BD (in dark gray) binds to Gemin2. Moreover, the EHD of Brr1 is far away from SmD1/D2. e The binding assay was conducted to test the interaction of Brr1Δ(122-197) with each of the three Sm subcomplexes, individually and together. The interaction was assessed using a pull-down assay with Ni-beads. One representative of two independent experiments is shown. M markers.CC BY-NC-ND · PubMed Central
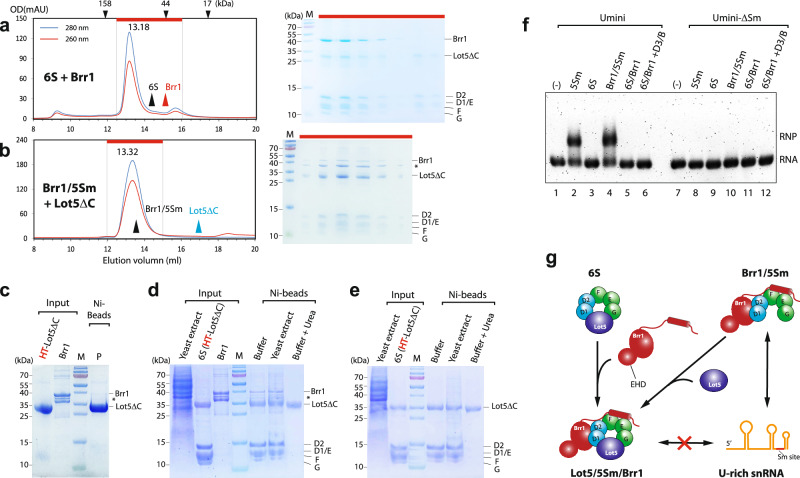
Fig. 6 Formation of the Lot5/5Sm/Brr1 complex which inhibits snRNA binding. a, b Complexation assays. Preformed 6S mixed with Brr1 (a) or preformed Brr1/5Sm mixed with Lot5ΔC (b) in equimolar amounts, were subjected to GFC (left panels). The eluted fractions (red bar) were then analyzed by SDS-PAGE/CBB staining (right panels). The black and red arrowheads in (a) indicate the GFC peaks of the input components (6S and Brr1) for comparison. The black and blue arrowheads in (b) indicate the GFC peaks of the input components (Brr1/5Sm and Lot5ΔC) for comparison. The asterisk indicates N-terminal degraded Brr1 in (b–d). c No direct interaction between Lot5ΔC and Brr1 tested by Ni-bead pull-down assay. P precipitate. Disassembly assays of 6S/Brr1 (d) or 6S (e) incubated with yeast extract. Pre-assembled 6S/Brr1 or 6S was bound to Ni-beads first, and then incubated with yeast extract (or with washing buffer or washing buffer containing 8 M urea as controls). After incubation, the mixtures were separated and washed, and the bound fractions were subjected to SDS-PAGE/CBB staining. Yeast extract input represents 0.5% of total proteins in the reaction. f Binding test of different complexes with snRNA using EMSA. Pre-reconstituted 5Sm, 6S, Brr1/5Sm, or 6S/Brr1 or equimolar amounts of 6S/Brr1 mixed with D3/B were pre-incubated with Umini-snRNA or Umini-ΔSm-snRNA (as a control) and subjected to EMSA. M markers. For each, one representative result of at least two independent experiments is shown. g A cartoon model of the formation of the Lot5/5Sm/Brr1 complex and its inhibition of snRNA binding.
Fig. 6 Formation of the Lot5/5Sm/Brr1 complex which inhibits snRNA binding. a, b Complexation assays. Preformed 6S mixed with Brr1 (a) or preformed Brr1/5Sm mixed with Lot5ΔC (b) in equimolar amounts, were subjected to GFC (left panels). The eluted fractions (red bar) were then analyzed by SDS-PAGE/CBB staining (right panels). The black and red arrowheads in (a) indicate the GFC peaks of the input components (6S and Brr1) for comparison. The black and blue arrowheads in (b) indicate the GFC peaks of the input components (Brr1/5Sm and Lot5ΔC) for comparison. The asterisk indicates N-terminal degraded Brr1 in (b–d). c No direct interaction between Lot5ΔC and Brr1 tested by Ni-bead pull-down assay. P precipitate. Disassembly assays of 6S/Brr1 (d) or 6S (e) incubated with yeast extract. Pre-assembled 6S/Brr1 or 6S was bound to Ni-beads first, and then incubated with yeast extract (or with washing buffer or washing buffer containing 8 M urea as controls). After incubation, the mixtures were separated and washed, and the bound fractions were subjected to SDS-PAGE/CBB staining. Yeast extract input represents 0.5% of total proteins in the reaction. f Binding test of different complexes with snRNA using EMSA. Pre-reconstituted 5Sm, 6S, Brr1/5Sm, or 6S/Brr1 or equimolar amounts of 6S/Brr1 mixed with D3/B were pre-incubated with Umini-snRNA or Umini-ΔSm-snRNA (as a control) and subjected to EMSA. M markers. For each, one representative result of at least two independent experiments is shown. g A cartoon model of the formation of the Lot5/5Sm/Brr1 complex and its inhibition of snRNA binding.CC BY-NC-ND · PubMed Central
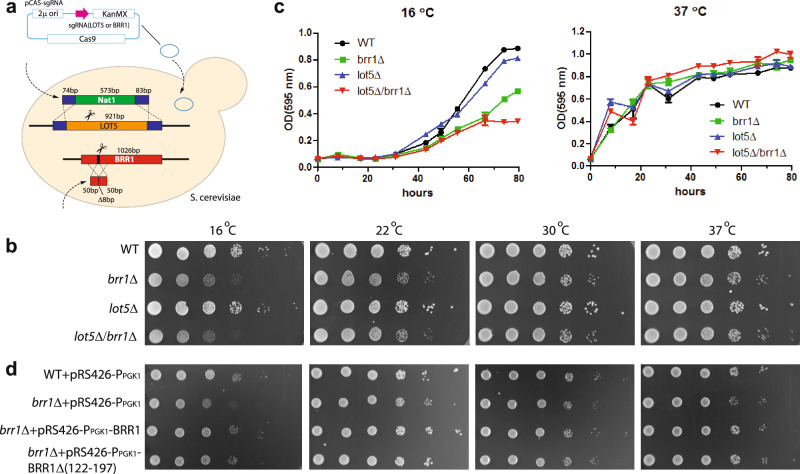
Fig. 7 Disruption of genes LOT5 and BRR1 in S. cerevisiae causes mild growth retardation. a Schematic view of Cas9-assisted disruption of genes LOT5 or/and BRR1 in S. cerevisiae. More detailed steps and verifications are in Supplementary Fig. 10. b Growth phenotypes on YPD plates of different strains (lot5Δ, brr1Δ, and lot5Δ/brr1Δ) at different temperatures. The tested strains were initially grown in liquid YPD at 30 °C to reach an OD595nm of about 0.6. The cell concentrates were then normalized, and serial dilutions of the cells were spotted on YPD plates and cultured at various temperatures (16, 22, 30, and 37 °C). The growth of the strains was observed and recorded. c Growth time curves in liquid YPD culture at 16 or 37 °C. At each time point, samples were collected from three separate cultures for OD595nm measurement. The mean and standard deviation (SD) are shown at each time point. Source data are provided as a Source Data file. d Deletion rescue assay. The brr1Δ strain transformed with pRS426-PPGK1-BRR1, or pRS426-PPGK1-BRR1Δ(122-197) (to test if it functions as full-length Brr1 in vivo) or pRS426-PPGK1 (as a negative control), or the wildtype strain transformed with pRS426-PPGK1 (as a positive control) was spotted in serial dilutions on SD medium plates without uracil and cultured at different temperatures (16, 22, 30, and 37 °C). Strain growth was observed and recorded.
Fig. 7 Disruption of genes LOT5 and BRR1 in S. cerevisiae causes mild growth retardation. a Schematic view of Cas9-assisted disruption of genes LOT5 or/and BRR1 in S. cerevisiae. More detailed steps and verifications are in Supplementary Fig. 10. b Growth phenotypes on YPD plates of different strains (lot5Δ, brr1Δ, and lot5Δ/brr1Δ) at different temperatures. The tested strains were initially grown in liquid YPD at 30 °C to reach an OD595nm of about 0.6. The cell concentrates were then normalized, and serial dilutions of the cells were spotted on YPD plates and cultured at various temperatures (16, 22, 30, and 37 °C). The growth of the strains was observed and recorded. c Growth time curves in liquid YPD culture at 16 or 37 °C. At each time point, samples were collected from three separate cultures for OD595nm measurement. The mean and standard deviation (SD) are shown at each time point. Source data are provided as a Source Data file. d Deletion rescue assay. The brr1Δ strain transformed with pRS426-PPGK1-BRR1, or pRS426-PPGK1-BRR1Δ(122-197) (to test if it functions as full-length Brr1 in vivo) or pRS426-PPGK1 (as a negative control), or the wildtype strain transformed with pRS426-PPGK1 (as a positive control) was spotted in serial dilutions on SD medium plates without uracil and cultured at different temperatures (16, 22, 30, and 37 °C). Strain growth was observed and recorded.CC BY-NC-ND · PubMed Central
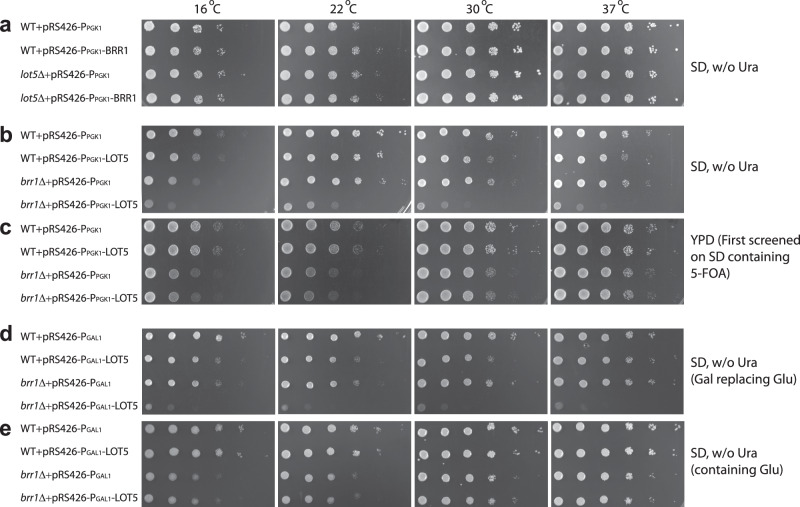
Fig. 8 Overexpression of gene LOT5 in S. cerevisiae inhibits cell growth. a Overexpression of BRR1 has no significant phenotype on cell growth. The wildtype and lot5Δ strains transformed with either pRS426-PPGK1 (as a negative control) or pRS426-PPGK1-BRR1 were spotted in serial dilutions on SD medium plates without uracil and cultured at different temperatures (16, 22, 30, and 37 °C). Strain growth was observed and recorded. b Constitutive overexpression of LOT5 in the wildtype and brr1Δ strains inhibits cell growth. The wildtype and brr1Δ strains transformed with either pRS426-PPGK1 (as a negative control) or pRS426-PPGK1-LOT5 were spotted in serial dilutions on SD medium plates without uracil and cultured at different temperatures (16, 22, 30, and 37 °C). Strain growth was observed and recorded. c Control experiments for (b). The four strains from (b) were plated on 5-FOA-containing SD medium to select strains that expelled pRS426 plasmids. Surviving strains were then serially diluted and spotted on YPD plates at different temperatures (16, 22, 30, and 37 °C), and their growth was observed and recorded. d, e Induced overexpression of LOT5 in the wildtype and brr1Δ strains inhibits cell growth. The wildtype and brr1Δ strains transformed with either pRS426-PGAL1 (as a negative control) or pRS426-PGAL1-LOT5 were spotted in serial dilutions on SD medium plates without uracil, with either galactose (d) or glucose (e), and cultured at varying temperatures (16, 22, 30, and 37 °C). Strain growth was observed and recorded.
Fig. 8 Overexpression of gene LOT5 in S. cerevisiae inhibits cell growth. a Overexpression of BRR1 has no significant phenotype on cell growth. The wildtype and lot5Δ strains transformed with either pRS426-PPGK1 (as a negative control) or pRS426-PPGK1-BRR1 were spotted in serial dilutions on SD medium plates without uracil and cultured at different temperatures (16, 22, 30, and 37 °C). Strain growth was observed and recorded. b Constitutive overexpression of LOT5 in the wildtype and brr1Δ strains inhibits cell growth. The wildtype and brr1Δ strains transformed with either pRS426-PPGK1 (as a negative control) or pRS426-PPGK1-LOT5 were spotted in serial dilutions on SD medium plates without uracil and cultured at different temperatures (16, 22, 30, and 37 °C). Strain growth was observed and recorded. c Control experiments for (b). The four strains from (b) were plated on 5-FOA-containing SD medium to select strains that expelled pRS426 plasmids. Surviving strains were then serially diluted and spotted on YPD plates at different temperatures (16, 22, 30, and 37 °C), and their growth was observed and recorded. d, e Induced overexpression of LOT5 in the wildtype and brr1Δ strains inhibits cell growth. The wildtype and brr1Δ strains transformed with either pRS426-PGAL1 (as a negative control) or pRS426-PGAL1-LOT5 were spotted in serial dilutions on SD medium plates without uracil, with either galactose (d) or glucose (e), and cultured at varying temperatures (16, 22, 30, and 37 °C). Strain growth was observed and recorded.CC BY-NC-ND · PubMed Central
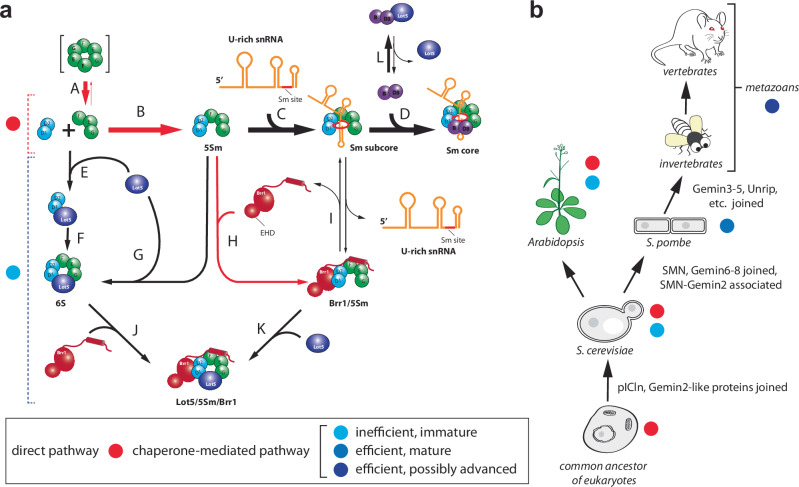
Fig. 9 Models of Sm core assembly mechanism in S. cerevisiae and evolution of assembly chaperones. a The mechanistic model of Sm core assembly in S. cerevisiae. There are two pathways for Sm core assembly: (1) the direct assembly pathway, which is dominant; and (2) the chaperone-mediated assembly pathway, which is immature and less efficient compared to the characterized pICln-SMN complex-mediated pathway in S. pombe and vertebrates. In the direct pathway, F/E/G exists in a trimeric state (A) so that D1/D2 and F/E/G can spontaneously form a stable 5Sm complex (B). These steps are distinct from those observed in other characterized eukaryotes. This leads to the spontaneous assembly of the Sm subcore (C) and eventually the Sm core (D). In the chaperone-mediated pathway, only the intermediate Brr1/5Sm can progress through the Sm core assembly (H-I), while the intermediate complexes formed with Lot5—either 6S (E, F, G) or Lot5/5Sm/Brr1 (J, K)—represent dead-end complexes that are unable to assemble the Sm core. The complexes indicated within square brackets are unstable or transient, and the thickness of the arrow lines represents the preferred direction. The red lines represent reactions unique to S. cerevisiae compared to the known mechanisms observed in other eukaryotes. b The evolution model of Sm core assembly chaperones. The assembly pathways in Arabidopsis and the common ancestor of eukaryotes are anticipated. The exact components of the assembly chaperones in invertebrates are still not completely known.
Fig. 9 Models of Sm core assembly mechanism in S. cerevisiae and evolution of assembly chaperones. a The mechanistic model of Sm core assembly in S. cerevisiae. There are two pathways for Sm core assembly: (1) the direct assembly pathway, which is dominant; and (2) the chaperone-mediated assembly pathway, which is immature and less efficient compared to the characterized pICln-SMN complex-mediated pathway in S. pombe and vertebrates. In the direct pathway, F/E/G exists in a trimeric state (A) so that D1/D2 and F/E/G can spontaneously form a stable 5Sm complex (B). These steps are distinct from those observed in other characterized eukaryotes. This leads to the spontaneous assembly of the Sm subcore (C) and eventually the Sm core (D). In the chaperone-mediated pathway, only the intermediate Brr1/5Sm can progress through the Sm core assembly (H-I), while the intermediate complexes formed with Lot5—either 6S (E, F, G) or Lot5/5Sm/Brr1 (J, K)—represent dead-end complexes that are unable to assemble the Sm core. The complexes indicated within square brackets are unstable or transient, and the thickness of the arrow lines represents the preferred direction. The red lines represent reactions unique to S. cerevisiae compared to the known mechanisms observed in other eukaryotes. b The evolution model of Sm core assembly chaperones. The assembly pathways in Arabidopsis and the common ancestor of eukaryotes are anticipated. The exact components of the assembly chaperones in invertebrates are still not completely known.CC BY-NC-ND · PubMed Central

Verification

Claims the paper makes

The claims and statistics of this paper haven’t been checked yet.

Run the check — free, no account needed. It reads the open-access text and checks the sources it cites.

A few free checks a day · papers already verified open instantly · results are public

Self-check

Percentages, sums and reported differences re-computed from the paper’s own numbers.

The self-check needs the paper’s full text.

Citations

Cites

Research works printed but not linked: 49

  1. 10.1038/nrm3742 · DOI · Paper page
  2. Will CL , Luhrmann R. Spliceosome structure and function. Cold Spring Harb Perspect Biol 3, (2011). · DOI · Paper page
  3. 10.1016/S0092-8674(00)80550-4 · DOI · Paper page
  4. 10.1016/j.semcdb.2014.04.026 · DOI
  5. 10.1016/j.cell.2008.09.020 · DOI
  6. 1996, The snRNP core assembly pathway: identification of stable core protein heteromeric complexes and an snRNP subcore particle in vitro, EMBO J, 15, 2256, 10.1002/j.1460-2075.1996.tb00579.x · DOI
  7. 10.1074/jbc.M001441200 · DOI
  8. 10.1093/hmg/9.5.675 · DOI
  9. 10.1093/hmg/9.5.663 · DOI
  10. 2021, Identification and structural analysis of the Schizosaccharomyces pombe SMN complex, Nucleic Acids Res, 49, 7207, 10.1093/nar/gkab158 · DOI
  11. 10.1128/MCB.01407-13 · DOI
  12. 2023, Mechanism of assembly of snRNP cores assisted by ICln and the SMN complex in fission yeast, iScience, 26, 107604, 10.1016/j.isci.2023.107604 · DOI
  13. 10.1074/jbc.275.17.12363 · DOI
  14. 10.1073/pnas.94.18.9920 · DOI
  15. 10.1073/pnas.152318699 · DOI
  16. 10.1016/0092-8674(95)90460-3 · DOI
  17. 10.1038/nrn2670 · DOI · Paper page
  18. 10.1016/j.molcel.2012.12.009 · DOI
  19. 10.1261/rna.940708 · DOI
  20. 10.1016/j.cell.2011.06.043 · DOI
  21. 10.1074/jbc.M608528200 · DOI
  22. 10.1074/jbc.M607505200 · DOI
  23. 10.1074/jbc.M512243200 · DOI
  24. 10.1083/jcb.147.6.1181 · DOI
  25. 10.1083/jcb.148.6.1177 · DOI
  26. 10.1016/j.molcel.2010.03.014 · DOI
  27. Martinez-Salas E , Embarc-Buh A , Francisco-Velilla R . Emerging Roles of Gemin5: From snRNPs Assembly to Translation Control. Int J Mol Sci 21, (2020). · DOI
  28. 2023, PICLN modulates alternative splicing and light/temperature responses in plants, Plant Physiol, 191, 1036, 10.1093/plphys/kiac527 · DOI
  29. 10.1073/pnas.1504541112 · DOI
  30. 10.1261/rna.059881.116 · DOI
  31. 1996, Transcriptional pulse-chase analysis reveals a role for a novel snRNP-associated protein in the manufacture of spliceosomal snRNPs, EMBO J, 15, 4368, 10.1002/j.1460-2075.1996.tb00810.x · DOI
  32. 10.1126/science.274.5287.546 · DOI
  33. 10.1038/nature00935 · DOI · Paper page
  34. 10.1016/j.celrep.2019.05.031 · DOI · Paper page
  35. 10.1093/nar/gkz1135 · DOI
  36. 10.1128/MCB.25.24.10989-11004.2005 · DOI
  37. 10.1126/science.abj8754 · DOI · Paper page
  38. 10.1006/bbrc.2001.4776 · DOI
  39. 10.1073/pnas.0802287105 · DOI
  40. 10.1016/j.molcel.2005.12.011 · DOI
  41. 10.1016/j.jmb.2009.11.006 · DOI
  42. 10.1074/jbc.M500541200 · DOI
  43. 10.1006/jmbi.2001.4624 · DOI
  44. 10.1016/j.brainres.2018.02.022 · DOI
  45. Ryan OW , et al. Selection of chromosomal DNA libraries using a multiplex CRISPR system. Elife 3, (2014). · DOI
  46. 10.1016/S0076-6879(02)50957-5 · DOI
  47. 10.1016/j.pep.2007.03.018 · DOI
  48. 10.1093/NAR/GKAB1061 · DOI · Paper page
  49. 10.1093/bioinformatics/btp033 · DOI

Metadata

Authors
Wang, Y., Chen, X., Kong, X., Chen, Y., Xiang, Z., Xiang, Y., Hu, Y., Hou, Y., Zhou, S., Shen, C., Mu, L., Su, D., & Zhang, R.
Affiliations
Sichuan University (CN)
Corresponding author
Zhang, Rundong
Venue
Nature Communications
Publisher
openRxiv
Published
2024-07-10
Volume
16
Issue
1
Pages
3166-3166
ISSN
2041-1723 (ISSN-L)
OpenAlex
W4409148881
Cited by
7
References
1
Citations by year
2026: 4 · 2025: 3
FWCI
2.09
Type
journal article
Language
en
Open access
Licence
cc-by-nc-nd
Locations
  • Nature Communications (publishedVersion, cc-by-nc-nd)
  • bioRxiv (Cold Spring Harbor Laboratory) (acceptedVersion)
  • PubMed Central (publishedVersion, cc-by-nc-nd)
  • PubMed (publishedVersion)
  • RePEc: Research Papers in Economics (submittedVersion)
  • DOAJ (DOAJ: Directory of Open Access Journals) (submittedVersion, cc-by-sa)
Funders
  • Ministry of Science and Technology of the People's Republic of China (2017YFA0504300, 2017YFA0505900)
  • Department of Science and Technology of Sichuan Province (2020YJ0209)
Topics
  • Life Sciences › Biochemistry, Genetics and Molecular Biology › Molecular Biology › RNA Research and Splicing
  • Life Sciences › Biochemistry, Genetics and Molecular Biology › Molecular Biology › RNA and protein synthesis mechanisms
  • Life Sciences › Biochemistry, Genetics and Molecular Biology › Molecular Biology › Nuclear Structure and Function
Keywords
Sm proteins, SMN complex, spinal muscular atrophy, spliceosome, Saccharomyces cerevisiae, assembly intermediates
MeSH terms
Protein Binding, RNA, Small Nuclear, Saccharomyces cerevisiae, Spliceosomes, Molecular Chaperones, Saccharomyces cerevisiae Proteins, snRNP Core Proteins, SMN Complex Proteins

About these checks

Registry, retraction, Cites and statistics results are computed, not judged, with one exception: a printed reference that no index lists is read once by a model before it counts as a citation error. Claims are extracted by a model and kept only when their quote appears verbatim in the text; each cited source is then checked, with a model’s help, for whether it says what the claim relies on. Those verdicts can be wrong — read the claim’s quote and the cited source before relying on one.

Statistics and arithmetic are recomputed, not judged.

Confidence bands are shown only for fields calibrated on our annotated test set. None is calibrated yet, so no band is shown.

What counts as a claim ›How we measure confidence ›How we check this ›

Are you an author, or do you see a problem with this page? Request a review