PreprintCited by 3Cancer Genomics and DiagnosticsCancer, Hypoxia, and MetabolismEvolution and Genetic Dynamics

The DOI matches its Crossref record; 2 of the 2 references it cites were found in a registry or an index.

Computational investigation of missense somatic mutations in cancer and potential links to pH-dependence and proteostasis

Open access

Preprint — published as 10.1371/journal.pone.0314022

Abstract

Metabolic changes during tumour development lead to acidification of the extracellular environment and a smaller increase of intracellular pH. Searches for somatic missense mutations that could reveal adaptation to altered pH have focussed on arginine to histidine changes, part of a general arginine depletion that originates from DNA mutational mechanisms. Analysis of mutations to histidine, potentially a simple route to the introduction of pH-sensing, shows no clear biophysical separation overall of subsets that are more and less frequently mutated in cancer genomes. Within the more frequently mutated subset, individual sites predicted to mediate pH-dependence upon mutation include NDST1 (a Golgi-resident heparan sulphate modifying enzyme), the HLA-C chain of MHCI complex, and the water channel AQP-7. Arginine depletion is a general feature that persists in the more frequently mutated subset, and is complemented by over-representation of mutations to lysine. Arginine to lysine balance is a known factor in determining protein solubility, with higher lysine content being more favourable. Proteins with greater change in arginine to lysine balance are enriched for cell periphery location, where proteostasis is likely to be challenged in tumour cells. Somatic missense mutations in a cancer genome number only in the 10s typically, although can be much higher. Whether the altered arginine to lysine balance is of sufficient scale to play a role in tumour development is unknown.

Overview

The claims and statistics of this paper haven’t been checked yet.

Run the check — free, no account needed. It reads the open-access text and checks the sources it cites.

A few free checks a day · papers already verified open instantly · results are public

Integrity signals

Registry

Crossref · 10.1101/2024.07.17.603952

Cites

2 of 2 references verified0 citation errors · 0 not checkable

Statistics

Figures

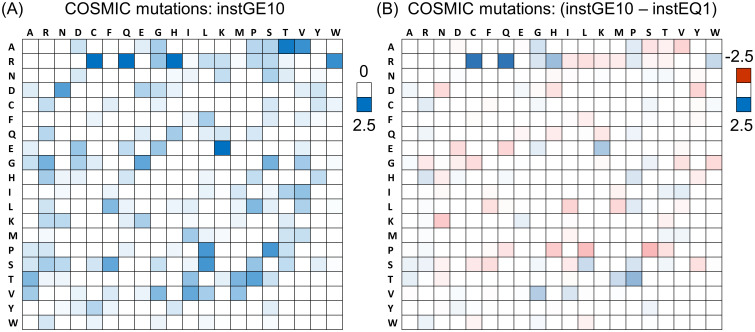
Fig 1 Mutation matrices across cancer types in COSMIC. (A) The percentage distribution of all 20 x 19 missense AA mutations in COSMIC, only for mutations with instances ≥ 10. Wild type AA is listed at the left, and target AA across the top. Summation is to 100% over the entire heat map, and the white to blue colour scale is indicated to the right. (B) Percentage distribution for the instances = 1 subset is subtracted from that for instances ≥ 10, therefore with sum to 0% over the heat map, and with colour scale (red-white-blue) shown to the right.
Fig 1 Mutation matrices across cancer types in COSMIC. (A) The percentage distribution of all 20 x 19 missense AA mutations in COSMIC, only for mutations with instances ≥ 10. Wild type AA is listed at the left, and target AA across the top. Summation is to 100% over the entire heat map, and the white to blue colour scale is indicated to the right. (B) Percentage distribution for the instances = 1 subset is subtracted from that for instances ≥ 10, therefore with sum to 0% over the heat map, and with colour scale (red-white-blue) shown to the right.CC BY · PubMed Central
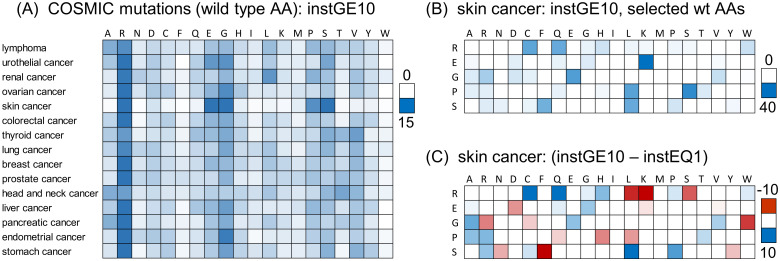
Fig 2 Mutation distributions by cancer type. (A) Percentage distributions by cancer type, for instGE10 data, with the 20 wild type AAs listed across the top, and each row (cancer type) summing to 100%. Percentage scale (white to blue) is shown to the right. (B) Skin cancer, instGE10 data with the 5 most prominent wild type AAs in panel (A) listed on the left. Distributions of mutation to target AAs (listed across the top) are shown for instGE10 data, percentage scale (white to blue) shown to the right. (C) The distributions of panel (B) are differenced with instEQ1 data, with scale of percentages (red-white-blue) on the right.
Fig 2 Mutation distributions by cancer type. (A) Percentage distributions by cancer type, for instGE10 data, with the 20 wild type AAs listed across the top, and each row (cancer type) summing to 100%. Percentage scale (white to blue) is shown to the right. (B) Skin cancer, instGE10 data with the 5 most prominent wild type AAs in panel (A) listed on the left. Distributions of mutation to target AAs (listed across the top) are shown for instGE10 data, percentage scale (white to blue) shown to the right. (C) The distributions of panel (B) are differenced with instEQ1 data, with scale of percentages (red-white-blue) on the right.CC BY · PubMed Central
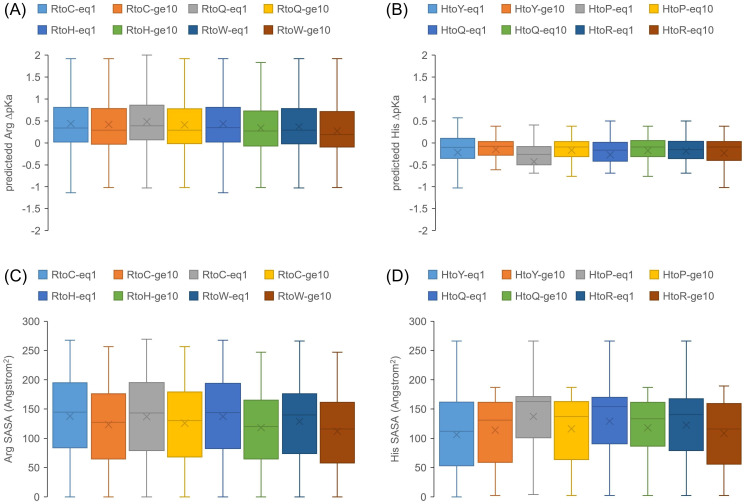
Fig 3 Structure-based SASA and ΔpKa calculations for mutations from Arg and His. The box and whisker plots show quartiles, median (central line), and mean (cross). (A) Distributions of predicted Arg ΔpKas (pkcalc) are shown for instEQ1 and instGE10 mutation data, further divided into the 4 most common target AAs for Arg mutation. Limiting thresholds of +/- 3 are applied for ΔpKa values. (B) Equivalent format ΔpKa data to panel (A) are shown for mutation from His, to its most common target AAs. (C) The ΔpKa data for Arg mutations in panel (A) are replaced with SASA, for the same subsets. (D) His mutation SASA is shown, using the same datasets as for His ΔpKas in panel (B).
Fig 3 Structure-based SASA and ΔpKa calculations for mutations from Arg and His. The box and whisker plots show quartiles, median (central line), and mean (cross). (A) Distributions of predicted Arg ΔpKas (pkcalc) are shown for instEQ1 and instGE10 mutation data, further divided into the 4 most common target AAs for Arg mutation. Limiting thresholds of +/- 3 are applied for ΔpKa values. (B) Equivalent format ΔpKa data to panel (A) are shown for mutation from His, to its most common target AAs. (C) The ΔpKa data for Arg mutations in panel (A) are replaced with SASA, for the same subsets. (D) His mutation SASA is shown, using the same datasets as for His ΔpKas in panel (B).CC BY · PubMed Central
Fig 4 High instance GoF and LoF mutations compared for His target AA. Percentage specificity (see text) for mutations to His within the top 1,000 of all mutations, ranked by instances, in COSMIC.
Fig 4 High instance GoF and LoF mutations compared for His target AA. Percentage specificity (see text) for mutations to His within the top 1,000 of all mutations, ranked by instances, in COSMIC.CC BY · PubMed Central
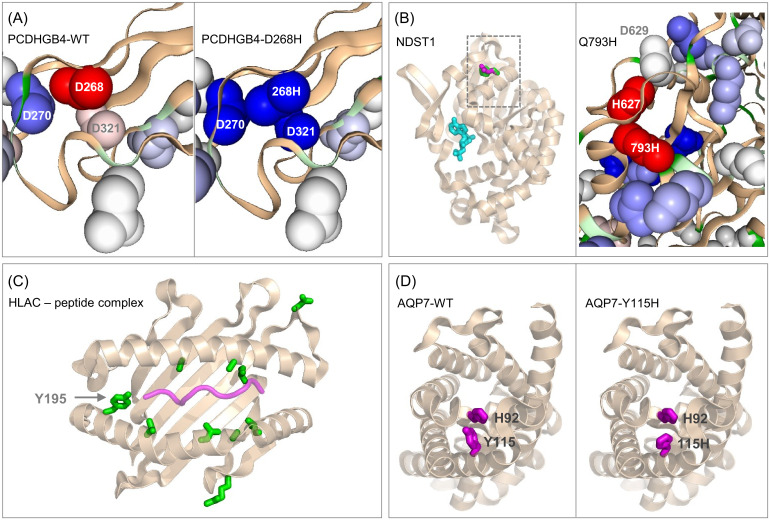
Fig 5 Molecular environments of selected mutations to His. (A) PCDHGB4-D268H: left is a protein-sol image of predicted pKas around the wild type calcium binding site (in the absence of calcium ion), with colour scale by destabilisation (red) through ΔpKa close to zero (white) and stabilisation (red). Right is the equivalent plot for the D268H mutant, with a switch from destabilising at 268 to stabilising. (B) NDST1-Q793H: left is the sulfotransferase domain from a structure of the bifunctional Golgi enzyme (8ccy) [50], with ADP (cyan) marking the active site. Q793 is indicated with a rectangle, and that region expanded on the right, with a protein-sol pKa prediction showing destabilised Q793H and neighbouring H627. (C) HLAC-Y195H: mutation sites (instances ≥ 17 in COSMIC, green) are displayed in the peptide binding domain of structure 6pag [51], with bound peptide shown in purple. Mutations other than Y195H are S48A, L171W, T187M/T187P, A97T, L180R, A176V, L119I, all adjacent to the peptide binding groove, and R155S, D114A in this domain but not adjacent to the peptide binding groove. (D) AQP7-Y115H: left shows wild type Y115 in the AlphaFold2 protomer model, and right the modelled Y115H mutation. In both panels the neighbouring residue H92 is shown.
Fig 5 Molecular environments of selected mutations to His. (A) PCDHGB4-D268H: left is a protein-sol image of predicted pKas around the wild type calcium binding site (in the absence of calcium ion), with colour scale by destabilisation (red) through ΔpKa close to zero (white) and stabilisation (red). Right is the equivalent plot for the D268H mutant, with a switch from destabilising at 268 to stabilising. (B) NDST1-Q793H: left is the sulfotransferase domain from a structure of the bifunctional Golgi enzyme (8ccy) [50], with ADP (cyan) marking the active site. Q793 is indicated with a rectangle, and that region expanded on the right, with a protein-sol pKa prediction showing destabilised Q793H and neighbouring H627. (C) HLAC-Y195H: mutation sites (instances ≥ 17 in COSMIC, green) are displayed in the peptide binding domain of structure 6pag [51], with bound peptide shown in purple. Mutations other than Y195H are S48A, L171W, T187M/T187P, A97T, L180R, A176V, L119I, all adjacent to the peptide binding groove, and R155S, D114A in this domain but not adjacent to the peptide binding groove. (D) AQP7-Y115H: left shows wild type Y115 in the AlphaFold2 protomer model, and right the modelled Y115H mutation. In both panels the neighbouring residue H92 is shown.CC BY · PubMed Central
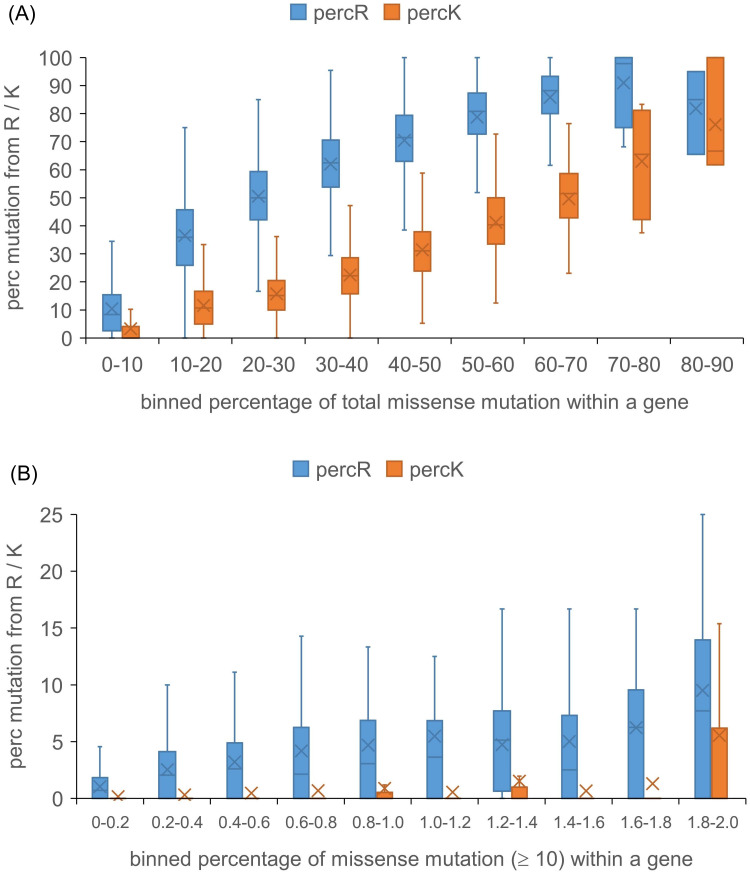
Fig 6 Extent of missense mutation from Arg and Lys in COSMIC compared with overall mutation. Underlying data are the overall percentages of locations in each gene that have mutations recorded in COSMIC, and also those percentages when considering just wild type Arg and Lys sites. The overall percentage data are binned (horizontal axis) and displayed with the Arg or Lys data on the vertical axis. (A) Analysis for all missense mutations in COSMIC. (B) Analysis for sites with ≥ 10 instances in COSMIC.
Fig 6 Extent of missense mutation from Arg and Lys in COSMIC compared with overall mutation. Underlying data are the overall percentages of locations in each gene that have mutations recorded in COSMIC, and also those percentages when considering just wild type Arg and Lys sites. The overall percentage data are binned (horizontal axis) and displayed with the Arg or Lys data on the vertical axis. (A) Analysis for all missense mutations in COSMIC. (B) Analysis for sites with ≥ 10 instances in COSMIC.CC BY · PubMed Central
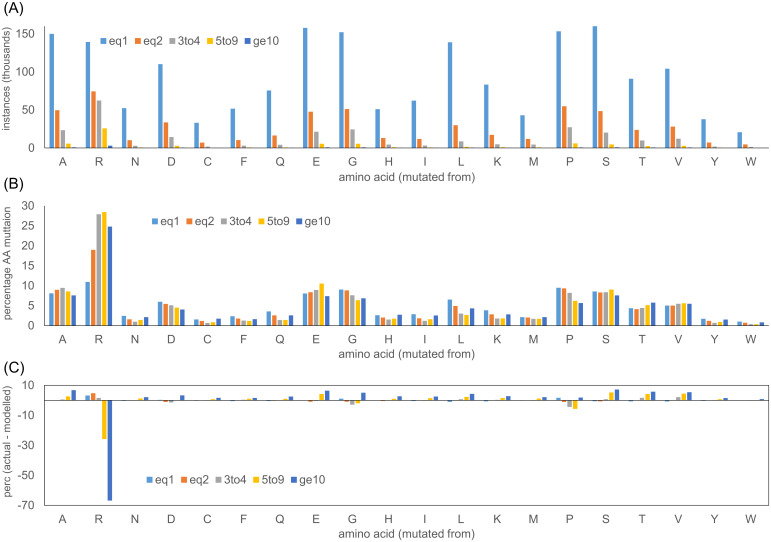
Fig 7 The distribution of missense mutation sites in COSMIC. (A) Numbers of missense mutation sites for the 20 AAs are shown for different ranges of instances recorded in COSMIC. (B) Percentage distributions of missense mutations for the 20 AAs. (C) Percentage distributions, modelled from the frequency of single instance mutations (see Materials and methods), are subtracted from those observed in COSMIC, to estimate the effect of adaptation at higher instances.
Fig 7 The distribution of missense mutation sites in COSMIC. (A) Numbers of missense mutation sites for the 20 AAs are shown for different ranges of instances recorded in COSMIC. (B) Percentage distributions of missense mutations for the 20 AAs. (C) Percentage distributions, modelled from the frequency of single instance mutations (see Materials and methods), are subtracted from those observed in COSMIC, to estimate the effect of adaptation at higher instances.CC BY · PubMed Central
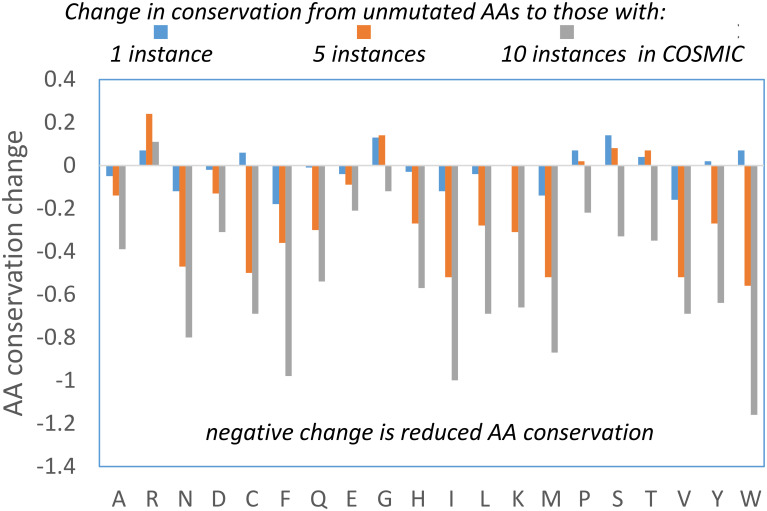
Fig 8 Analysis of AA conservation with increasing COSMIC instances. (A) Change in FIS (representing AA conservation), with the AA values averaged over COSMIC instance populations of missense mutations subtracted from the equivalent averages for AAs at sites that do not appear in COSMIC.
Fig 8 Analysis of AA conservation with increasing COSMIC instances. (A) Change in FIS (representing AA conservation), with the AA values averaged over COSMIC instance populations of missense mutations subtracted from the equivalent averages for AAs at sites that do not appear in COSMIC.CC BY · PubMed Central
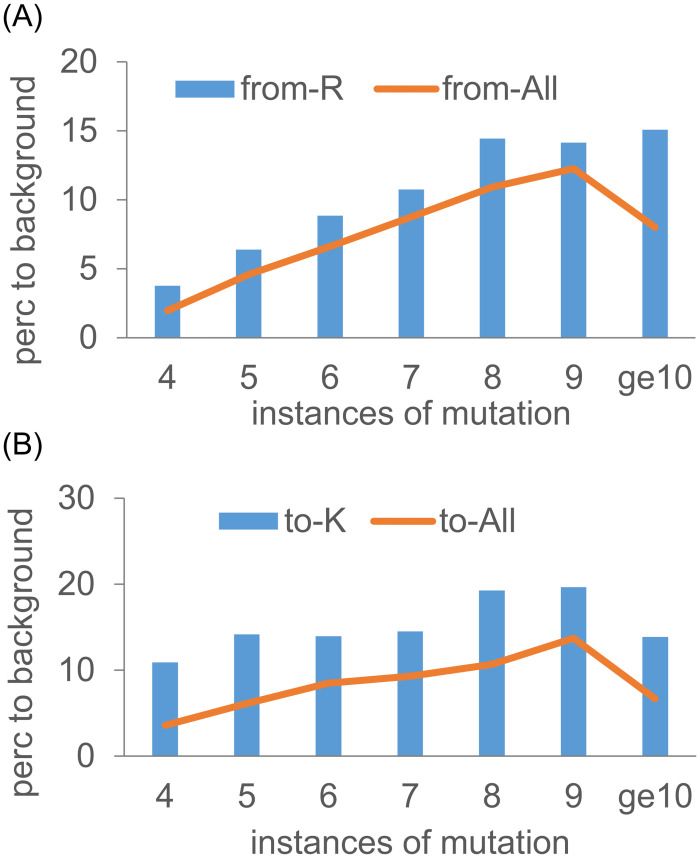
Fig 9 Cell periphery enrichment of proteins with mutations from Arg and to Lys. Percentage enrichments for the GO category of cell periphery are plotted for overall mutation populations and from Arg (A), and to Lys (B) mutations. Results are shown for different numbers of mutation instances in COSMIC.
Fig 9 Cell periphery enrichment of proteins with mutations from Arg and to Lys. Percentage enrichments for the GO category of cell periphery are plotted for overall mutation populations and from Arg (A), and to Lys (B) mutations. Results are shown for different numbers of mutation instances in COSMIC.CC BY · PubMed Central

Verification

Claims the paper makes

The claims and statistics of this paper haven’t been checked yet.

Run the check — free, no account needed. It reads the open-access text and checks the sources it cites.

A few free checks a day · papers already verified open instantly · results are public

Self-check

Percentages, sums and reported differences re-computed from the paper’s own numbers.

The self-check needs the paper’s full text.

Citations

Cites

Research works printed but not linked: 78

  1. 10.1038/nrc.2017.77 · DOI
  2. 10.1038/nrc3366 · DOI
  3. 10.1098/rstb.2013.0098 · DOI
  4. 10.1038/s41568-023-00628-9 · DOI
  5. 10.1007/s00424-023-02876-y · DOI
  6. 10.1016/j.it.2023.08.008 · DOI
  7. 10.1039/c8ra02095g · DOI
  8. 10.1158/0008-5472.CAN-18-1604 · DOI
  9. 10.1146/annurev-biophys-050511-102349 · DOI
  10. 10.1093/nar/gkad986 · DOI
  11. 10.1016/j.bbadis.2015.11.006 · DOI
  12. 10.1371/journal.pone.0183273 · DOI
  13. 10.3390/biom7030049 · DOI
  14. 10.3390/cancers13246274 · DOI
  15. 10.1126/scisignal.aam9931 · DOI
  16. 10.1021/acs.biochem.1c00059 · DOI
  17. 10.1083/jcb.201712041 · DOI
  18. 10.1021/ct100578z · DOI
  19. 10.1093/bioinformatics/btaa646 · DOI
  20. 10.1038/s41598-017-15997-z · DOI
  21. 10.1016/j.sbi.2022.102498 · DOI
  22. 10.1021/acs.jcim.3c00165 · DOI
  23. 10.1110/ps.04785604 · DOI
  24. 10.3389/fmolb.2022.834011 · DOI
  25. 10.1093/nar/gky1049 · DOI · Paper page
  26. 10.1126/science.1260419 · DOI · Paper page
  27. 10.1093/nar/gkr407 · DOI
  28. 10.1093/bioinformatics/bth456 · DOI · Paper page
  29. 10.1002/elps.1150181505 · DOI
  30. 10.1002/pro.4769 · DOI
  31. 10.1002/path.5912 · DOI
  32. 10.1111/php.12377 · DOI · Paper page
  33. 10.3389/fgene.2012.00330 · DOI
  34. 10.1186/s13073-023-01261-9 · DOI · Paper page
  35. 10.1042/BST20210277 · DOI
  36. 10.1016/S0065-230X(06)97001-8 · DOI
  37. 10.1186/s13059-015-0864-1 · DOI
  38. 10.1016/bs.ctdb.2021.12.006 · DOI
  39. 10.1038/s41586-019-1089-3 · DOI · Paper page
  40. 10.7554/eLife.20930 · DOI
  41. 10.1038/s41467-024-45419-4 · DOI
  42. 10.1038/s41467-021-22359-x · DOI
  43. 10.3389/fgene.2021.736156 · DOI
  44. 10.3727/096504018X15478559215014 · DOI
  45. 10.3389/fcell.2019.00093 · DOI
  46. 10.26355/eurrev_201907_18443 · DOI
  47. 10.3390/ijms23084157 · DOI
  48. 10.2174/138161212799504821 · DOI
  49. 10.3389/fonc.2022.943806 · DOI
  50. 10.1016/j.str.2019.11.011 · DOI
  51. 10.1038/s41467-018-07176-z · DOI
  52. 10.1038/nature10370 · DOI
  53. 10.1038/s41467-023-40058-7 · DOI
  54. 10.1042/BCJ20200311 · DOI
  55. 10.7554/eLife.29002 · DOI
  56. 10.1083/jcb.201302131 · DOI
  57. 10.1074/jbc.M116.736215 · DOI
  58. 10.1007/s12032-009-9343-4 · DOI
  59. 10.1073/pnas.1209312109 · DOI
  60. 10.1038/s41586-023-06328-6 · DOI · Paper page
  61. 10.1021/mp4004749 · DOI
  62. 10.1093/bioinformatics/btx345 · DOI
  63. 10.3389/fcell.2023.1143532 · DOI
  64. 10.1007/978-1-4939-3756-1_2 · DOI
  65. 10.3390/cells11162556 · DOI
  66. 10.1016/j.tcb.2015.10.011 · DOI
  67. 10.1073/pnas.1910444117 · DOI
  68. 10.1016/j.ygeno.2018.05.013 · DOI
  69. 10.6061/clinics/2021/e2052 · DOI
  70. 10.1016/j.csbj.2021.02.012 · DOI
  71. 10.1007/s00232-011-9381-7 · DOI
  72. 10.1038/s41467-019-10920-8 · DOI
  73. 10.1038/s41467-023-36496-y · DOI
  74. 10.3390/membranes12040393 · DOI
  75. 10.1126/science.aab4082 · DOI · Paper page
  76. 10.3390/cancers12102760 · DOI
  77. 10.1016/j.xphs.2022.10.009 · DOI
  78. 10.1016/j.celrep.2023.112601 · DOI

Metadata

Authors
Sallah, S., & Warwicker, J.
Affiliations
University of Manchester (GB)
Corresponding author
Warwicker, Jim
Venue
PLoS ONE
Publisher
openRxiv
Published
2024-07-19
Volume
19
Issue
11
Pages
e0314022-e0314022
ISSN
1932-6203 (ISSN-L)
OpenAlex
W4404522313
Cited by
3
References
2
Citations by year
2025: 3
FWCI
0.60
Type
journal article
Language
en
Open access
Licence
cc-by
Locations
  • PLoS ONE (publishedVersion, cc-by)
  • bioRxiv (Cold Spring Harbor Laboratory) (acceptedVersion, cc-by)
  • PubMed Central (publishedVersion, cc-by)
  • PubMed (publishedVersion)
  • DOAJ (DOAJ: Directory of Open Access Journals) (submittedVersion, cc-by-sa)
  • Research Explorer (The University of Manchester) (submittedVersion, cc-by)
Funders
  • Directorate for Biological Sciences
  • Biotechnology and Biological Sciences Research Council (BB/V006592/1, BB/V0065921/1)
Topics
  • Life Sciences › Biochemistry, Genetics and Molecular Biology › Cancer Research › Cancer Genomics and Diagnostics
  • Life Sciences › Biochemistry, Genetics and Molecular Biology › Cancer Research › Cancer, Hypoxia, and Metabolism
  • Life Sciences › Biochemistry, Genetics and Molecular Biology › Genetics › Evolution and Genetic Dynamics
Keywords
somatic missense mutations, cancer, extracellular pH, intracellular pH, arginine deprivation, histidine mutations, lysine mutations, protein solubility, proteostasis, pH sensing, NDST1, HLA-C, AQP7, Golgi apparatus, tumor microenvironment
MeSH terms
Proteostasis, Arginine, Histidine, Humans, Hydrogen-Ion Concentration, Lysine, Neoplasms, Computational Biology, Mutation, Missense

About these checks

Registry, retraction, Cites and statistics results are computed, not judged, with one exception: a printed reference that no index lists is read once by a model before it counts as a citation error. Claims are extracted by a model and kept only when their quote appears verbatim in the text; each cited source is then checked, with a model’s help, for whether it says what the claim relies on. Those verdicts can be wrong — read the claim’s quote and the cited source before relying on one.

Statistics and arithmetic are recomputed, not judged.

Confidence bands are shown only for fields calibrated on our annotated test set. None is calibrated yet, so no band is shown.

What counts as a claim ›How we measure confidence ›How we check this ›

Are you an author, or do you see a problem with this page? Request a review