PreprintCited by 39Influenza Virus Research Studiesvaccines and immunoinformatics approachesMonoclonal and Polyclonal Antibodies Research

The DOI matches its Crossref record; 1 of the 1 references it cites were found in a registry or an index.

Influenza A Virus H7 nanobody recognizes a conserved immunodominant epitope on hemagglutinin head and confers heterosubtypic protection

Open access

Preprint — published as 10.1038/s41467-024-55193-y · Paper page

Abstract

Influenza remains a persistent global health challenge, largely due to the virus’ continuous antigenic drift and shift, which impede the development of a universal vaccine. To address this, the identification of broadly neutralizing antibodies and their epitopes is crucial. Nanobodies, with their unique characteristics and binding capacity, offer a promising avenue to identify such epitopes. Here, we isolated and purified a hemagglutinin (HA)-specific nanobody that recognizes an H7 subtype of influenza A virus. Notably, the nanobody, named E10, exhibited broad-spectrum binding, cross-group neutralization and in vivo protection across various influenza A subtypes. Through phage display and in vitro characterization, we demonstrated that E10 specifically targets an epitope on HA head. This epitope is part of the conserved lateral patch of HA head and proved to be highly immunodominant upon H7 infection. Importantly, immunization with a peptide including the E10 epitope elicited cross-reactive antibodies and mediated partial protection from lethal viral challenge. Our data highlight the potential of E10 and its associated epitope as a candidate for future influenza prevention strategies.

Overview

The claims and statistics of this paper haven’t been checked yet.

Run the check — free, no account needed. It reads the open-access text and checks the sources it cites.

A few free checks a day · papers already verified open instantly · results are public

Integrity signals

Registry

Crossref · 10.1101/2024.10.31.621368

Cites

1 of 1 references verified0 citation errors · 0 not checkable

Statistics

Figures

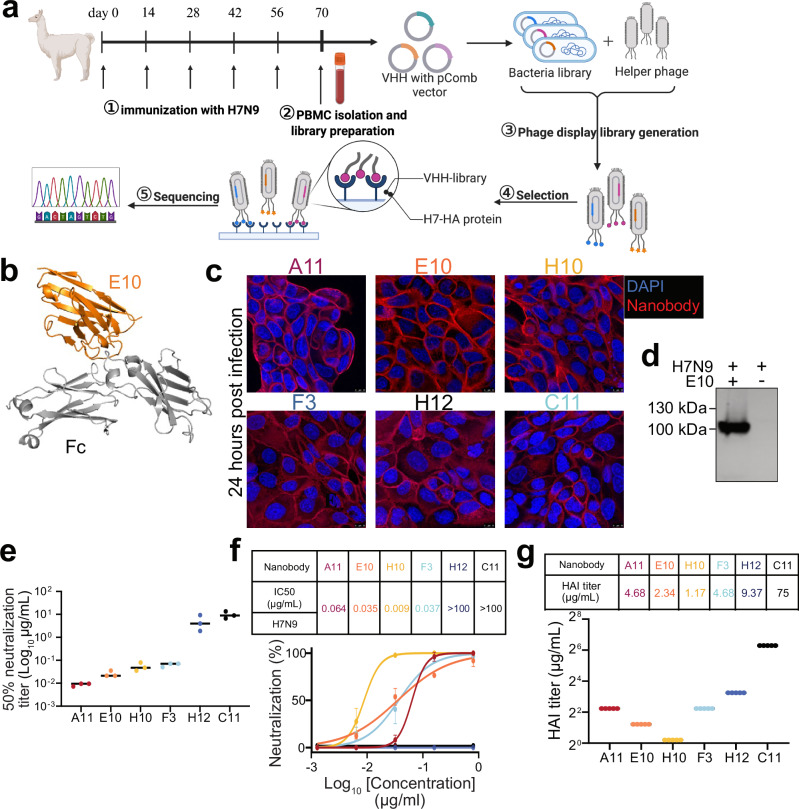
Fig. 1 Generation and characterization of H7-specific nanobodies. a Schematic illustration of alpaca immunization process and subsequent nanobody selection. Alpacas were immunized with the H7N9 virus, and after four boosts, peripheral blood mononuclear cells (PBMCs) were collected to generate a phage display library. Created with BioRender.com. b Structural model of a nanobody-Fc created using ImmuneBuilder and AlphaFold 2. (Nanobody: orange. Fc tags: gray). c Immunofluorescence assay (IFA) showing the recognition of SZ19 H7N9 virus by different nanobodies. A549 cells were infected with SZ19 (MOI = 0.1) for 24 h and stained with primary nanobodies, followed by secondary goat anti-human IgG Fc Alexa Fluor™ 488 (A11: red, E10: orange, H10: yellow, F3: blue, H12: dark blue, C11: black.). Scale bar, 10 μm. d Western blot (WB) analysis of A549 cells infected with SZ19 H7N9 (MOI = 1) for 24 h. Cell lysate was probed with respective nanobodies and detected using goat anti-human IgG-Fc HRP. Data are representative of at least two independent experiments. e Graph showing 50% neutralization endpoint (NC50) of different nanobodies against the SZ19 H7N9 virus. Virus was incubated with serially diluted nanobodies before cell infection. After 72 h, viral replication was measured by the ability of supernatant to hemagglutinate red blood cells (RBCs). Data are representative of at least two independent experiments. Shown are the mean values of three replicates. f Neutralization assay results for the nanobodies on SZ19 H7N9 virus using a cell-based ELISA. Half-maximal inhibitory concentrations (IC50) are shown for each nanobody. Data represent the mean values ± SD from four technical replicates of three independent experiments. g Hemagglutination inhibition assay (HAI) with the nanobodies against SZ19 H7N9 virus (A11: red, E10: orange, H10: yellow, F3: blue, H12: dark blue, C11: black.). HI titer shown as µg/mL. Data are the average of three independent experiments.
Fig. 1 Generation and characterization of H7-specific nanobodies. a Schematic illustration of alpaca immunization process and subsequent nanobody selection. Alpacas were immunized with the H7N9 virus, and after four boosts, peripheral blood mononuclear cells (PBMCs) were collected to generate a phage display library. Created with BioRender.com. b Structural model of a nanobody-Fc created using ImmuneBuilder and AlphaFold 2. (Nanobody: orange. Fc tags: gray). c Immunofluorescence assay (IFA) showing the recognition of SZ19 H7N9 virus by different nanobodies. A549 cells were infected with SZ19 (MOI = 0.1) for 24 h and stained with primary nanobodies, followed by secondary goat anti-human IgG Fc Alexa Fluor™ 488 (A11: red, E10: orange, H10: yellow, F3: blue, H12: dark blue, C11: black.). Scale bar, 10 μm. d Western blot (WB) analysis of A549 cells infected with SZ19 H7N9 (MOI = 1) for 24 h. Cell lysate was probed with respective nanobodies and detected using goat anti-human IgG-Fc HRP. Data are representative of at least two independent experiments. e Graph showing 50% neutralization endpoint (NC50) of different nanobodies against the SZ19 H7N9 virus. Virus was incubated with serially diluted nanobodies before cell infection. After 72 h, viral replication was measured by the ability of supernatant to hemagglutinate red blood cells (RBCs). Data are representative of at least two independent experiments. Shown are the mean values of three replicates. f Neutralization assay results for the nanobodies on SZ19 H7N9 virus using a cell-based ELISA. Half-maximal inhibitory concentrations (IC50) are shown for each nanobody. Data represent the mean values ± SD from four technical replicates of three independent experiments. g Hemagglutination inhibition assay (HAI) with the nanobodies against SZ19 H7N9 virus (A11: red, E10: orange, H10: yellow, F3: blue, H12: dark blue, C11: black.). HI titer shown as µg/mL. Data are the average of three independent experiments.CC BY · PubMed Central
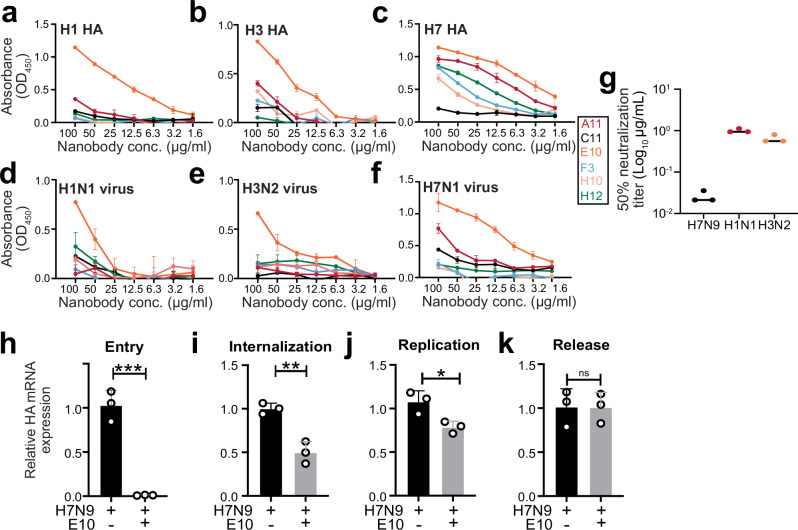
Fig. 2 Nanobody E10 exhibits cross-group binding breadth and neutralization capacity. a–f ELISA binding curves showing the interaction of six nanobodies with HA protein from various influenza strains (H7, H1, and H3) and UV-inactivated influenza viruses (H7N1, H1N1, and H3N2). Each curve represents a different nanobody, color-coded for clarity. Data are presented as mean ± SD. Experiment was performed three times. g Neutralization efficacy of nanobody E10 against different subtypes of influenza A virus (H1N1 and H3N2). Neutralization of SZ19 H7N9 from Fig. 1e is shown for comparison. Data are representative of at least two independent experiments. Shown are the mean values of three technical replicates. h–k Evaluation of E10’s effect on different stages of the viral infection process using SZ19 H7N9 virus (MOI = 10) at various time points. Bars represent the mean HA gene expression levels measured by qPCR ± SD. Data from three technical replicates. Statistical significance was determined using two-sided unpaired t-test: *p = 0.025; **p = 0.0035; ***p = 0.0005; ns not significant.
Fig. 2 Nanobody E10 exhibits cross-group binding breadth and neutralization capacity. a–f ELISA binding curves showing the interaction of six nanobodies with HA protein from various influenza strains (H7, H1, and H3) and UV-inactivated influenza viruses (H7N1, H1N1, and H3N2). Each curve represents a different nanobody, color-coded for clarity. Data are presented as mean ± SD. Experiment was performed three times. g Neutralization efficacy of nanobody E10 against different subtypes of influenza A virus (H1N1 and H3N2). Neutralization of SZ19 H7N9 from Fig. 1e is shown for comparison. Data are representative of at least two independent experiments. Shown are the mean values of three technical replicates. h–k Evaluation of E10’s effect on different stages of the viral infection process using SZ19 H7N9 virus (MOI = 10) at various time points. Bars represent the mean HA gene expression levels measured by qPCR ± SD. Data from three technical replicates. Statistical significance was determined using two-sided unpaired t-test: *p = 0.025; **p = 0.0035; ***p = 0.0005; ns not significant.CC BY · PubMed Central
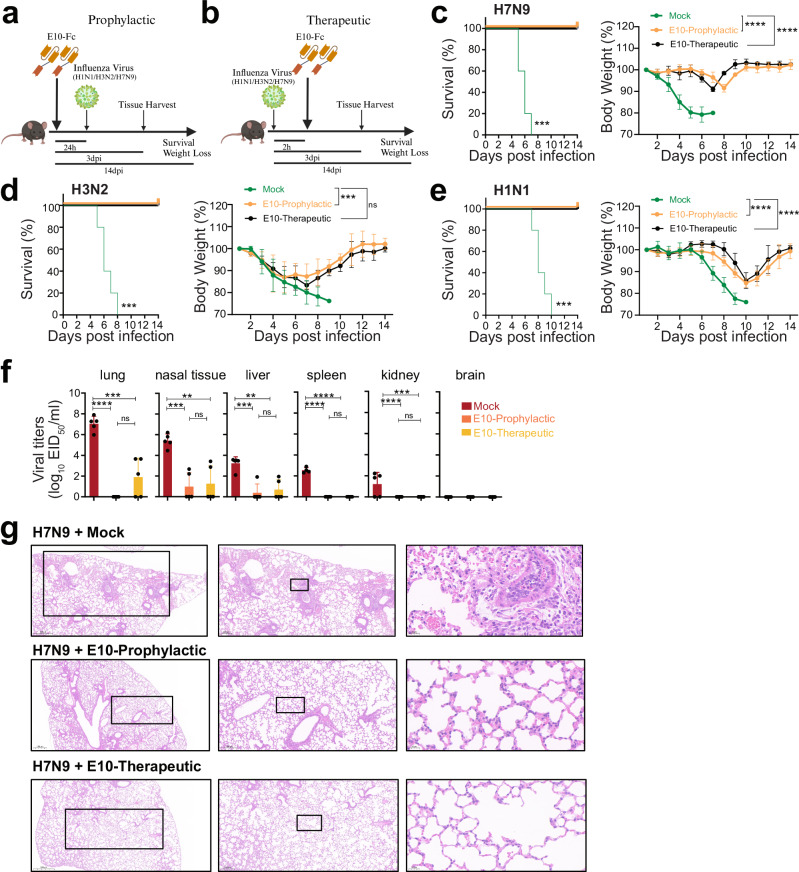
Fig. 3 E10 treatment protects mice against homo- and heterosubtypic IAV challenge. a, b Schematic representation of the experimental design for in vivo studies. Mice were treated with either E10-Fc or PBS intraperitoneally (i.p.), followed by influenza virus infection (H1N1, H3N2 or H7N9), as outlined. Created with BioRender.com. c–e Kaplan–Meier survival curve and body weight monitoring of influenza-infected mice. Mice were treated with E10-Fc or PBS as prophylaxis or therapy i.p and weight monitored for 14 days after infection with H1N1 (3 × 10³ TCID50, lethal dose)/H3N2 (107 TCID50, lethal dose)/or H7N9 (106 EID50, lethal dose). Statistical significance of the Kaplan–Meier survival curves was calculated by log rank Mantel–Cox test. (H7N9 ***p = 0.0002; H3N2 ***p = 0.0001; H1N1 ***p = 0.0001). Weight change data are represented as mean ± SEM from three independent experiments (n = 15 per group). Statistical analysis was performed using two-way ANOVA: ***p = 0.0009; ****p < 0.0001, ns not significant. f Viral titer, measured by EID50, in six organs (lungs, nasal tissue, liver, spleen, kidney, brain) on day 3 post-SZ19 H7N9 infection, with or without E10 treatment, as described in (a, b). Data are representative of three independent experiments and shown as mean values from three technical replicates. Statistical analysis was performed using two-sided unpaired t-test. *p < 0.05; **p < 0.01; ***p < 0.01; ****p < 0.0001; ns not significant. g Representative histopathological analysis of lungs from mice on day 3 after H7N9 infection with or without E10, or MOCK treatment, as outlined in (a, b). Scale bar, 500 μm (left), 200 μm (middle), 20 μm (right).
Fig. 3 E10 treatment protects mice against homo- and heterosubtypic IAV challenge. a, b Schematic representation of the experimental design for in vivo studies. Mice were treated with either E10-Fc or PBS intraperitoneally (i.p.), followed by influenza virus infection (H1N1, H3N2 or H7N9), as outlined. Created with BioRender.com. c–e Kaplan–Meier survival curve and body weight monitoring of influenza-infected mice. Mice were treated with E10-Fc or PBS as prophylaxis or therapy i.p and weight monitored for 14 days after infection with H1N1 (3 × 10³ TCID50, lethal dose)/H3N2 (107 TCID50, lethal dose)/or H7N9 (106 EID50, lethal dose). Statistical significance of the Kaplan–Meier survival curves was calculated by log rank Mantel–Cox test. (H7N9 ***p = 0.0002; H3N2 ***p = 0.0001; H1N1 ***p = 0.0001). Weight change data are represented as mean ± SEM from three independent experiments (n = 15 per group). Statistical analysis was performed using two-way ANOVA: ***p = 0.0009; ****p < 0.0001, ns not significant. f Viral titer, measured by EID50, in six organs (lungs, nasal tissue, liver, spleen, kidney, brain) on day 3 post-SZ19 H7N9 infection, with or without E10 treatment, as described in (a, b). Data are representative of three independent experiments and shown as mean values from three technical replicates. Statistical analysis was performed using two-sided unpaired t-test. *p < 0.05; **p < 0.01; ***p < 0.01; ****p < 0.0001; ns not significant. g Representative histopathological analysis of lungs from mice on day 3 after H7N9 infection with or without E10, or MOCK treatment, as outlined in (a, b). Scale bar, 500 μm (left), 200 μm (middle), 20 μm (right).CC BY · PubMed Central
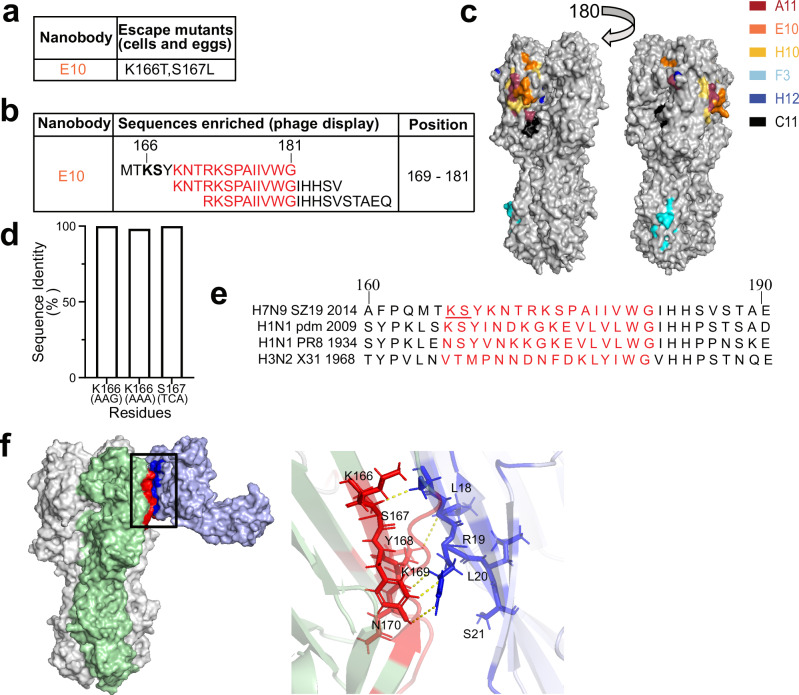
Fig. 4 E10 recognizes a conserved epitope located on HA-head lateral patch. a E10 escape mutations in the H7N9 virus were identified using SPF eggs and MDCK cells. Variations at key residues involved in nanobody escape are highlighted, showing the sites where resistance developed. b Phage display selection of E10 nanobody identified specific peptides. The red region depicts the overlapping area among recognized peptides. The bolded region corresponds to the epitope identified through escape mutations, which overlap with key binding residues. c Epitope mapping of the nanobodies on SZ19 H7N9 HA protein showing the binding sites of six different nanobodies, each labeled with distinct colors (A11: red, E10: orange, H10: yellow, F3: blue, H12: dark blue, C11: black). The head domain of SZ19 H7 HA was modeled using Swiss-Model. Images were generated using Open-Source PyMOL version 2.5.0. d Quantitative analysis of amino acid substitutions at positions 166 and 167 across all H7N9 strains in the GISAID database. e Amino acid sequences flanking the E10 epitope are compared across various IAV strains, including A/Environment/Suzhou/SZ19/2014 (H7N9), A/California/07/2009 (H1N1 Pandemic), A/Puerto Rico/8/1934 (PR8, H1N1), and A/Hong Kong/1968 (X31, H3N2). Putative E10 epitope is highlighted in red, with the mutations selected by E10, at positions 166 and 167, underlined. f Three-dimensional (3D) model analysis of intramolecular interactions between E10-Fc and H7N9-HA obtained using ClusPro 2.084,85. On the left, the HA trimer with two subunits in white and one in green; on the right, the modeled E10-Fc in light blue. The red area on HA is the interaction area, according to the model, while in dark blue is the interaction area on the nanobody. The black box indicates the area that is enlarged on the left side.
Fig. 4 E10 recognizes a conserved epitope located on HA-head lateral patch. a E10 escape mutations in the H7N9 virus were identified using SPF eggs and MDCK cells. Variations at key residues involved in nanobody escape are highlighted, showing the sites where resistance developed. b Phage display selection of E10 nanobody identified specific peptides. The red region depicts the overlapping area among recognized peptides. The bolded region corresponds to the epitope identified through escape mutations, which overlap with key binding residues. c Epitope mapping of the nanobodies on SZ19 H7N9 HA protein showing the binding sites of six different nanobodies, each labeled with distinct colors (A11: red, E10: orange, H10: yellow, F3: blue, H12: dark blue, C11: black). The head domain of SZ19 H7 HA was modeled using Swiss-Model. Images were generated using Open-Source PyMOL version 2.5.0. d Quantitative analysis of amino acid substitutions at positions 166 and 167 across all H7N9 strains in the GISAID database. e Amino acid sequences flanking the E10 epitope are compared across various IAV strains, including A/Environment/Suzhou/SZ19/2014 (H7N9), A/California/07/2009 (H1N1 Pandemic), A/Puerto Rico/8/1934 (PR8, H1N1), and A/Hong Kong/1968 (X31, H3N2). Putative E10 epitope is highlighted in red, with the mutations selected by E10, at positions 166 and 167, underlined. f Three-dimensional (3D) model analysis of intramolecular interactions between E10-Fc and H7N9-HA obtained using ClusPro 2.084,85. On the left, the HA trimer with two subunits in white and one in green; on the right, the modeled E10-Fc in light blue. The red area on HA is the interaction area, according to the model, while in dark blue is the interaction area on the nanobody. The black box indicates the area that is enlarged on the left side.CC BY · PubMed Central
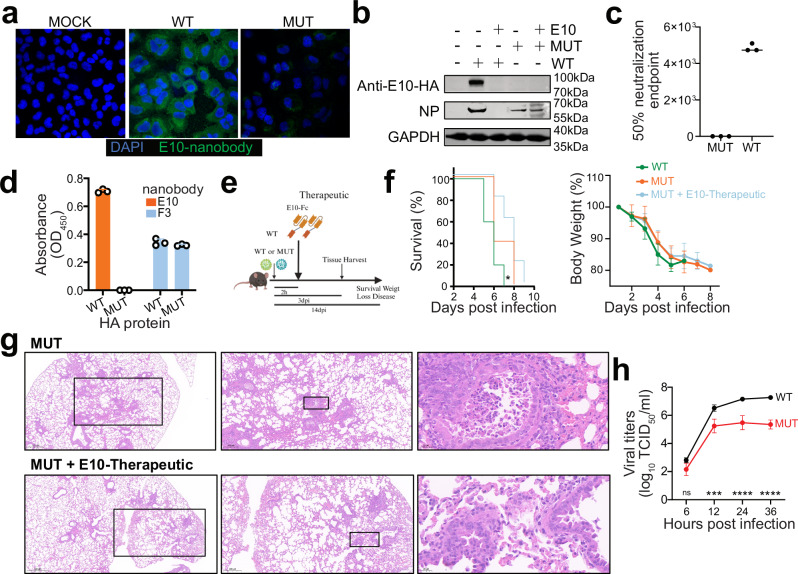
Fig. 5 H7-HAK166T, S167L double mutant escapes E10 recognition but has lower viral fitness. a IFA of A549 infected with wild-type (WT) or mutant (MUT) H7N9 virus (MOI = 0.1) at 24 h post-infection. Cell was stained with E10 as the primary antibody, followed by secondary goat anti-human IgG Fc Alexa Fluor™ 488. Nuclei were counterstained with DAPI (blue), and NP nanobody detection is shown in green. Data are representative of at least two independent experiments. b WB analysis of A549 cells infected with WT or MUT H7N9 viruses, with or without E10 pre-incubation, showing detection of NP and E10. Data are representative of at least two independent experiments. c Graph showing the 50% neutralization endpoint of E10 against WT and MUT viruses, measured by the ability of virus progeny to hemagglutinate red blood cells (RBCs). Data are representative of at least two independent experiments. Shown are the mean values of three technical replicates. d ELISA detection of WT-HA and MUT-HA hemagglutinin (HA) by E10 and F3 nanobodies. Bars represent mean ± SD. Data are representative of at least two independent experiments. Shown are the mean values of three technical replicates. e Experimental setup for the studies shown in (f, g). Created with BioRender.com. f Kaplan–Meier survival curve and body weight analysis of influenza-infected animals. Mice were treated intraperitoneally (i.p.) with either E10-Fc or PBS, as depicted in (e), and their weight was monitored for 14 days following infection with WT (106 EID50, lethal dose) or MUT virus (106 EID50). The statistical significance was calculated by log rank Mantel–Cox test for survival curve, p = 0.04. Weight change was monitored, and each graph is three experiments; n = 15; symbols represent means ± SEM. g Representative histopathological analysis of mouse lungs at day 3 post-infection with MUT virus, with or without E10 administration as outlined in (e). Scale bar, 500 μm in the left row, 200 μm in the middle row, 20 μm in the right row. h Growth kinetics of WT and MUT viruses in MDCK cells. Supernatants were collected at 6-, 12-, 24-, and 36-h post-infection (MOI = 0.001) and titrated by TCID50. Virus titers are presented as mean ± SD from three independent experiments. ***p = 0.001, ****p < 0.0001 (two-way ANOVA followed by Sidak test).
Fig. 5 H7-HAK166T, S167L double mutant escapes E10 recognition but has lower viral fitness. a IFA of A549 infected with wild-type (WT) or mutant (MUT) H7N9 virus (MOI = 0.1) at 24 h post-infection. Cell was stained with E10 as the primary antibody, followed by secondary goat anti-human IgG Fc Alexa Fluor™ 488. Nuclei were counterstained with DAPI (blue), and NP nanobody detection is shown in green. Data are representative of at least two independent experiments. b WB analysis of A549 cells infected with WT or MUT H7N9 viruses, with or without E10 pre-incubation, showing detection of NP and E10. Data are representative of at least two independent experiments. c Graph showing the 50% neutralization endpoint of E10 against WT and MUT viruses, measured by the ability of virus progeny to hemagglutinate red blood cells (RBCs). Data are representative of at least two independent experiments. Shown are the mean values of three technical replicates. d ELISA detection of WT-HA and MUT-HA hemagglutinin (HA) by E10 and F3 nanobodies. Bars represent mean ± SD. Data are representative of at least two independent experiments. Shown are the mean values of three technical replicates. e Experimental setup for the studies shown in (f, g). Created with BioRender.com. f Kaplan–Meier survival curve and body weight analysis of influenza-infected animals. Mice were treated intraperitoneally (i.p.) with either E10-Fc or PBS, as depicted in (e), and their weight was monitored for 14 days following infection with WT (106 EID50, lethal dose) or MUT virus (106 EID50). The statistical significance was calculated by log rank Mantel–Cox test for survival curve, p = 0.04. Weight change was monitored, and each graph is three experiments; n = 15; symbols represent means ± SEM. g Representative histopathological analysis of mouse lungs at day 3 post-infection with MUT virus, with or without E10 administration as outlined in (e). Scale bar, 500 μm in the left row, 200 μm in the middle row, 20 μm in the right row. h Growth kinetics of WT and MUT viruses in MDCK cells. Supernatants were collected at 6-, 12-, 24-, and 36-h post-infection (MOI = 0.001) and titrated by TCID50. Virus titers are presented as mean ± SD from three independent experiments. ***p = 0.001, ****p < 0.0001 (two-way ANOVA followed by Sidak test).CC BY · PubMed Central
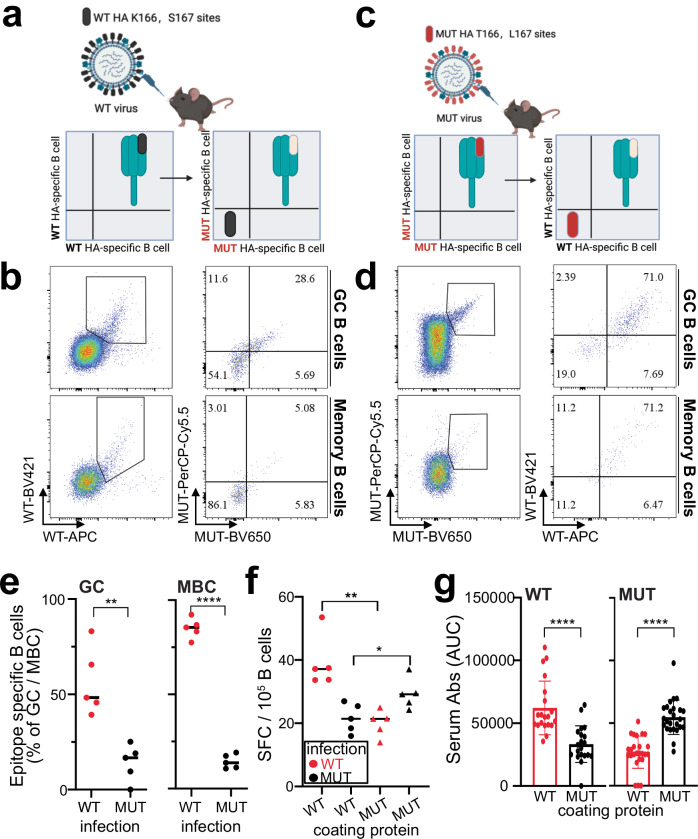
Fig. 6 E10-epitope is immunodominant upon H7-IAV infection. a, c Schematic illustration of epitope identification by flow cytometry. Created with BioRender.com. b Representative flow cytometry gating of GC and MBC for epitope identification in mln of WT-infected mice 14 days post-infection. GC B cells were gated as live CD3− B220+ IgD− IgM− GL7+ CD38−, MBC as live CD3− B220+ IgD− IgM− GL7− CD38+. d Same as in (b) but for MUT-infected mice. e Quantification of epitope-specific MBC and GC B cells in mln of WT- and MUT-infected mice at 14 days post-infection. Two independent experiments with 5 mice each. Bars represent SEM; statistical analysis was performed using two-sided unpaired t-test. **p = 0.0016, ****p < 0.0001. f Quantification of ASC by ELISPOT, plates were coated with WT-HA and MUT-HA, and ASC were quantified in mln of WT vs. MUT infected mice. Spot-forming cells were normalized to 106 cells. Data from five mice per group. Bars represent SEM, statistical analysis was performed using two-sided unpaired t-test. *p = 0.034, **p = 0.0017. g Serum reactivity to WT-HA and MUT-HA in WT- and MUT-infected mice at 14 days post infection. Area under the curve (AUC) quantification is depicted. Data represent four independent experiments with five mice each (n = 20). Bars represent mean ± SEM; statistical analysis was performed using a two-sided unpaired t-test. ****p < 0.0001.
Fig. 6 E10-epitope is immunodominant upon H7-IAV infection. a, c Schematic illustration of epitope identification by flow cytometry. Created with BioRender.com. b Representative flow cytometry gating of GC and MBC for epitope identification in mln of WT-infected mice 14 days post-infection. GC B cells were gated as live CD3− B220+ IgD− IgM− GL7+ CD38−, MBC as live CD3− B220+ IgD− IgM− GL7− CD38+. d Same as in (b) but for MUT-infected mice. e Quantification of epitope-specific MBC and GC B cells in mln of WT- and MUT-infected mice at 14 days post-infection. Two independent experiments with 5 mice each. Bars represent SEM; statistical analysis was performed using two-sided unpaired t-test. **p = 0.0016, ****p < 0.0001. f Quantification of ASC by ELISPOT, plates were coated with WT-HA and MUT-HA, and ASC were quantified in mln of WT vs. MUT infected mice. Spot-forming cells were normalized to 106 cells. Data from five mice per group. Bars represent SEM, statistical analysis was performed using two-sided unpaired t-test. *p = 0.034, **p = 0.0017. g Serum reactivity to WT-HA and MUT-HA in WT- and MUT-infected mice at 14 days post infection. Area under the curve (AUC) quantification is depicted. Data represent four independent experiments with five mice each (n = 20). Bars represent mean ± SEM; statistical analysis was performed using a two-sided unpaired t-test. ****p < 0.0001.CC BY · PubMed Central
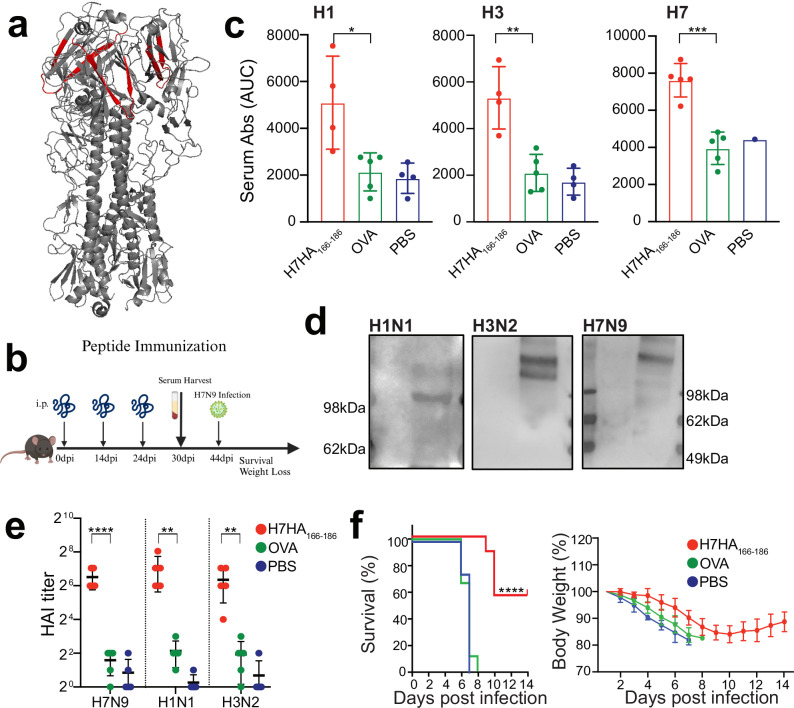
Fig. 7 H7HA166-186 peptide immunization confers partial protection from lethal H7N9 infection. a Schematic illustration of H7-HA166-186 peptide localization (shown in red) within the HA protein timer (gray). b Schematic timeline of peptide immunization protocol. Created with BioRender.com. c Serum binding analysis to H1, H3 and H7 HA proteins from mice immunized with H7HA166-186 peptide, OVA peptide and PBS. Data are shown as area under the curve (AUC) quantification of the ELISA curves. Representative of two independent experiments with 4–5 mice per group. Bars represent mean ± SEM, statistical analysis was performed using a one-way ANOVA followed by Tukey’s multiple comparison test; shown is only the difference between H7HA166-186 peptide vs. OVA groups. *p = 0.014, **p = 0.0012, ***p = 0.0005. d WB analysis of HA protein recognition from MDCK cells infected with H1N1, H3N2, or H7N9 viruses, using serum from H7-HA166-186 peptide-immunized mice. First antibody: serum from H7HA166-186 peptide-immunized mice, second antibody: anti-mouse IgG. e Graph showing Hemagglutination inhibition assay (HAI) titer of immunized serum against H1N1/H3N2/H7N9 viruses. Representative of two independent experiments with 4–5 mice per group. Bars represent mean ± SEM, statistical analysis was performed using a one-way ANOVA followed by Tukey’s multiple comparison test; shown is only the difference between H7HA166-186 peptide vs. OVA groups. ****p < 0.0001; H1N1 and H3N2: **p = 0.003. f Weight loss and survival curves of mice immunized with H7HA166-186 peptide. Mice (n = 10 per group, two independent experiments) were infected with H7N1 (1 TCID50, lethal dose) at day 42, after being immunized three times with H7HA166-186 peptide (see b). ****p < 0.0001.
Fig. 7 H7HA166-186 peptide immunization confers partial protection from lethal H7N9 infection. a Schematic illustration of H7-HA166-186 peptide localization (shown in red) within the HA protein timer (gray). b Schematic timeline of peptide immunization protocol. Created with BioRender.com. c Serum binding analysis to H1, H3 and H7 HA proteins from mice immunized with H7HA166-186 peptide, OVA peptide and PBS. Data are shown as area under the curve (AUC) quantification of the ELISA curves. Representative of two independent experiments with 4–5 mice per group. Bars represent mean ± SEM, statistical analysis was performed using a one-way ANOVA followed by Tukey’s multiple comparison test; shown is only the difference between H7HA166-186 peptide vs. OVA groups. *p = 0.014, **p = 0.0012, ***p = 0.0005. d WB analysis of HA protein recognition from MDCK cells infected with H1N1, H3N2, or H7N9 viruses, using serum from H7-HA166-186 peptide-immunized mice. First antibody: serum from H7HA166-186 peptide-immunized mice, second antibody: anti-mouse IgG. e Graph showing Hemagglutination inhibition assay (HAI) titer of immunized serum against H1N1/H3N2/H7N9 viruses. Representative of two independent experiments with 4–5 mice per group. Bars represent mean ± SEM, statistical analysis was performed using a one-way ANOVA followed by Tukey’s multiple comparison test; shown is only the difference between H7HA166-186 peptide vs. OVA groups. ****p < 0.0001; H1N1 and H3N2: **p = 0.003. f Weight loss and survival curves of mice immunized with H7HA166-186 peptide. Mice (n = 10 per group, two independent experiments) were infected with H7N1 (1 TCID50, lethal dose) at day 42, after being immunized three times with H7HA166-186 peptide (see b). ****p < 0.0001.CC BY · PubMed Central

Verification

Claims the paper makes

The claims and statistics of this paper haven’t been checked yet.

Run the check — free, no account needed. It reads the open-access text and checks the sources it cites.

A few free checks a day · papers already verified open instantly · results are public

Self-check

Percentages, sums and reported differences re-computed from the paper’s own numbers.

The self-check needs the paper’s full text.

Citations

Cites

Show all 1 references

Research works printed but not linked: 82

  1. Barry, J.M. The great influenza: The story of the deadliest pandemic in history, (Penguin Uk, 2020).
  2. 10.1016/S0140-6736(17)33293-2 · DOI
  3. Caserta, L.C. et al. Spillover of highly pathogenic avian influenza H5N1 virus to dairy cattle. Nature, 1–3 (2024). · DOI
  4. 10.1038/s41467-024-48758-4 · DOI
  5. 10.1016/j.vaccine.2017.06.044 · DOI
  6. 10.1126/science.1242917 · DOI
  7. 10.3201/eid1908.130662 · DOI
  8. 10.1038/nature12391 · DOI
  9. 10.2807/1560-7917.ES.2017.22.19.30533 · DOI
  10. 10.3201/eid2308.170600 · DOI
  11. 10.1038/nature12392 · DOI
  12. 10.7150/thno.17071 · DOI
  13. 10.1126/scitranslmed.aan8405 · DOI
  14. Demicheli, V. et al. Vaccines for preventing influenza in the elderly. Cochrane Database Syst Rev 2, CD004876 (2018). · DOI
  15. 2018, Vaccines for preventing influenza in healthy adults, Cochrane Database Syst Rev, 2, CD001269
  16. 10.1101/cshperspect.a028852 · DOI
  17. 10.1073/pnas.1816300116 · DOI
  18. 10.1016/j.vaccine.2024.04.037 · DOI
  19. 10.1089/vim.2017.0129 · DOI
  20. 10.1038/ni.3680 · DOI
  21. 10.1038/s41598-018-22307-8 · DOI
  22. 10.1128/JVI.00700-11 · DOI
  23. 10.1084/jem.20181624 · DOI
  24. 10.1128/JVI.03562-13 · DOI
  25. 10.1038/nature11371 · DOI
  26. 10.1038/s41586-021-04356-8 · DOI
  27. 10.1016/j.cels.2020.09.005 · DOI
  28. 10.1073/pnas.1715471115 · DOI
  29. Guthmiller, J.J. et al. First exposure to the pandemic H1N1 virus induced broadly neutralizing antibodies targeting hemagglutinin head epitopes. Sci Transl Med 13(2021). · DOI
  30. 10.1016/j.it.2018.04.008 · DOI
  31. 10.1038/s41467-018-04704-9 · DOI
  32. 10.1146/annurev-biochem-063011-092449 · DOI · Paper page
  33. 10.1007/s00216-019-01633-4 · DOI
  34. Ji, P. et al. A new nanobody-enzyme fusion protein-linked immunoassay for detecting antibodies against influenza A virus in different species. J Biol Chem 298, 102709 (2022). · DOI
  35. Cao, J. et al. Nanobody-based sandwich reporter system for living cell sensing influenza A virus infection. Sci Rep 9, 15899 (2019). · DOI
  36. 10.1007/s00253-021-11488-4 · DOI
  37. 10.1016/j.jmb.2011.01.017 · DOI
  38. 10.1093/emboj/17.13.3512 · DOI
  39. 10.1007/s40259-019-00392-z · DOI · Paper page
  40. 10.1073/pnas.0505379103 · DOI
  41. 10.3389/fimmu.2017.01603 · DOI · Paper page
  42. 10.1128/mbio.02810-18 · DOI
  43. Del Rosario, J.M.M. et al. Protection from influenza by intramuscular gene vector delivery of a broadly neutralizing nanobody does not depend on antibody dependent cellular cytotoxicity. Frontiers in Immunology 11, 627 (2020). · DOI
  44. 10.1126/science.aaq0620 · DOI
  45. Abreu, R.B. , Kirchenbaum, G.A. , Clutter, E.F. , Sautto, G.A. & Ross, T.M . Preexisting subtype immunodominance shapes memory B cell recall response to influenza vaccination. JCI Insight 5(2020). · DOI
  46. 10.1016/j.virusres.2021.198409 · DOI
  47. 10.1128/jvi.01100-18 · DOI
  48. 10.1016/j.celrep.2021.109286 · DOI
  49. 10.1016/j.chom.2013.02.008 · DOI
  50. 10.1038/ncomms5794 · DOI
  51. 10.1017/S0950268815001570 · DOI
  52. 10.1371/journal.ppat.1009300 · DOI
  53. Abanades, B. et al. ImmuneBuilder: Deep-Learning models for predicting the structures of immune proteins. Commun Biol 6, 575 (2023). · DOI
  54. 10.1038/ncomms7114 · DOI
  55. 10.1038/s41577-019-0143-6 · DOI
  56. 10.1016/j.celrep.2020.108088 · DOI
  57. 10.1016/j.jviromet.2005.10.001 · DOI
  58. Bliss, C.M. et al. A chimeric haemagglutinin-based universal influenza virus vaccine boosts human cellular immune responses directed towards the conserved haemagglutinin stalk domain and the viral nucleoprotein. EBioMedicine 104(2024). · DOI
  59. 10.1128/JVI.01388-13 · DOI
  60. 10.1016/j.cell.2019.03.048 · DOI
  61. Leon, P.E. et al. Generation of Escape Variants of Neutralizing Influenza Virus Monoclonal Antibodies. J Vis Exp (2017). · DOI
  62. 10.1038/s41591-021-01636-8 · DOI
  63. 10.1172/JCI81104 · DOI
  64. 10.1073/pnas.1409171111 · DOI
  65. Liu, S.T. et al. Antigenic sites in influenza H1 hemagglutinin display species-specific immunodominance. J Clin Invest (2018). · DOI
  66. Broecker, F. et al. Immunodominance of Antigenic Site B in the Hemagglutinin of the Current H3N2 Influenza Virus in Humans and Mice. J Virol (2018). · DOI
  67. 10.1128/mBio.01156-15 · DOI
  68. Altman, M.O. , Bennink, J.R. , Yewdell, J.W. & Herrin, B.R . Lamprey VLRB response to influenza virus supports universal rules of immunogenicity and antigenicity. Elife 4(2015). · DOI
  69. 10.1021/acs.chemrev.9b00472 · DOI · Paper page
  70. Kirkpatrick, E. , Qiu, X. , Wilson, P.C. , Bahl, J. & Krammer, F . The influenza virus hemagglutinin head evolves faster than the stalk domain. Scientific reports 8, 10432 (2018). · DOI
  71. 10.1016/j.chom.2017.05.011 · DOI
  72. 10.1126/scitranslmed.abg4535 · DOI
  73. 10.1128/mBio.01144-21 · DOI
  74. Sangesland, M. & Lingwood, D . Antibody Focusing to Conserved Sites of Vulnerability: The Immunological Pathways for ‘Universal’ Influenza Vaccines. Vaccines (Basel ) 9, 125 (2021). · DOI
  75. Castro, K.M. , Scheck, A. , Xiao, S. & Correia, B.E . Computational design of vaccine immunogens. Curr Opin Biotechnol 78, 102821 (2022). · DOI
  76. 10.1073/pnas.2208718120 · DOI
  77. 10.1126/sciimmunol.adj9534 · DOI
  78. 10.1126/science.aaz5143 · DOI
  79. 10.1016/j.chom.2018.08.006 · DOI
  80. Martinez-Sobrido, L. & Garcia-Sastre, A . Generation of recombinant influenza virus from plasmid DNA. J Vis Exp (2010). · DOI
  81. 10.1093/molbev/mst010 · DOI · Paper page
  82. Evans, R. et al. Protein complex prediction with AlphaFold-Multimer . biorxiv, 2021.10. 04.463034 (2021). · DOI · Paper page

Metadata

Authors
Chen, Z.-S., Huang, H.-C., Wang, X., Schön, K., Jia, Y., Lebens, M., Besavilla, D. F., Murti, J. R., Ji, Y., Sarshad, A. A., Deng, G., Zhu, Q., & Angeletti, D.
Affiliations
  • Lanzhou Veterinary Research Institute (CN)
  • Wallenberg Centre for Molecular and Translational Medicine (SE)
  • University of Gothenburg (SE)
  • Chinese Academy of Agricultural Sciences (CN)
  • Science for Life Laboratory (SE)
Corresponding author
  • Zhu, Qiyun
  • Angeletti, Davide
Venue
Nature Communications
Publisher
openRxiv
Published
2024-10-31
Volume
16
Issue
1
Pages
432-432
ISSN
2041-1723 (ISSN-L)
OpenAlex
W4406221636
Cited by
39
References
1
Citations by year
2026: 26 · 2025: 13
FWCI
26.85
Type
journal article
Language
en
Open access
Locations
  • Nature Communications (publishedVersion, cc-by)
  • bioRxiv (Cold Spring Harbor Laboratory) (acceptedVersion, cc-by-nc-nd)
  • PubMed Central (publishedVersion, cc-by)
  • PubMed (publishedVersion)
  • RePEc: Research Papers in Economics (submittedVersion)
  • DOAJ (DOAJ: Directory of Open Access Journals) (submittedVersion, cc-by-sa)
Funders
  • National Natural Science Foundation of China (32272972, U23A20243, 2021YFD1800204)
  • Svenska Sällskapet för Medicinsk Forskning (S19-0019)
  • Knut och Alice Wallenbergs Stiftelse (850638, 2021.0033, PAR 2020/228)
  • Vetenskapsrådet (2021-01164, 2019-01855, 2021-01165, 850638)
  • Göteborgs Universitet
Topics
  • Health Sciences › Medicine › Epidemiology › Influenza Virus Research Studies
  • Life Sciences › Biochemistry, Genetics and Molecular Biology › Molecular Biology › vaccines and immunoinformatics approaches
  • Life Sciences › Immunology and Microbiology › Immunology › Monoclonal and Polyclonal Antibodies Research
Keywords
nanobodies, immunodominant epitopes, broadly neutralizing antibodies, heterosubtypic immunity, universal influenza vaccine, peptide immunization, antigenic drift
MeSH terms
Animals, Antibodies, Viral, Cross Reactions, Dogs, Female, Humans, Influenza, Human, Influenza Vaccines, Mice, Inbred BALB C, Orthomyxoviridae Infections, Influenza A virus, Immunodominant Epitopes, Hemagglutinin Glycoproteins, Influenza Virus, Mice, Antibodies, Neutralizing, Single-Domain Antibodies, Madin Darby Canine Kidney Cells

About these checks

Registry, retraction, Cites and statistics results are computed, not judged, with one exception: a printed reference that no index lists is read once by a model before it counts as a citation error. Claims are extracted by a model and kept only when their quote appears verbatim in the text; each cited source is then checked, with a model’s help, for whether it says what the claim relies on. Those verdicts can be wrong — read the claim’s quote and the cited source before relying on one.

Statistics and arithmetic are recomputed, not judged.

Confidence bands are shown only for fields calibrated on our annotated test set. None is calibrated yet, so no band is shown.

What counts as a claim ›How we measure confidence ›How we check this ›

Are you an author, or do you see a problem with this page? Request a review

How to cite

Cite CoChat for the checks on this page, and the paper for its own findings.

This page
CoChat. (2026). Citation check: Influenza A Virus H7 nanobody recognizes a conserved immunodominant epitope on hemagglutinin head and confers heterosubtypic protection. https://app.cochat.ai/papers/10.1101/2024.10.31.621368
The paper
Chen, Z.-S., Huang, H.-C., Wang, X., Schön, K., Jia, Y., Lebens, M., Besavilla, D. F., Murti, J. R., Ji, Y., Sarshad, A. A., Deng, G., Zhu, Q., & Angeletti, D. (2024). Influenza A Virus H7 nanobody recognizes a conserved immunodominant epitope on hemagglutinin head and confers heterosubtypic protection. Nature Communications. https://doi.org/10.1101/2024.10.31.621368