PreprintCited by 5Microtubule and mitosis dynamicsGenetic and Kidney Cyst DiseasesProtein Structure and Dynamics

The DOI matches its Crossref record; 1 of the 1 references it cites were found in a registry or an index.

Cryo-EM captures early intermediate steps in dynein activation by LIS1

Open access
Nguyen, Kendrick H. V., Karasmanis, Eva P., Kendrick, Agnieszka A., Reck-Peterson, Samara L., Leschziner, Andres E.·2025·Nature Communications

Preprint — published as 10.1038/s41467-025-62185-z · Paper page

Abstract

Cytoplasmic dynein-1 (dynein) is an essential molecular motor in eukaryotic cells. Dynein primarily exists in an autoinhibited “Phi” state and requires conformational changes to assemble with its cofactors and form active transport complexes. LIS1, a key dynein regulator, enhances dynein activation and assembly. Using cryo-EM and a human dynein-LIS1 sample incubated with ATP, we mapped the conformational landscape of dynein activation by LIS1. We discovered a novel early intermediate state that we propose precedes our previously identified dynein-LIS1 “Chi” state. Mutations that disrupt this species, which we termed “Pre-Chi”, led to motility defects in vitro, emphasizing its functional importance. Together, our findings provide new insights into how LIS1 relieves dynein autoinhibition during the activation pathway.

Overview

The claims and statistics of this paper haven’t been checked yet.

Run the check — free, no account needed. It reads the open-access text and checks the sources it cites.

A few free checks a day · papers already verified open instantly · results are public

Integrity signals

Registry

Crossref · 10.1101/2025.01.10.632485

Cites

1 of 1 references verified0 citation errors · 0 not checkable

Statistics

Figures

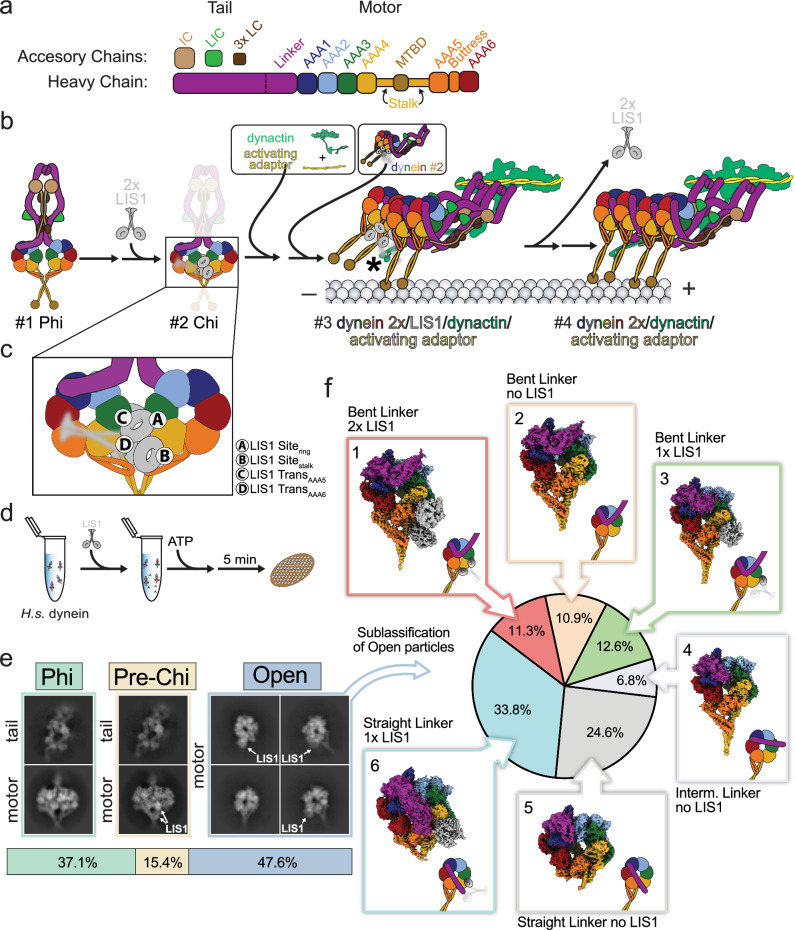
Fig. 1 Conformational landscape of dynein activation by LIS1 in the presence of ATP. a Subunit and domain organization of full-length human dynein. Individual domains and accessory chains (heavy chain (HC), intermediate chain (IC), light intermediate chain (LIC), and three light chains (LC)) are color-coded, and these colors are used throughout the paper. b Schematic representation of a hypothetical pathway for dynein activation and assembly by LIS1. The numbers identify species—#1 Phi, #2 Chi, #3 assembly of transport complex, and #4, an active transport complex—that are discussed in the text. The asterisk in #3 indicates a LIS1-p150 dynactin interaction3, which is also discussed in the text. c Known LIS1 binding sites on dynein are shown on the Chi motor domain from panel (b). d Schematic representation of the cryo-EM sample preparation pipeline. e Distribution of particles corresponding to the three main species identified in the cryo-EM dataset: Phi, Pre-Chi, and Open. Representative 2D class averages are shown. In the case of Phi and Pre-Chi, representative 2D class averages of the dynein tails, which were processed separately, are shown above those for the motor domains. LIS1 is indicated whenever present in the averages. f Further processing identified six subclasses in the Open species. The particle distribution is indicated with the corresponding cryo-EM maps next to the section in the pie chart.
Fig. 1 Conformational landscape of dynein activation by LIS1 in the presence of ATP. a Subunit and domain organization of full-length human dynein. Individual domains and accessory chains (heavy chain (HC), intermediate chain (IC), light intermediate chain (LIC), and three light chains (LC)) are color-coded, and these colors are used throughout the paper. b Schematic representation of a hypothetical pathway for dynein activation and assembly by LIS1. The numbers identify species—#1 Phi, #2 Chi, #3 assembly of transport complex, and #4, an active transport complex—that are discussed in the text. The asterisk in #3 indicates a LIS1-p150 dynactin interaction3, which is also discussed in the text. c Known LIS1 binding sites on dynein are shown on the Chi motor domain from panel (b). d Schematic representation of the cryo-EM sample preparation pipeline. e Distribution of particles corresponding to the three main species identified in the cryo-EM dataset: Phi, Pre-Chi, and Open. Representative 2D class averages are shown. In the case of Phi and Pre-Chi, representative 2D class averages of the dynein tails, which were processed separately, are shown above those for the motor domains. LIS1 is indicated whenever present in the averages. f Further processing identified six subclasses in the Open species. The particle distribution is indicated with the corresponding cryo-EM maps next to the section in the pie chart.CC BY · PubMed Central
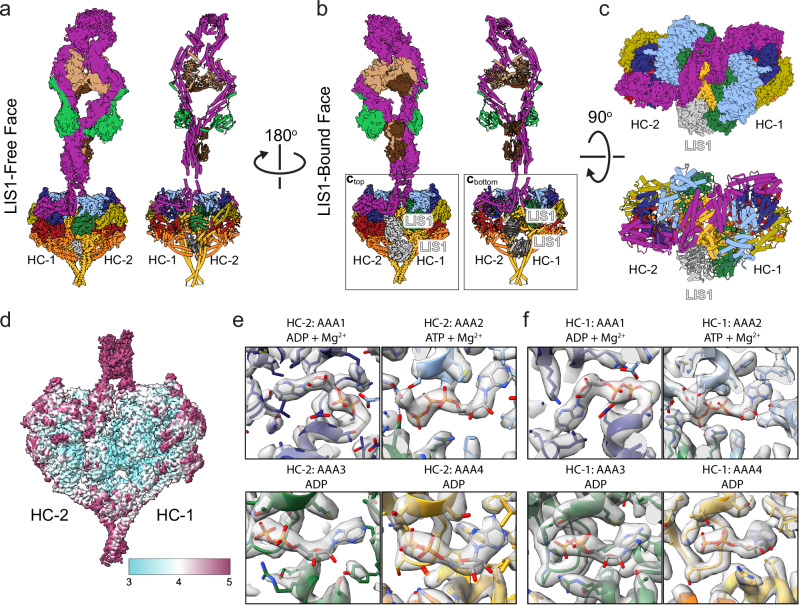
Fig. 2 Structure of the Pre-Chi dynein-LIS1 complex. a–c Cryo-EM maps and models of the motor and tail domains of the Pre-Chi dynein-LIS1 complex are shown in three orientations: (a) LIS1-free face, (b) LIS1-bound face, and (c) a top view where the Pre-Chi motors are shown enlarged and from the perspective of the tail. LIS1 is highlighted in the LIS1-bound (b) and top (c) views. d Local resolution map of Pre-Chi. e, f Nucleotide states of AAA1–AAA4 in Motor 2 (Heavy Chain 2, HC-2) (e) and Motor 1 (Heavy Chain 1, HC-1) (f).
Fig. 2 Structure of the Pre-Chi dynein-LIS1 complex. a–c Cryo-EM maps and models of the motor and tail domains of the Pre-Chi dynein-LIS1 complex are shown in three orientations: (a) LIS1-free face, (b) LIS1-bound face, and (c) a top view where the Pre-Chi motors are shown enlarged and from the perspective of the tail. LIS1 is highlighted in the LIS1-bound (b) and top (c) views. d Local resolution map of Pre-Chi. e, f Nucleotide states of AAA1–AAA4 in Motor 2 (Heavy Chain 2, HC-2) (e) and Motor 1 (Heavy Chain 1, HC-1) (f).CC BY · PubMed Central
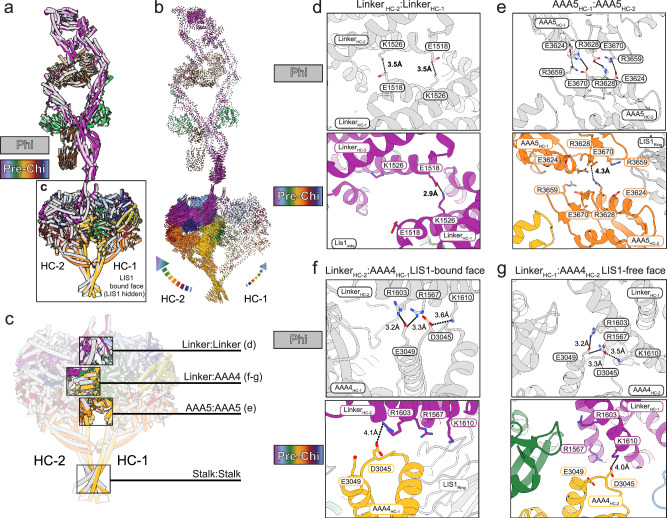
Fig. 3 Phi-stabilizing contacts are disrupted in Pre-Chi. a Superposition of Pre-Chi (rainbow) and Phi (gray) models. HC-1 was used as the reference to align the models. Although the Pre-Chi model is shown from the LIS1-bound face, LIS1 was omitted for clarity. b Map of interatomic vectors connecting equivalent α carbons in Phi and Pre-Chi. The length of each vector is proportional to the distance between the atoms in Phi and Pre-Chi. c The four main interfaces between the motors in Phi are highlighted in the context of the boxed model in panel (a): Linker:Linker, Linker:AAA4, AAA5:AAA5, and Stalk:Stalk. d–g Close-ups of the three interfaces highlighted in (c) that are disrupted by the formation of Pre-Chi: Linker:Linker (d), AAA5:AAA5 (e), and Linker:AAA4 (f, g). The top panel corresponds to the Phi model, and the bottom panel corresponds to the Pre-Chi model. Key residues, motor chains, LIS1 ring, and the domain(s) of the motor being displayed are highlighted on each panel. Interactions are shown with dotted lines, with their distances (in Å) indicated. There was no significant change in the Stalk:Stalk interface. There are differences in the Linker:AAA4 interface between the LIS1-bound face (f) and the LIS1-free face (g).
Fig. 3 Phi-stabilizing contacts are disrupted in Pre-Chi. a Superposition of Pre-Chi (rainbow) and Phi (gray) models. HC-1 was used as the reference to align the models. Although the Pre-Chi model is shown from the LIS1-bound face, LIS1 was omitted for clarity. b Map of interatomic vectors connecting equivalent α carbons in Phi and Pre-Chi. The length of each vector is proportional to the distance between the atoms in Phi and Pre-Chi. c The four main interfaces between the motors in Phi are highlighted in the context of the boxed model in panel (a): Linker:Linker, Linker:AAA4, AAA5:AAA5, and Stalk:Stalk. d–g Close-ups of the three interfaces highlighted in (c) that are disrupted by the formation of Pre-Chi: Linker:Linker (d), AAA5:AAA5 (e), and Linker:AAA4 (f, g). The top panel corresponds to the Phi model, and the bottom panel corresponds to the Pre-Chi model. Key residues, motor chains, LIS1 ring, and the domain(s) of the motor being displayed are highlighted on each panel. Interactions are shown with dotted lines, with their distances (in Å) indicated. There was no significant change in the Stalk:Stalk interface. There are differences in the Linker:AAA4 interface between the LIS1-bound face (f) and the LIS1-free face (g).CC BY · PubMed Central
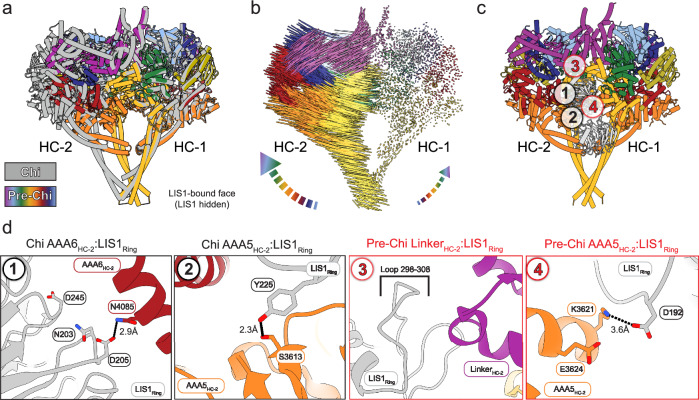
Fig. 4 Comparison of Pre-Chi with Chi. a Superposition between Chi and Pre-Chi. The model of human Chi from our previous work (dark gray)33 and human Pre-Chi motor (rainbow) were superimposed and aligned using HC-1. b Interatomic vectors connecting equivalent alpha carbons in Pre-Chi and Chi for the superposition shown in (a). c Pre-Chi model viewed from the LIS1-bound face with interfaces present in both Chi and Pre-Chi (#1-2 in black circles) and Pre-Chi-specific interfaces (#3-4 in red circles) highlighted. d Close-ups of the interfaces highlighted in (c). Residues involved in the interfaces and the names of the domains interacting with LIS1ring are highlighted in each panel. Interactions are shown with dotted lines, with their distances (in Å) indicated.
Fig. 4 Comparison of Pre-Chi with Chi. a Superposition between Chi and Pre-Chi. The model of human Chi from our previous work (dark gray)33 and human Pre-Chi motor (rainbow) were superimposed and aligned using HC-1. b Interatomic vectors connecting equivalent alpha carbons in Pre-Chi and Chi for the superposition shown in (a). c Pre-Chi model viewed from the LIS1-bound face with interfaces present in both Chi and Pre-Chi (#1-2 in black circles) and Pre-Chi-specific interfaces (#3-4 in red circles) highlighted. d Close-ups of the interfaces highlighted in (c). Residues involved in the interfaces and the names of the domains interacting with LIS1ring are highlighted in each panel. Interactions are shown with dotted lines, with their distances (in Å) indicated.CC BY · PubMed Central
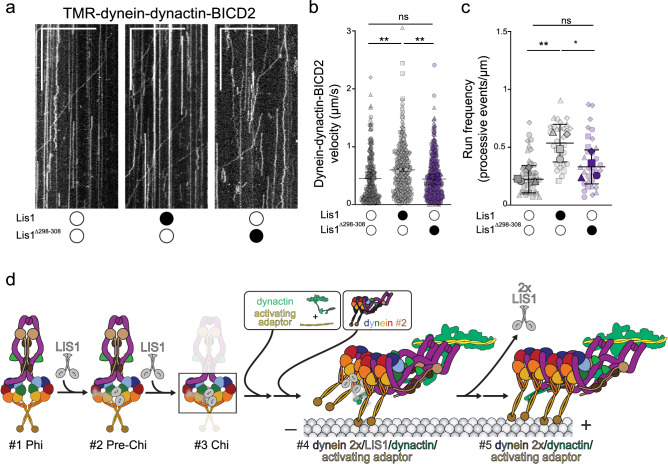
Fig. 5 The Pre-Chi-specific contact between LIS1 and dynein’s linker is required for LIS1’s effect on dynein motility. a Representative kymographs from single-molecule motility assays with purified TMR–dynein–dynactin–BICD2 in the absence (white circle) or presence (black circle) of human LIS1 wild type or LIS1Δ298–308. Scale bars, 10 μm (x) and 100 s (y). b Single-molecule velocity (mean ± standard deviation of the means of each replicate) of TMR–dynein–dynactin–BICD2 complexes in the absence (white circles) or presence (black circles) of human LIS1 or LIS1Δ298–308. Superplots show all individual data points for each of the four technical replicates. n values for each replicate are: no LIS1, n = 70, 70, 50, 91; LIS1, n = 90, 85, 58, 117; LIS1Δ298–308, n = 116, 125, 89, 124. Larger shapes denote the mean of each of the four technical replicates. No LIS1 and LIS1 **P = 0.0017, Νο LIS1 and LIS1Δ298–308 ns P = 0.9692, LIS1 and LIS1Δ298–308 **P = 0.0012. Statistics were generated on the means of the four replicates using a One-Way ANOVA with Tukey’s multiple comparison test. c Superplots show Run frequencies (processive events /μm of microtubule length; mean ± standard deviation of the means of each replicate) of TMR–dynein–dynactin–BICD2 complexes in the absence (white circle) or presence (black circle) of unlabeled wild-type human LIS1 or LIS1Δ298–308. Data points are represented as triangles, circles, squares, and diamonds corresponding to single measurements within each technical replicate (no LIS1, n = 14, 12, 11, 8; LIS1, n = 12, 7, 7, 7; LIS1Δ298–308, n = 11, 5, 8, 9). No LIS1 and LIS1 **P = 0.005, LIS1 and LIS1Δ298–308 *P = 0.0466, no LIS1 and LIS1Δ298–308 ns P = 0.3453. Statistical analysis was done using a One-Way ANOVA with Tukey’s multiple comparison test. d Role of LIS1 in the activation of dynein. This schematic is an updated version of the pathway introduced in Fig. 1b that incorporates the Pre-Chi intermediate identified in this study. Source data for (b and c) are included with this manuscript, along with their corresponding statistical tests.
Fig. 5 The Pre-Chi-specific contact between LIS1 and dynein’s linker is required for LIS1’s effect on dynein motility. a Representative kymographs from single-molecule motility assays with purified TMR–dynein–dynactin–BICD2 in the absence (white circle) or presence (black circle) of human LIS1 wild type or LIS1Δ298–308. Scale bars, 10 μm (x) and 100 s (y). b Single-molecule velocity (mean ± standard deviation of the means of each replicate) of TMR–dynein–dynactin–BICD2 complexes in the absence (white circles) or presence (black circles) of human LIS1 or LIS1Δ298–308. Superplots show all individual data points for each of the four technical replicates. n values for each replicate are: no LIS1, n = 70, 70, 50, 91; LIS1, n = 90, 85, 58, 117; LIS1Δ298–308, n = 116, 125, 89, 124. Larger shapes denote the mean of each of the four technical replicates. No LIS1 and LIS1 **P = 0.0017, Νο LIS1 and LIS1Δ298–308 ns P = 0.9692, LIS1 and LIS1Δ298–308 **P = 0.0012. Statistics were generated on the means of the four replicates using a One-Way ANOVA with Tukey’s multiple comparison test. c Superplots show Run frequencies (processive events /μm of microtubule length; mean ± standard deviation of the means of each replicate) of TMR–dynein–dynactin–BICD2 complexes in the absence (white circle) or presence (black circle) of unlabeled wild-type human LIS1 or LIS1Δ298–308. Data points are represented as triangles, circles, squares, and diamonds corresponding to single measurements within each technical replicate (no LIS1, n = 14, 12, 11, 8; LIS1, n = 12, 7, 7, 7; LIS1Δ298–308, n = 11, 5, 8, 9). No LIS1 and LIS1 **P = 0.005, LIS1 and LIS1Δ298–308 *P = 0.0466, no LIS1 and LIS1Δ298–308 ns P = 0.3453. Statistical analysis was done using a One-Way ANOVA with Tukey’s multiple comparison test. d Role of LIS1 in the activation of dynein. This schematic is an updated version of the pathway introduced in Fig. 1b that incorporates the Pre-Chi intermediate identified in this study. Source data for (b and c) are included with this manuscript, along with their corresponding statistical tests.CC BY · PubMed Central

Verification

Claims the paper makes

The claims and statistics of this paper haven’t been checked yet.

Run the check — free, no account needed. It reads the open-access text and checks the sources it cites.

A few free checks a day · papers already verified open instantly · results are public

Self-check

Percentages, sums and reported differences re-computed from the paper’s own numbers.

The self-check needs the paper’s full text.

Citations

Cites

Research works printed but not linked: 58

  1. 10.1038/s41580-018-0004-3 · DOI
  2. 10.1042/BST20130188 · DOI
  3. 10.1126/science.adk8544 · DOI
  4. 10.1016/j.sbi.2015.12.003 · DOI
  5. 10.1146/annurev-biophys-111020-101511 · DOI
  6. 10.1146/annurev-cellbio-100814-125438 · DOI
  7. Gibbons, I. R. , Gibbons, B. H. & Mocz, G. Multiple nucleotide-binding sites in the sequence of dynein. 352, (1991). · DOI
  8. 10.1038/nsmb930 · DOI
  9. 10.1038/nature10955 · DOI
  10. 10.1074/jbc.M802951200 · DOI
  11. 10.1038/nsmb.2272 · DOI
  12. 10.1002/bip.22856 · DOI
  13. 10.1016/j.cell.2014.10.018 · DOI
  14. 10.1038/nsmb.2930 · DOI
  15. 10.1242/jcs.93.1.19 · DOI
  16. 10.1038/ncb3048 · DOI
  17. 10.1016/j.cell.2017.05.025 · DOI
  18. 10.1242/jcs.227132 · DOI
  19. 10.1091/mbc.6.3.297 · DOI
  20. 10.7554/elife.59737 · DOI
  21. 10.1159/000448639 · DOI
  22. 10.1016/j.str.2004.03.024 · DOI
  23. 10.1016/j.neuron.2004.11.019 · DOI
  24. 10.1016/j.cell.2012.07.022 · DOI
  25. 10.1007/BF00290678 · DOI
  26. 10.1038/s41556-020-0501-4 · DOI
  27. 10.7554/elife.71229 · DOI
  28. 10.1038/s41556-020-0506-z · DOI
  29. 10.1038/s41594-023-01010-x · DOI
  30. 10.7554/elife.59737 · DOI
  31. 10.1038/S41556-020-0492-1 · DOI
  32. 10.1083/jcb.201905178 · DOI
  33. 10.1016/j.cub.2021.07.081 · DOI
  34. 10.1038/s41594-023-01069-6 · DOI
  35. 10.7554/eLife.03372 · DOI
  36. 10.1016/j.cell.2017.08.037 · DOI
  37. 10.1038/nmeth.4169 · DOI · Paper page
  38. 10.1038/nmeth.4193 · DOI
  39. 10.1016/j.jsb.2015.08.008 · DOI
  40. 10.1038/s41467-020-18952-1 · DOI
  41. 10.1038/s41592-020-01049-4 · DOI
  42. 10.1038/s41596-022-00763-x · DOI
  43. 10.1016/j.jsb.2012.09.006 · DOI · Paper page
  44. 10.1101/2024.09.28.615567 · DOI
  45. 10.1101/2024.05.01.592044 · DOI
  46. 10.7554/eLife.84302 · DOI · Paper page
  47. 10.1186/s12887-022-03595-6 · DOI
  48. 10.1074/jbc.M110.181578 · DOI
  49. 10.1038/s41467-023-42907-x · DOI
  50. 10.1093/hmg/ddt436 · DOI
  51. 10.1083/jcb.201011142 · DOI
  52. 10.3791/62765 · DOI
  53. 10.1038/s41467-020-18952-1 · DOI
  54. 10.1002/PRO.3943 · DOI
  55. 10.1107/S2059798318006551 · DOI
  56. 10.1107/S0907444910007493 · DOI · Paper page
  57. 10.1038/S41592-022-01488-1 · DOI · Paper page
  58. 10.7554/eLife.02641 · DOI

Metadata

Authors
Nguyen, K. H. V., Karasmanis, E. P., Kendrick, A. A., Reck-Peterson, S. L., & Leschziner, A. E.
Affiliations
  • University of California San Diego (US)
  • Salk Institute for Biological Studies (US)
  • Department of Cellular and Molecular Medicine, University of California San Diego, La Jolla, CA, USA
Venue
Nature Communications
Publisher
openRxiv
Published
2025-01-14
Volume
16
Issue
1
Pages
7054-7054
ISSN
2041-1723 (ISSN-L)
OpenAlex
W4412818674
Cited by
5
References
1
Citations by year
2026: 5
FWCI
2.50
Type
journal article
Language
en
Open access
Locations
  • Nature Communications (publishedVersion, cc-by)
  • bioRxiv (Cold Spring Harbor Laboratory) (acceptedVersion, cc-by-nc-nd)
  • PubMed Central (publishedVersion, cc-by)
  • PubMed (publishedVersion)
  • DOAJ (DOAJ: Directory of Open Access Journals) (submittedVersion, cc-by-sa)
Funders
  • Howard Hughes Medical Institute
  • U.S. Department of Health and Human Services (R35 GM145296, T32-GM008326, R35 GM141825)
  • American Cancer Society
  • Jane Coffin Childs Memorial Fund for Medical Research
  • National Institutes of Health (CA014195)
  • University of California, San Diego
  • National Cancer Institute (P30CA014195)
  • National Institute of General Medical Sciences (R01GM107214, T32GM008326, R35GM145296, R35GM141825, T32GM139795)
Topics
  • Life Sciences › Biochemistry, Genetics and Molecular Biology › Cell Biology › Microtubule and mitosis dynamics
  • Life Sciences › Biochemistry, Genetics and Molecular Biology › Genetics › Genetic and Kidney Cyst Diseases
  • Life Sciences › Biochemistry, Genetics and Molecular Biology › Molecular Biology › Protein Structure and Dynamics
Keywords
cytoplasmic dynein-1, LIS1, dynein activation, molecular motors, motility defects
MeSH terms
Adenosine Triphosphate, Dyneins, Humans, Microtubule-Associated Proteins, Models, Molecular, Mutation, Protein Conformation, Cryoelectron Microscopy, 1-Alkyl-2-acetylglycerophosphocholine Esterase, Cytoplasmic Dyneins

About these checks

Registry, retraction, Cites and statistics results are computed, not judged, with one exception: a printed reference that no index lists is read once by a model before it counts as a citation error. Claims are extracted by a model and kept only when their quote appears verbatim in the text; each cited source is then checked, with a model’s help, for whether it says what the claim relies on. Those verdicts can be wrong — read the claim’s quote and the cited source before relying on one.

Statistics and arithmetic are recomputed, not judged.

Confidence bands are shown only for fields calibrated on our annotated test set. None is calibrated yet, so no band is shown.

What counts as a claim ›How we measure confidence ›How we check this ›

Are you an author, or do you see a problem with this page? Request a review