PreprintCited by 1CRISPR and Genetic EngineeringPhotoreceptor and optogenetics researchPhotochromic and Fluorescence Chemistry

The DOI matches its Crossref record; its reference list is not available.

Optimized optogenetic anti-CRISPR for endogenous gene regulation in Drosophila

Open access

Preprint — published as 10.1093/nar/gkag244 · Paper page

Abstract

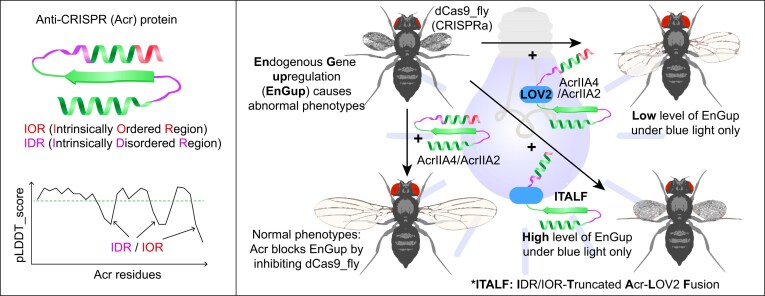
Optogenetic tools – whose engineering requires a structural understanding of the target proteins – are attractive approaches for achieving endogenous gene regulation under minimally invasive conditions. To build an optogenetic system for controlling endogenous gene expression, we first identified Anti-CRISPR (Acr) proteins that can inhibit CRISPRa-mediated transcriptional activation in Drosophila . Next, we inserted optogenetic protein LOV2 in these Acrs, tested for their ability to optogenetically modulate endogenous gene upregulation (EnGup) through the CRISPRa-based flySAM system in Drosophila , and found that the photoswitchability of these prototypes was weak. Hence, we engineered an Acr-LOV2 fusion module with refined length of intrinsically disordered and ordered regions (IDR and IOR) and optimized LOV2. This optimized variant, whose application yielded new findings in vivo , was significantly more sensitive for EnGup under blue light than the prototypes. In short, not only does this work introduce the application of Acr proteins in an animal model, but it also provides insights for in vivo characterization of the IDR and the IOR of these small-sized proteins. Together, these findings establish a robust optogenetic toolbox for precise, light-sensitive endogenous gene regulation in Drosophila . Graphical abstract:

Overview

The claims and statistics of this paper haven’t been checked yet.

Run the check — free, no account needed. It reads the open-access text and checks the sources it cites.

A few free checks a day · papers already verified open instantly · results are public

Integrity signals

Registry

Crossref · 10.1101/2025.05.02.651826

Cites

Statistics

Figures

Graphical Abstract
Graphical Abstract CC BY · PubMed Central
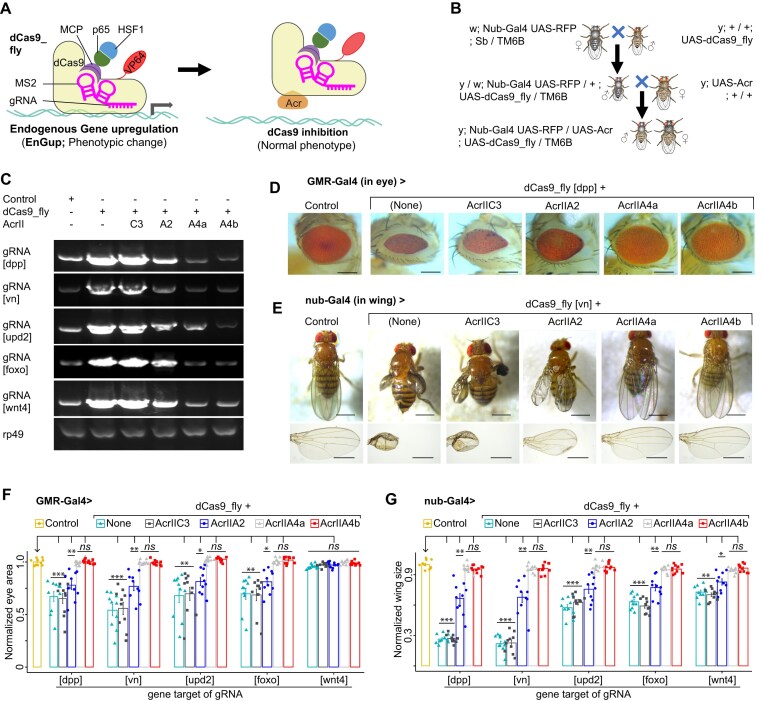
Figure 1. Identification of Acr that effectively inhibits dCas9_flySAM. (A) Cartoon representation of dCas9_flySAM for target gene expression in flies. The system is composed of dCas9 fused to transcriptional activation domain p65-HSF1, via MS2-MCP, and to a chimeric activator VP64, directly. Acr protein is hypothetically able to block dCas9_flySAM activity. (B) Crossing scheme for coexpressing dCas9_flySAM and Acr with a nonlethal driver, such as Nub-Gal4 in wings. (C) Reverse Transcription PCR (RT-PCR) results of fly wings that expressed dCas9_flySAM-targeted a set of genes (dpp, vn, upd2, foxo, and wnt4) along with each Acr protein. rp49, a loading control. Representative images showing that AcrIIA4a&b are effectively able to rescue the phenotypes generated by in vivo CRISPRa via inhibition of dCas9 (D, E) and corresponding data summaries were shown (F, G). Data summaries for eye surfaces (F) and wing sizes (G) of flies coexpressing dCas9_flySAM-targeted genes (dpp, vn, upd2, foxo, and wnt4) along with each Acr protein. In panels (C)–(G), the Control is a dCas9_fly line without Gal4. In panels (F) and (G), every single value is normalized with the mean of the normal control. Values are represented as means ± s.d.; n = 10 female flies. The P-values were calculated by ANOVA-test; ns, *, ** and *** are, respectively, not significant, <0.01, <1e−3, and <1e−5 compared to the normalized control phenotypes. In panels (D) and (E), scale bars are 500 and 250 μm, respectively. In panels (C)–(G), the “Control” is a dCas9_fly line without Gal4 driver.
Figure 1. Identification of Acr that effectively inhibits dCas9_flySAM. (A) Cartoon representation of dCas9_flySAM for target gene expression in flies. The system is composed of dCas9 fused to transcriptional activation domain p65-HSF1, via MS2-MCP, and to a chimeric activator VP64, directly. Acr protein is hypothetically able to block dCas9_flySAM activity. (B) Crossing scheme for coexpressing dCas9_flySAM and Acr with a nonlethal driver, such as Nub-Gal4 in wings. (C) Reverse Transcription PCR (RT-PCR) results of fly wings that expressed dCas9_flySAM-targeted a set of genes (dpp, vn, upd2, foxo, and wnt4) along with each Acr protein. rp49, a loading control. Representative images showing that AcrIIA4a&b are effectively able to rescue the phenotypes generated by in vivo CRISPRa via inhibition of dCas9 (D, E) and corresponding data summaries were shown (F, G). Data summaries for eye surfaces (F) and wing sizes (G) of flies coexpressing dCas9_flySAM-targeted genes (dpp, vn, upd2, foxo, and wnt4) along with each Acr protein. In panels (C)–(G), the Control is a dCas9_fly line without Gal4. In panels (F) and (G), every single value is normalized with the mean of the normal control. Values are represented as means ± s.d.; n = 10 female flies. The P-values were calculated by ANOVA-test; ns, *, ** and *** are, respectively, not significant, <0.01, <1e−3, and <1e−5 compared to the normalized control phenotypes. In panels (D) and (E), scale bars are 500 and 250 μm, respectively. In panels (C)–(G), the “Control” is a dCas9_fly line without Gal4 driver.CC BY · PubMed Central
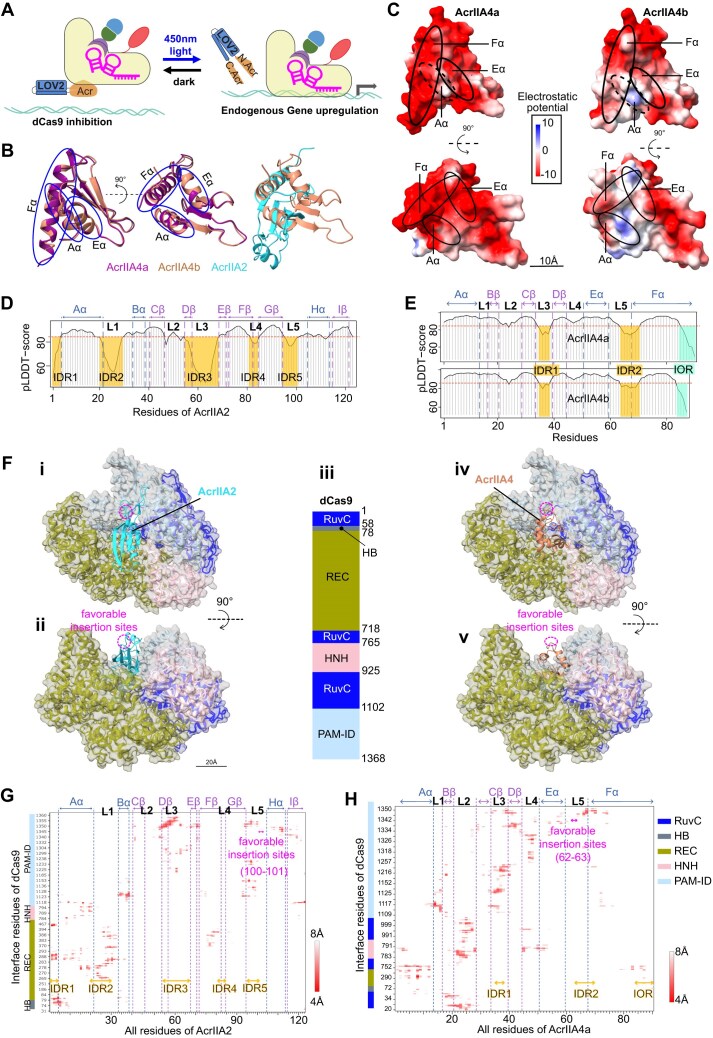
Figure 2. Structural analyses of Acr proteins. (A) Schematic of the system that we intended to build in Drosophila to enable gene overexpression only under the light illumination. (B) Side views of ribbon representation of AcrIIA4a, AcrIIA4b (homology PDB ID 5VW1) and AcrIIA2 (homology PDB ID 6MCB), colored in warm purple, light caramel, and bright cyan, respectively, captioning the structural similarities of the two AcrIIA4(s). The first view (left) is rotated to 90° angle in the second (middle) along the vertical axis (dashed line). The alpha-chains of AcrIIA4(s) (Aα, Eα, Fα) are highlighted. (C) Top (left) and side (right) views of electrostatic potentials of the molecular surfaces of AcrIIA4a (upper) and AcrIIA4b (bottom). The predicted local distance difference test (pLDDT) scores of AcrIIA2 (D) and AcrIIA4a&b (E). Their IDRs and IORs below the threshold (pLDDT_score = 85, in red dashed-line) are labeled and spotlighted, respectively, in semitransparent orange and turquoise. (F, G) Predicted interaction of AcrIIA2 and AcrIIA4b with dCas9. (F) Top (i, iv) and front (ii, v) views of alphaFold model dCas9 in complexity with AcrIIA2 (left; homology PDB ID 6IF0) and AcrIIA4 (right; homology PDB ID 5VW1). (iii) Schematic diagram of the domain organization of SpyCas9. The RNA recognizing lobe (REC), two nuclease domains HNH and RuvC, and PAM-interacting domain (PAM-ID) of the dCas9 domains are colored according to the scheme in (iii). Contact maps of predicted interface residues of dCas9 with AcrIIA2 (G) and AcrIIA4a (H) within 8Å distance of interactions. The α-chains, β-sheets and loops (L1-5) of AcrIIA4a are labeled. Likewise, the IDRs and IOR are highlighted in orange. In panels (F)–(H), the probably optimal insertion sites are spotlighted in magenta.
Figure 2. Structural analyses of Acr proteins. (A) Schematic of the system that we intended to build in Drosophila to enable gene overexpression only under the light illumination. (B) Side views of ribbon representation of AcrIIA4a, AcrIIA4b (homology PDB ID 5VW1) and AcrIIA2 (homology PDB ID 6MCB), colored in warm purple, light caramel, and bright cyan, respectively, captioning the structural similarities of the two AcrIIA4(s). The first view (left) is rotated to 90° angle in the second (middle) along the vertical axis (dashed line). The alpha-chains of AcrIIA4(s) (Aα, Eα, Fα) are highlighted. (C) Top (left) and side (right) views of electrostatic potentials of the molecular surfaces of AcrIIA4a (upper) and AcrIIA4b (bottom). The predicted local distance difference test (pLDDT) scores of AcrIIA2 (D) and AcrIIA4a&b (E). Their IDRs and IORs below the threshold (pLDDT_score = 85, in red dashed-line) are labeled and spotlighted, respectively, in semitransparent orange and turquoise. (F, G) Predicted interaction of AcrIIA2 and AcrIIA4b with dCas9. (F) Top (i, iv) and front (ii, v) views of alphaFold model dCas9 in complexity with AcrIIA2 (left; homology PDB ID 6IF0) and AcrIIA4 (right; homology PDB ID 5VW1). (iii) Schematic diagram of the domain organization of SpyCas9. The RNA recognizing lobe (REC), two nuclease domains HNH and RuvC, and PAM-interacting domain (PAM-ID) of the dCas9 domains are colored according to the scheme in (iii). Contact maps of predicted interface residues of dCas9 with AcrIIA2 (G) and AcrIIA4a (H) within 8Å distance of interactions. The α-chains, β-sheets and loops (L1-5) of AcrIIA4a are labeled. Likewise, the IDRs and IOR are highlighted in orange. In panels (F)–(H), the probably optimal insertion sites are spotlighted in magenta.CC BY · PubMed Central
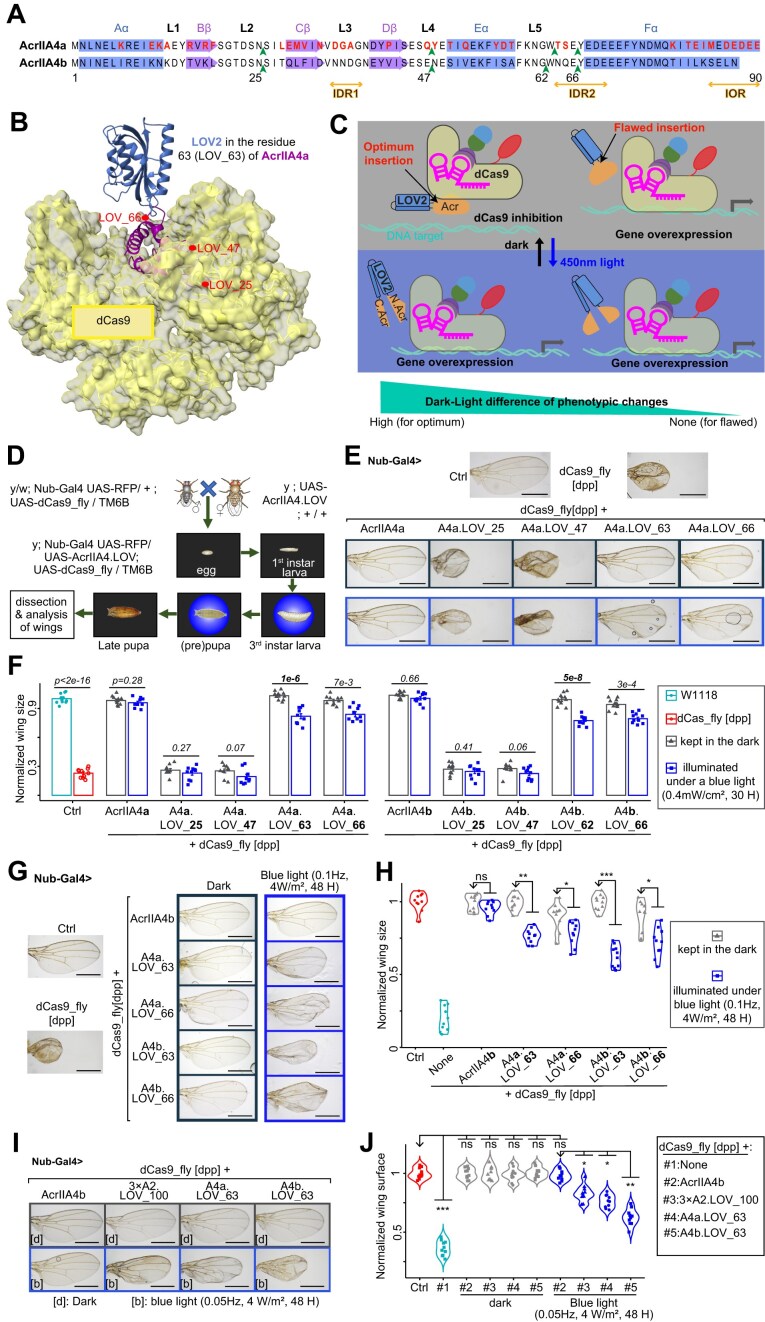
Figure 3. Engineered Acr proteins and their light-switchable to modulate gene overexpression in vivo. (A) Representations of secondary structure of AcrIIA4a and aligned with that of AcrIIA4b, and their selected LOV2 insertion sites (in green arrowhead). The amino acid sequences of alpha-chains, beta-sheets, and loops are colored in blue, medium orchid, and black, respectively. The IDRs and IOR are marked in orange. The red characters are the residues that differentiate AcrIIA4a from A4b. (B) Predicted structural model of the system for the LOV2 (dark blue) inserted in W63 of AcrIIA4a. The other LOV2 insertion sites are also highlighted in red. The surface of dCas9 is colored in semi-transparent yellow. (C) Rationale behind the optimum site of LOV2 insertion for inhibition of dCas9_fly. When LOV2 (dodger blue) is inserted in the optimum position of Acr protein (orange), the latter can inhibit dCas9 in the dark but is split by the active LOV2 under blue light, allowing dCas9_fly-mediated EnGup. (D) Experimental workflow. The crossing and their progenies were entirely kept in the dark, temporarily illuminated under a blue LED-light at the 3rd instar larval, prepupal, or pupal stage, and then put back in the dark before the dissection of the wings of adults. (E) Illustrative images of wings from flies co-expressing dCas9_fly-mediated dpp EnGup and LOV2-inserted AcrIIA4 at different positions. The blue-framed images were from the larvae exposed to a blue LED-light. (F) Data summary of normalized wing sizes described in panel (E). The numbers on the top of each pair of bars are the P-values of ANOVA tests of the dark–light difference with n = 10 female flies. (G) Representative images showing the light-responsiveness of LOV_63 of A4a and A4b compared to the positive control LOV_66. (H) Data summary of normalized wing sizes described in panel (G). It displays that LOV_63 of A4a and A4b is more light-responsive than LOV_66 for in vivo drosophila. Representative images (I) and summarized data (J) illustrate the light-sensitivity of AcrIIA4b compared with AcrIIA4a and triple dose AcrIIA2. In panels (E), (G), and (I), scale bars are 500 μm. The dark gray- and blue-framed images are the wings from flies entirely kept in the dark and temporarily illuminated with a blue LED light, respectively. In panels (H) and (J), P-values were calculated by ANOVA-test; n = 10 female flies; ns, *, ** and *** are, respectively, not significant, <0.01, <1e−3, and <1e−5 between the normalized phenotypes of the arrowhead-pointed groups and those of others. In E-J, the “Ctrl” is a dCas9_fly line without Gal4 driver.
Figure 3. Engineered Acr proteins and their light-switchable to modulate gene overexpression in vivo. (A) Representations of secondary structure of AcrIIA4a and aligned with that of AcrIIA4b, and their selected LOV2 insertion sites (in green arrowhead). The amino acid sequences of alpha-chains, beta-sheets, and loops are colored in blue, medium orchid, and black, respectively. The IDRs and IOR are marked in orange. The red characters are the residues that differentiate AcrIIA4a from A4b. (B) Predicted structural model of the system for the LOV2 (dark blue) inserted in W63 of AcrIIA4a. The other LOV2 insertion sites are also highlighted in red. The surface of dCas9 is colored in semi-transparent yellow. (C) Rationale behind the optimum site of LOV2 insertion for inhibition of dCas9_fly. When LOV2 (dodger blue) is inserted in the optimum position of Acr protein (orange), the latter can inhibit dCas9 in the dark but is split by the active LOV2 under blue light, allowing dCas9_fly-mediated EnGup. (D) Experimental workflow. The crossing and their progenies were entirely kept in the dark, temporarily illuminated under a blue LED-light at the 3rd instar larval, prepupal, or pupal stage, and then put back in the dark before the dissection of the wings of adults. (E) Illustrative images of wings from flies co-expressing dCas9_fly-mediated dpp EnGup and LOV2-inserted AcrIIA4 at different positions. The blue-framed images were from the larvae exposed to a blue LED-light. (F) Data summary of normalized wing sizes described in panel (E). The numbers on the top of each pair of bars are the P-values of ANOVA tests of the dark–light difference with n = 10 female flies. (G) Representative images showing the light-responsiveness of LOV_63 of A4a and A4b compared to the positive control LOV_66. (H) Data summary of normalized wing sizes described in panel (G). It displays that LOV_63 of A4a and A4b is more light-responsive than LOV_66 for in vivo drosophila. Representative images (I) and summarized data (J) illustrate the light-sensitivity of AcrIIA4b compared with AcrIIA4a and triple dose AcrIIA2. In panels (E), (G), and (I), scale bars are 500 μm. The dark gray- and blue-framed images are the wings from flies entirely kept in the dark and temporarily illuminated with a blue LED light, respectively. In panels (H) and (J), P-values were calculated by ANOVA-test; n = 10 female flies; ns, *, ** and *** are, respectively, not significant, <0.01, <1e−3, and <1e−5 between the normalized phenotypes of the arrowhead-pointed groups and those of others. In E-J, the “Ctrl” is a dCas9_fly line without Gal4 driver.CC BY · PubMed Central
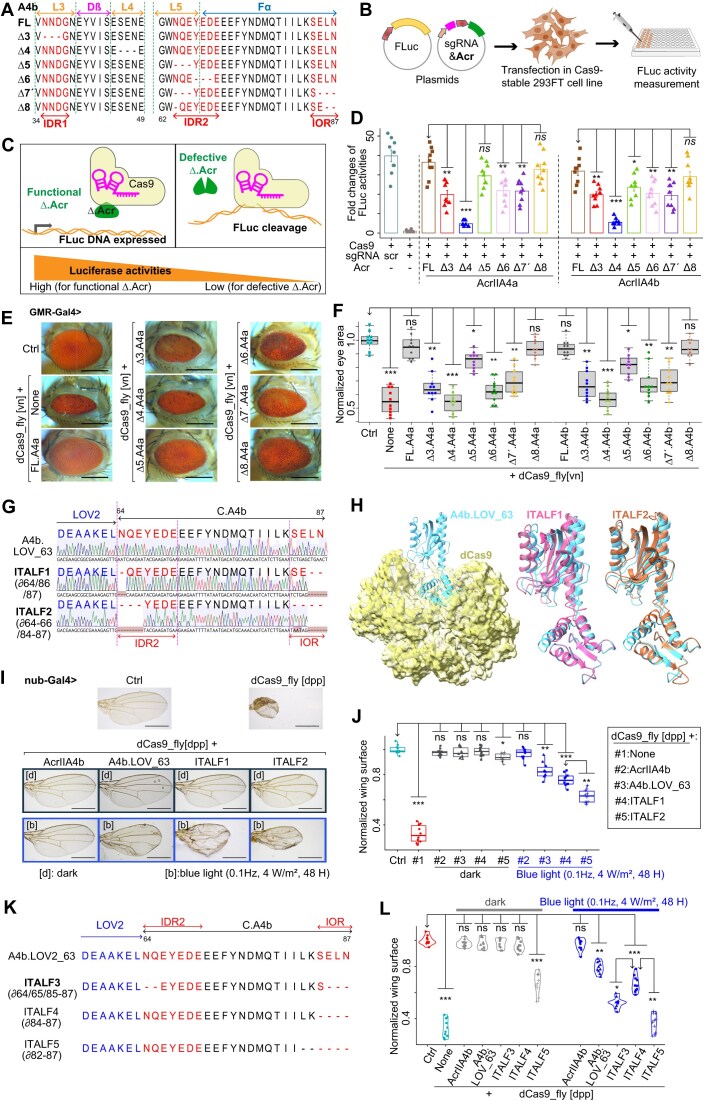
Figure 4. Optimization of A4b.LOV_63 photoswitchability in vivo by truncation of IDR2 and IOR. (A) Partial amino acid sequences of truncated AcrIIA4b variants aligned with the full-length one (FL). ∆7′ indicates a double truncation, and ∆8 is the deletion of tree residues in AcrIIA4b (∂64/86/87). The secondary structures are outlined. (B) Experimental design for testing the inhibitory efficiency of truncated Acrs. Cells stably expressing Cas9 were co-transfected with each truncated Acr, sgRNA targeting Luciferase, and a reporter Firefly Luciferase. (C) Rationale behind the identification of truncatable residues of Acr: high Luciferase activity indicates the truncated residues are not necessary for the Cas9-inhibiting functionality of the Acr variant, and vice versa. (D) Plot showing the results of Firefly Luciferase activities targeted by Cas9 according to the inhibition efficiency of co-transfected Acr. The AcrIIA4a&b are truncated corresponding to panel (A) and Supplementary Fig. S7A and B; “scr” means scrambled sgRNA. Bars represent mean values, error bars the standard deviation, and dots individual data points from n = 9. (E) Representative images of compound eyes from Drosophila co-expressing dCas9_fly and FL or truncated AcrIIA4a&b proteins mentioned in panel (A) and Supplementary Fig. S7A and B. (F) Quantitative data of eye surface area from dCas9_fly drosophila expressing truncated AcrIIA4A&b. (G) Partial sequence graphs of IOR/IDR-truncated Acr–LOV2 complexes ITALF1 and ITALF2 aligned with A4b.LOV_63, featuring their truncated residues ∂64/86/87 and ∂64–66/84–87, respectively. The sequence graphs were aligned with Benchling platform; the dashes or codons in blossom color are deletions or mismatches. (H) Generated alphaFold of ITALF1 (magenta) and ITALF2 (coral), aligned with A4b.LOV_63 (cyan), which interacts with dCas9 (yellow). Representative images (I) and statistical data (J) of wing phenotypes from dCas9_fly flies expressing Acr–LOV2 complexes in panels (G) and (H), and kept in the dark or exposed to blue-light pulse at the pupal stage. (K) Partial sequence graphs and corresponding peptide sequences of ITALF3, ITALF4, and ITALF5, whose residues 64–65/85–87, 84–87, and 82–87, respectively, are truncated, and aligned with A4b.LOV_63. (L) Statistical data set of normalized wing sizes from dCas9_fly drosophila expressing Acr–LOV2 complexes in panel (K), displaying the high and marginal photoswitchabilities of ITALF3 and ITALF4, respectively, and disrupted functionality of ITALF5. The scale bars in panels (E) and (I) are, respectively, 250 and 500 μm. In panels (G) and (K), the residues in blue and red are LOV2 and IDR2 plus IOR of C.AcrIIA4b. The dash (-) represents a single residue deletion. In panels (D), (F), (J), and (L), the “Ctrl” is a dCas9_fly line without Gal4. Also, the P-values * <.01, ** <1e−3, *** <1e−5 were calculated by one-way analysis of variance (ANOVA) of the differences between the normalized and quantified Luciferase activities [for panel (D)] or phenotypes [for panels (F), (J), and (L); with n = 10 female flies] of the arrowhead-pointed groups and those of others. In all panels, ∂ (lower case “Delta”) and ∆ (upper case “Delta”) refer to single and more than one residue deletions, respectively.
Figure 4. Optimization of A4b.LOV_63 photoswitchability in vivo by truncation of IDR2 and IOR. (A) Partial amino acid sequences of truncated AcrIIA4b variants aligned with the full-length one (FL). ∆7′ indicates a double truncation, and ∆8 is the deletion of tree residues in AcrIIA4b (∂64/86/87). The secondary structures are outlined. (B) Experimental design for testing the inhibitory efficiency of truncated Acrs. Cells stably expressing Cas9 were co-transfected with each truncated Acr, sgRNA targeting Luciferase, and a reporter Firefly Luciferase. (C) Rationale behind the identification of truncatable residues of Acr: high Luciferase activity indicates the truncated residues are not necessary for the Cas9-inhibiting functionality of the Acr variant, and vice versa. (D) Plot showing the results of Firefly Luciferase activities targeted by Cas9 according to the inhibition efficiency of co-transfected Acr. The AcrIIA4a&b are truncated corresponding to panel (A) and Supplementary Fig. S7A and B; “scr” means scrambled sgRNA. Bars represent mean values, error bars the standard deviation, and dots individual data points from n = 9. (E) Representative images of compound eyes from Drosophila co-expressing dCas9_fly and FL or truncated AcrIIA4a&b proteins mentioned in panel (A) and Supplementary Fig. S7A and B. (F) Quantitative data of eye surface area from dCas9_fly drosophila expressing truncated AcrIIA4A&b. (G) Partial sequence graphs of IOR/IDR-truncated Acr–LOV2 complexes ITALF1 and ITALF2 aligned with A4b.LOV_63, featuring their truncated residues ∂64/86/87 and ∂64–66/84–87, respectively. The sequence graphs were aligned with Benchling platform; the dashes or codons in blossom color are deletions or mismatches. (H) Generated alphaFold of ITALF1 (magenta) and ITALF2 (coral), aligned with A4b.LOV_63 (cyan), which interacts with dCas9 (yellow). Representative images (I) and statistical data (J) of wing phenotypes from dCas9_fly flies expressing Acr–LOV2 complexes in panels (G) and (H), and kept in the dark or exposed to blue-light pulse at the pupal stage. (K) Partial sequence graphs and corresponding peptide sequences of ITALF3, ITALF4, and ITALF5, whose residues 64–65/85–87, 84–87, and 82–87, respectively, are truncated, and aligned with A4b.LOV_63. (L) Statistical data set of normalized wing sizes from dCas9_fly drosophila expressing Acr–LOV2 complexes in panel (K), displaying the high and marginal photoswitchabilities of ITALF3 and ITALF4, respectively, and disrupted functionality of ITALF5. The scale bars in panels (E) and (I) are, respectively, 250 and 500 μm. In panels (G) and (K), the residues in blue and red are LOV2 and IDR2 plus IOR of C.AcrIIA4b. The dash (-) represents a single residue deletion. In panels (D), (F), (J), and (L), the “Ctrl” is a dCas9_fly line without Gal4. Also, the P-values * <.01, ** <1e−3, *** <1e−5 were calculated by one-way analysis of variance (ANOVA) of the differences between the normalized and quantified Luciferase activities [for panel (D)] or phenotypes [for panels (F), (J), and (L); with n = 10 female flies] of the arrowhead-pointed groups and those of others. In all panels, ∂ (lower case “Delta”) and ∆ (upper case “Delta”) refer to single and more than one residue deletions, respectively.CC BY · PubMed Central
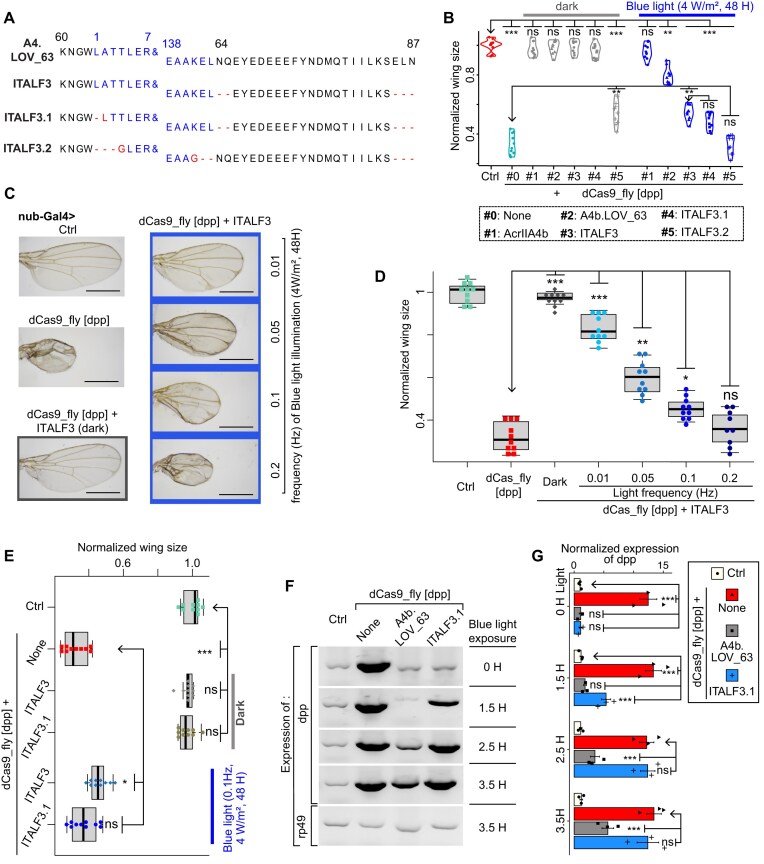
Figure 5. Mutation of LOV2 and adjustment of light properties of ITALF3. (A) Peptide sequences of ITALF3, ITALF3.1 and ITALF3.2, whose LOV2 (in blue) of which are truncated, and aligned with A4b.LOV_63 and ITALF3. The ampersand signs (&) are 8–137 residues of LOV2. The dash and letter in red represent truncated and mutated residues. (B) Plot of normalized wing sizes from dCas9_fly drosophila expressing Acr–LOV2 complexes in panel (A). It shows that ITALF3.1 is marginally light-sensitive than ITALF3, and ITALF3.2 is dysfunctional. The larvae of these flies were kept in the dark or irradiated with blue light (~0.08 Hz, 4 mW/m2 for 48 h). Representative images (C) and statistical data (D) of comparison of wing phenotypes from ITALF3 exposed at different light frequency at a larval stage. The wings were from fly adults, the larvae of which were kept in dark or irradiated with blue light (4 mW/m2 for 48 h). (E) Comparison of ITALF3 and ITALF3.1: statistics of wing phenotypes from dCas9_fly drosophila, expressing ITALF3 or ITALF3.1, and the larvae of which were exposed to blue light (0.1 Hz, 4 W/m2, 48 h). Gel images (F) and quantitative data (G) of RT-PCR results showing the light-sensitivity of ITALF3.1 compared to A4b.LOV_63. The RNAs were extracted from early hatched fly wings right after light exposure. The expression of rp49 represents a loading control. In panels (B), (D), (E), and (G), the labels ns, *, **, *** are P-values not significant, <0.01, <1e−3, and <1e−5, respectively, that were calculated by ANOVA-test of the difference between the normalized wing sizes or eye surface area of the arrowhead-pointed groups and those of others. In panels (B)–(G), the “Ctrl” is a dCas9_fly line without Gal4.
Figure 5. Mutation of LOV2 and adjustment of light properties of ITALF3. (A) Peptide sequences of ITALF3, ITALF3.1 and ITALF3.2, whose LOV2 (in blue) of which are truncated, and aligned with A4b.LOV_63 and ITALF3. The ampersand signs (&) are 8–137 residues of LOV2. The dash and letter in red represent truncated and mutated residues. (B) Plot of normalized wing sizes from dCas9_fly drosophila expressing Acr–LOV2 complexes in panel (A). It shows that ITALF3.1 is marginally light-sensitive than ITALF3, and ITALF3.2 is dysfunctional. The larvae of these flies were kept in the dark or irradiated with blue light (~0.08 Hz, 4 mW/m2 for 48 h). Representative images (C) and statistical data (D) of comparison of wing phenotypes from ITALF3 exposed at different light frequency at a larval stage. The wings were from fly adults, the larvae of which were kept in dark or irradiated with blue light (4 mW/m2 for 48 h). (E) Comparison of ITALF3 and ITALF3.1: statistics of wing phenotypes from dCas9_fly drosophila, expressing ITALF3 or ITALF3.1, and the larvae of which were exposed to blue light (0.1 Hz, 4 W/m2, 48 h). Gel images (F) and quantitative data (G) of RT-PCR results showing the light-sensitivity of ITALF3.1 compared to A4b.LOV_63. The RNAs were extracted from early hatched fly wings right after light exposure. The expression of rp49 represents a loading control. In panels (B), (D), (E), and (G), the labels ns, *, **, *** are P-values not significant, <0.01, <1e−3, and <1e−5, respectively, that were calculated by ANOVA-test of the difference between the normalized wing sizes or eye surface area of the arrowhead-pointed groups and those of others. In panels (B)–(G), the “Ctrl” is a dCas9_fly line without Gal4.CC BY · PubMed Central
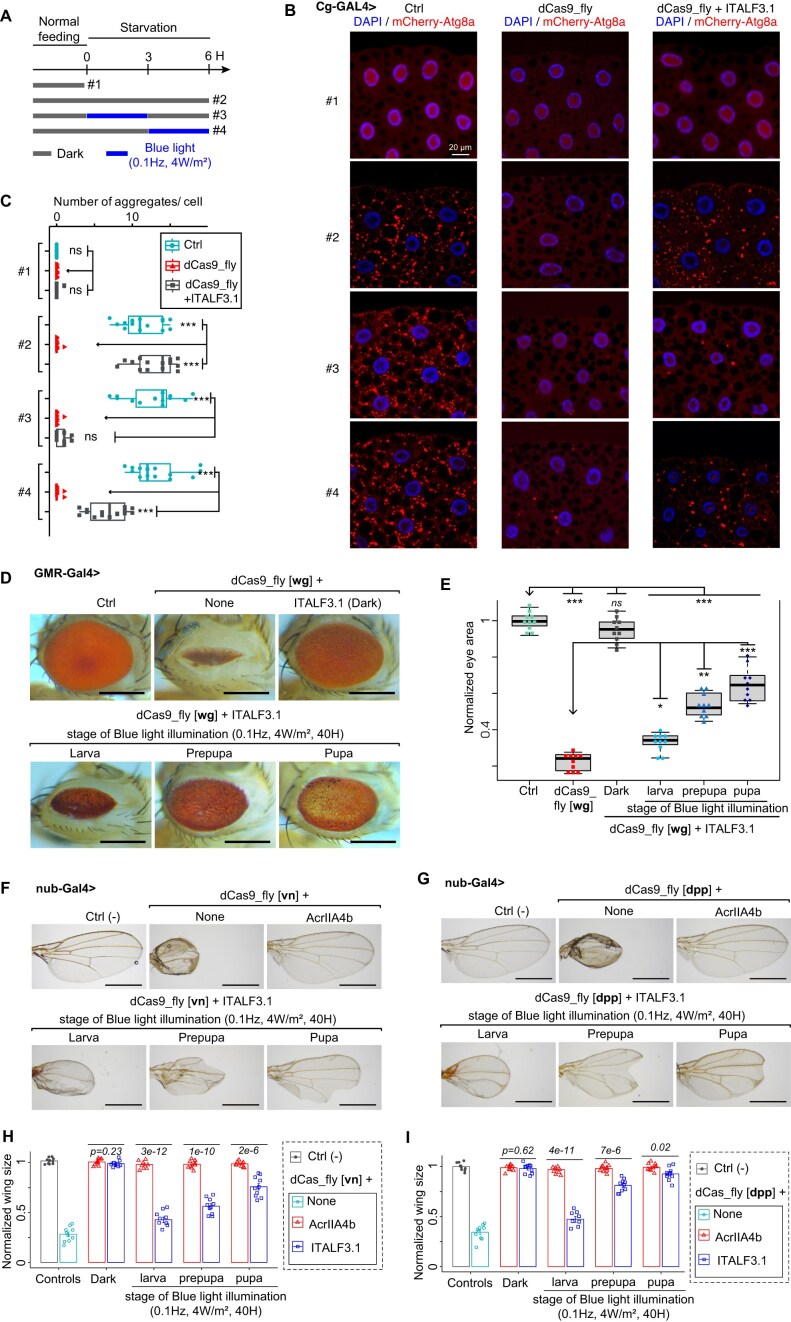
Figure 6. Application of ITALF on targeting different tissues and genes in vivo. (A) Experimental paradigm for investigating ITALF3.1-mediated Wnt4 EnGup through expression of mCherry–Atg8a (in red). Larvae were normally fed or starved either in the dark (dark gray lines) or under a blue light (blue lines), before mounting their adipose tissues. (B) Confocal images of L3 fat body adipocytes showing localization and expression of mCherry–Atg8a in red (driven by Cg-GAL4). Nuclei stained with DAPI (blue). (C) Plot quantifying mCherry–Atg8a puncta per cell from data in panel (B). (D) Image samples illustrate the eye phenotypes of dCas9_fly drosophila adults expressing ITALF3.1. These flies, whose larvae, prepupae or pupae were illuminated under a blue light pulse (0.1 Hz, 4 mW/m2 for 40 h), expressed wg EnGup. The scale bars are 250 μm. (E) Plot summarizes the data in panel (D). Representative images of wing phenotypes from dCas9_fly flies, expressing ITALF3.1 or AcrIIA4b and dCas9_fly targeting vn gene in panel (F) or dpp in panel (G). The larvae, prepupa, or pupae of these flies were irradiated with blue light (0.1 Hz, 0.4 mW/cm2) for 40 h. The scale bars are 500 μm. Statistics from panel (F) in panel (H) and panel (G) in panel (I). P-values calculated by ANOVA-test are the mean of normalized wing sizes from dCas9_fly flies expressing ITALF3.1 compared to those expressing AcrIIA4b. In panels (C) and (E), the labels ns, *, **, *** are P-values not significant, <0.01, <1e−3, and <1e−5, respectively, which were calculated by ANOVA-test of the difference between the mCherry–Atg8a puncta per cell (for panel C) and normalized eye area (for panel E) of the arrowhead-pointed groups and those of others. In panels (D)–(I), the “Ctrl” is a dCas9_fly line without Gal4.
Figure 6. Application of ITALF on targeting different tissues and genes in vivo. (A) Experimental paradigm for investigating ITALF3.1-mediated Wnt4 EnGup through expression of mCherry–Atg8a (in red). Larvae were normally fed or starved either in the dark (dark gray lines) or under a blue light (blue lines), before mounting their adipose tissues. (B) Confocal images of L3 fat body adipocytes showing localization and expression of mCherry–Atg8a in red (driven by Cg-GAL4). Nuclei stained with DAPI (blue). (C) Plot quantifying mCherry–Atg8a puncta per cell from data in panel (B). (D) Image samples illustrate the eye phenotypes of dCas9_fly drosophila adults expressing ITALF3.1. These flies, whose larvae, prepupae or pupae were illuminated under a blue light pulse (0.1 Hz, 4 mW/m2 for 40 h), expressed wg EnGup. The scale bars are 250 μm. (E) Plot summarizes the data in panel (D). Representative images of wing phenotypes from dCas9_fly flies, expressing ITALF3.1 or AcrIIA4b and dCas9_fly targeting vn gene in panel (F) or dpp in panel (G). The larvae, prepupa, or pupae of these flies were irradiated with blue light (0.1 Hz, 0.4 mW/cm2) for 40 h. The scale bars are 500 μm. Statistics from panel (F) in panel (H) and panel (G) in panel (I). P-values calculated by ANOVA-test are the mean of normalized wing sizes from dCas9_fly flies expressing ITALF3.1 compared to those expressing AcrIIA4b. In panels (C) and (E), the labels ns, *, **, *** are P-values not significant, <0.01, <1e−3, and <1e−5, respectively, which were calculated by ANOVA-test of the difference between the mCherry–Atg8a puncta per cell (for panel C) and normalized eye area (for panel E) of the arrowhead-pointed groups and those of others. In panels (D)–(I), the “Ctrl” is a dCas9_fly line without Gal4.CC BY · PubMed Central

Verification

Claims the paper makes

The claims and statistics of this paper haven’t been checked yet.

Run the check — free, no account needed. It reads the open-access text and checks the sources it cites.

A few free checks a day · papers already verified open instantly · results are public

Self-check

Percentages, sums and reported differences re-computed from the paper’s own numbers.

The self-check needs the paper’s full text.

Citations

No citation lists for this paper

No citation lists for this paper yet — checked again daily.

References 76 · Cited by 1

Research works printed but not linked: 67

  1. 10.1038/s43586-021-00091-6 · DOI
  2. 10.1016/j.tins.2022.09.002 · DOI
  3. 10.1038/nchembio.2343 · DOI
  4. 10.1016/j.devcel.2021.11.016 · DOI
  5. 10.15252/embr.201947999 · DOI
  6. 10.1016/j.devcel.2019.01.009 · DOI
  7. 10.1073/pnas.1800677115 · DOI
  8. 10.1093/nar/gkw063 · DOI
  9. 10.1126/science.aah3404 · DOI
  10. 10.1016/j.molcel.2023.09.010 · DOI
  11. 10.1016/j.molcel.2023.04.002 · DOI
  12. 10.1016/j.molcel.2024.06.022 · DOI
  13. 10.1016/j.molcel.2020.05.032 · DOI
  14. 10.1016/j.molcel.2021.01.013 · DOI
  15. 10.1016/j.molcel.2022.09.021 · DOI
  16. 10.1021/cr400525m · DOI
  17. 10.1038/nature25762 · DOI · Paper page
  18. 10.1016/j.molcel.2015.01.013 · DOI · Paper page
  19. 10.1038/s41586-023-07004-5 · DOI
  20. 10.1073/pnas.2304302120 · DOI · Paper page
  21. 10.1093/nar/gkae969 · DOI
  22. 10.2147/IJN.S479068 · DOI
  23. 10.1021/bi701543e · DOI · Paper page
  24. 10.1093/nar/gkaa1198 · DOI
  25. 10.1038/s41592-018-0178-9 · DOI
  26. 10.1093/nar/gkad995 · DOI
  27. 10.1038/nature22377 · DOI
  28. 10.1073/pnas.2023202118 · DOI
  29. 10.1016/j.molcel.2018.11.016 · DOI
  30. 10.1016/j.cell.2016.12.009 · DOI
  31. 10.1126/sciadv.1701620 · DOI
  32. 10.1016/j.molcel.2018.11.011 · DOI
  33. 10.1073/pnas.1422401112 · DOI
  34. 10.1016/j.tibtech.2006.07.005 · DOI
  35. 10.1021/acs.jpclett.6b01484 · DOI
  36. 2020, Intrinsic disorder is essential for Cas9 inhibition of anti-CRISPR AcrIIA5, Nucleic Acids Research, 48, 7584
  37. 10.1038/s41467-020-17836-8 · DOI
  38. 10.1038/s41467-023-38993-6 · DOI
  39. 10.1038/s41467-020-18816-8 · DOI
  40. 2017, Light-induced conformational changes of LOV2-kinase and the linker region in <iArabidopsis> Phototropin2, J. Phys. Chem. B, 121, 4414, 10.1021/acs.jpcb.7b01552 · DOI
  41. 10.1016/j.bpj.2010.10.005 · DOI
  42. 10.1016/j.devcel.2021.11.016 · DOI
  43. 10.1080/00207454.2018.1557168 · DOI
  44. 2020, Regulation of expression of autophagy genes by Atg8a-interacting partners Sequoia, YL-1, and Sir2, Drosophila. Cell Reports, 31, 107695, 10.1016/j.celrep.2020.107695 · DOI
  45. 10.1016/j.ydbio.2007.04.011 · DOI
  46. Legent, K. and Treisman, J.E. (2008) Wingless dignaling in Drosophila eye development. In Vincan, E. (ed), Wnt Signaling, Methods in Molecular Biology. Humana Press, Totowa, NJ, Vol. 469, pp. 141–161. · DOI
  47. 10.7554/eLife.22546 · DOI
  48. 10.1073/pnas.1217538110 · DOI
  49. 10.1016/j.tig.2004.07.013 · DOI
  50. 10.1242/dev.121.3.785 · DOI
  51. 10.1099/mic.0.000635 · DOI
  52. 10.1038/nbt.2647 · DOI · Paper page
  53. 10.1038/s41591-018-0050-6 · DOI · Paper page
  54. 10.1016/j.omtm.2018.04.008 · DOI
  55. 10.1038/s41467-018-08158-x · DOI
  56. 10.1093/nar/gkab1082 · DOI
  57. 10.1038/s41467-021-24773-7 · DOI
  58. 10.1002/prot.25966 · DOI
  59. 10.1016/j.gpb.2019.01.004 · DOI · Paper page
  60. 10.1186/s12964-020-00703-w · DOI
  61. 10.1074/jbc.M800375200 · DOI
  62. 10.1038/ncomms15231 · DOI
  63. 10.1534/genetics.109.103630 · DOI
  64. 10.1038/s41422-023-00798-z · DOI
  65. Jia, Y. , Shen, D. , Wang, X. , Sun, J. , Peng, P. , Xu, R.-G. , Xu, B. and Ni, J.-Q . (2019) flySAM Transgenic CRISPRa System Manual. BIO-PROTOCOL, 9. · DOI
  66. 10.1126/science.1247005 · DOI · Paper page
  67. 10.1016/j.micres.2020.126488 · DOI

Metadata

Authors
Ramongolalaina, C., Pastor-Pareja, J. C., Zhang, E., & Jia, Y.
Affiliations
  • Center for Life Sciences (CN)
  • Consejo Superior de Investigaciones Científicas (ES)
  • Tsinghua University (CN)
  • Shanxi Medical University (CN)
Corresponding author
Jia, Yichang
Venue
Nucleic Acids Research
Publisher
openRxiv
Published
2025-05-02
Volume
54
Issue
9
ISSN
0305-1048 (ISSN-L)
OpenAlex
W7160296454
Cited by
1
References
76
Citations by year
2026: 1
FWCI
2.07
Type
journal article
Language
en
Open access
Locations
  • Nucleic Acids Research (publishedVersion, cc-by)
  • bioRxiv (Cold Spring Harbor Laboratory) (acceptedVersion, cc-by-nd)
  • PubMed (publishedVersion)
  • PubMed Central (publishedVersion, cc-by)
  • DIGITAL.CSIC (Spanish National Research Council (CSIC)) (submittedVersion, other-oa)
Funders
  • Changping Laboratory (2025B-07-08)
  • Ministerio de Ciencia, Innovación y Universidades (CEX2021-001165-S)
  • National Natural Science Foundation of China (PID2021-122119NB-I00)
Topics
  • Life Sciences › Biochemistry, Genetics and Molecular Biology › Molecular Biology › CRISPR and Genetic Engineering
  • Life Sciences › Neuroscience › Cellular and Molecular Neuroscience › Photoreceptor and optogenetics research
  • Physical Sciences › Materials Science › Materials Chemistry › Photochromic and Fluorescence Chemistry
Keywords
optogenetics, anti-CRISPR proteins, CRISPR activation, endogenous gene regulation, Drosophila, intrinsically disordered regions, light-regulated gene expression, blue light, protein engineering
MeSH terms
Blue Light, Animals, Drosophila, Drosophila melanogaster, Gene Expression Regulation, Light, Drosophila Proteins, Optogenetics, Clustered Regularly Interspaced Short Palindromic Repeats, CRISPR-Cas Systems

About these checks

Registry, retraction, Cites and statistics results are computed, not judged, with one exception: a printed reference that no index lists is read once by a model before it counts as a citation error. Claims are extracted by a model and kept only when their quote appears verbatim in the text; each cited source is then checked, with a model’s help, for whether it says what the claim relies on. Those verdicts can be wrong — read the claim’s quote and the cited source before relying on one.

Statistics and arithmetic are recomputed, not judged.

Confidence bands are shown only for fields calibrated on our annotated test set. None is calibrated yet, so no band is shown.

What counts as a claim ›How we measure confidence ›How we check this ›

Are you an author, or do you see a problem with this page? Request a review

How to cite

Cite CoChat for the checks on this page, and the paper for its own findings.

This page
CoChat. (2026). Citation check: Optimized optogenetic anti-CRISPR for endogenous gene regulation in Drosophila. https://app.cochat.ai/papers/10.1101/2025.05.02.651826
The paper
Ramongolalaina, C., Pastor-Pareja, J. C., Zhang, E., & Jia, Y. (2025). Optimized optogenetic anti-CRISPR for endogenous gene regulation in Drosophila. Nucleic Acids Research. https://doi.org/10.1101/2025.05.02.651826