PreprintCited by 2Genetic and Kidney Cyst DiseasesCystic Fibrosis Research AdvancesGenomics and Rare Diseases

The DOI matches its Crossref record; its reference list is not available.

Functional classification of GNAI1 disorder variants in C. elegans uncovers conserved and cell-specific mechanisms of dysfunction

Open access

Preprint — published as 10.1093/genetics/iyaf216 · Paper page

Abstract

Heterotrimeric G proteins transduce signals from G protein coupled receptors, which mediate key aspects of neuronal development and function. Mutations in the GNAI1 gene, which encodes Gαi1, cause a disorder characterized by developmental delay, intellectual disability, hypotonia, and epilepsy. However, the mechanistic basis for this disorder remains unknown. Here, we show that GNAI1 is required for ciliogenesis in human cells and use C. elegans as a whole-organism model to determine the functional impact of seven GNAI1 -disorder patient variants. Using CRISPR-Cas9 editing in combination with robust cellular (cilia morphology) and behavioral (chemotaxis) assays, we find that T48I , K272R , A328P , and V334E orthologous variants impact both cilia assembly and function in AWC neurons, M88V and I321T have no impact on either phenotype, and D175V exerts neuron-specific effects on cilia-dependent sensory behaviors. Finally, we validate in human ciliated cell lines that D173V , K270R , and A326P GNAI1 variants disrupt ciliary localization of the encoded human Gαi1 proteins similarly to their corresponding orthologous substitutions in the C. elegans ODR-3 (D175V , K272R , and A328P ). Overall, our findings determine the in vivo effects of orthologous GNAI1 variants and contribute to mechanistic understanding of GNAI1 disorder pathogenesis as well as neuron-specific roles of ODR-3 in sensory biology. ARTICLE SUMMARY: Gα subunits of heterotrimeric G proteins transduce signaling from G protein coupled receptors and play important roles in cell communication and complex behaviors. Mutations in the GNAI1 gene, which encodes Gαi1 protein, have been recently linked to a neurodevelopmental disorder; however, it remains unknown how GNAI1 patient mutations disrupt neuronal development or function to manifest in disease. We demonstrate that GNAI1 is required for ciliogenesis and use C. elegans as a whole-animal model in combination with human cells to identify cell-specific and conserved mechanisms of Gα dysfunction.

Overview

The claims and statistics of this paper haven’t been checked yet.

Run the check — free, no account needed. It reads the open-access text and checks the sources it cites.

A few free checks a day · papers already verified open instantly · results are public

Integrity signals

Registry

Crossref · 10.1101/2025.08.18.670960

Cites

Statistics

Figures

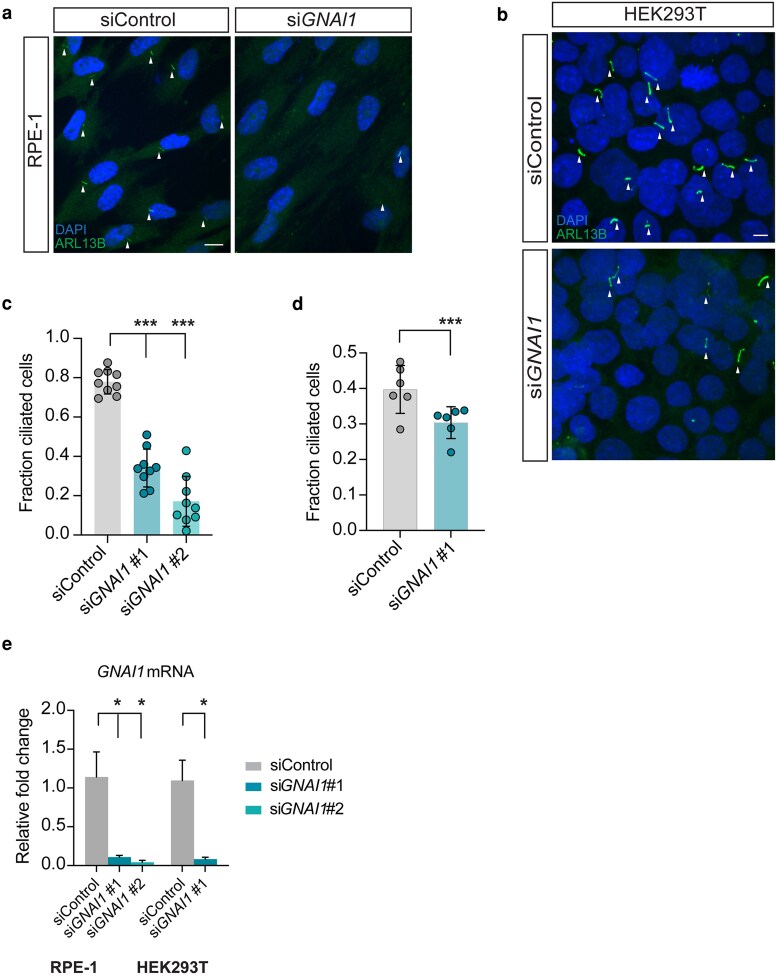
Fig. 1. GNAI1 knockdown impairs ciliogenesis in human cells. a, b) Immunofluorescence images of fixed a) RPE-1 and b) HEK293T cells transfected with the indicated siRNAs. Arrowheads mark cilia labeled with anti-ARL13B antibody. Scale: 10 μm. c, d) Quantification of ciliation in c) RPE-1 and d) HEK293T cells transfected with the indicated siRNAs. Each data point represents 1 replicate. Total number of cells: siControl (n = 858 RPE-1, n = 4,460 HEK293T), siGNAI1 #1 (n = 518 RPE-1, n = 4,600 HEK293T), siGNAI1 #2 (n = 400). Means ± SD are indicated by shaded and vertical bars, respectively. ***Different from control at P < 0.001 (Fisher's exact test). e) Relative levels of GNAI1 mRNA in RPE-1 and HEK293T cells treated with the indicated siRNAs. Summary data represent 4 replicates per condition per cell type. Error bars are SEM. *Different from control at P < 0.05 (Mann–Whitney test).
Fig. 1. GNAI1 knockdown impairs ciliogenesis in human cells. a, b) Immunofluorescence images of fixed a) RPE-1 and b) HEK293T cells transfected with the indicated siRNAs. Arrowheads mark cilia labeled with anti-ARL13B antibody. Scale: 10 μm. c, d) Quantification of ciliation in c) RPE-1 and d) HEK293T cells transfected with the indicated siRNAs. Each data point represents 1 replicate. Total number of cells: siControl (n = 858 RPE-1, n = 4,460 HEK293T), siGNAI1 #1 (n = 518 RPE-1, n = 4,600 HEK293T), siGNAI1 #2 (n = 400). Means ± SD are indicated by shaded and vertical bars, respectively. ***Different from control at P < 0.001 (Fisher's exact test). e) Relative levels of GNAI1 mRNA in RPE-1 and HEK293T cells treated with the indicated siRNAs. Summary data represent 4 replicates per condition per cell type. Error bars are SEM. *Different from control at P < 0.05 (Mann–Whitney test).CC BY · PubMed Central
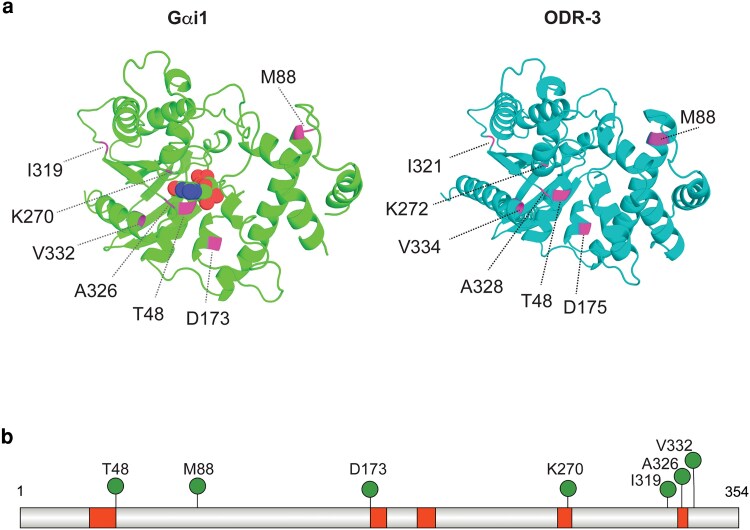
Fig. 2. Distribution of patient variants selected for analysis. a) Left: 3D structure of Gαi1 bound to GDP (PDB accession: 2G83) (Johnston et al. 2006). Carbon, oxygen, nitrogen, and phosphorous atoms of GDP are shown as green, red, blue, and orange spheres, respectively. Right: AlphaFold-predicted structure of C. elegans ODR-3 (Varadi et al. 2022, 2024). Positions of missense patient variants that were selected for analysis are shown in magenta in both protein models. The protein structures for Gαi1 and ODR-3 were generated in the PyMOL Molecular Graphics System, Version 3.1.4 (Schrodinger, LLC). b) Schematic of human Gαi1 showing positions of GNAI1-disorder-associated variants (pins). Guanine nucleotide-binding motifs (G1 to G5 boxes) are shown in red. The Gαi1 protein diagram was generated using IBS 2.0 (Xie et al. 2022).
Fig. 2. Distribution of patient variants selected for analysis. a) Left: 3D structure of Gαi1 bound to GDP (PDB accession: 2G83) (Johnston et al. 2006). Carbon, oxygen, nitrogen, and phosphorous atoms of GDP are shown as green, red, blue, and orange spheres, respectively. Right: AlphaFold-predicted structure of C. elegans ODR-3 (Varadi et al. 2022, 2024). Positions of missense patient variants that were selected for analysis are shown in magenta in both protein models. The protein structures for Gαi1 and ODR-3 were generated in the PyMOL Molecular Graphics System, Version 3.1.4 (Schrodinger, LLC). b) Schematic of human Gαi1 showing positions of GNAI1-disorder-associated variants (pins). Guanine nucleotide-binding motifs (G1 to G5 boxes) are shown in red. The Gαi1 protein diagram was generated using IBS 2.0 (Xie et al. 2022).CC BY · PubMed Central
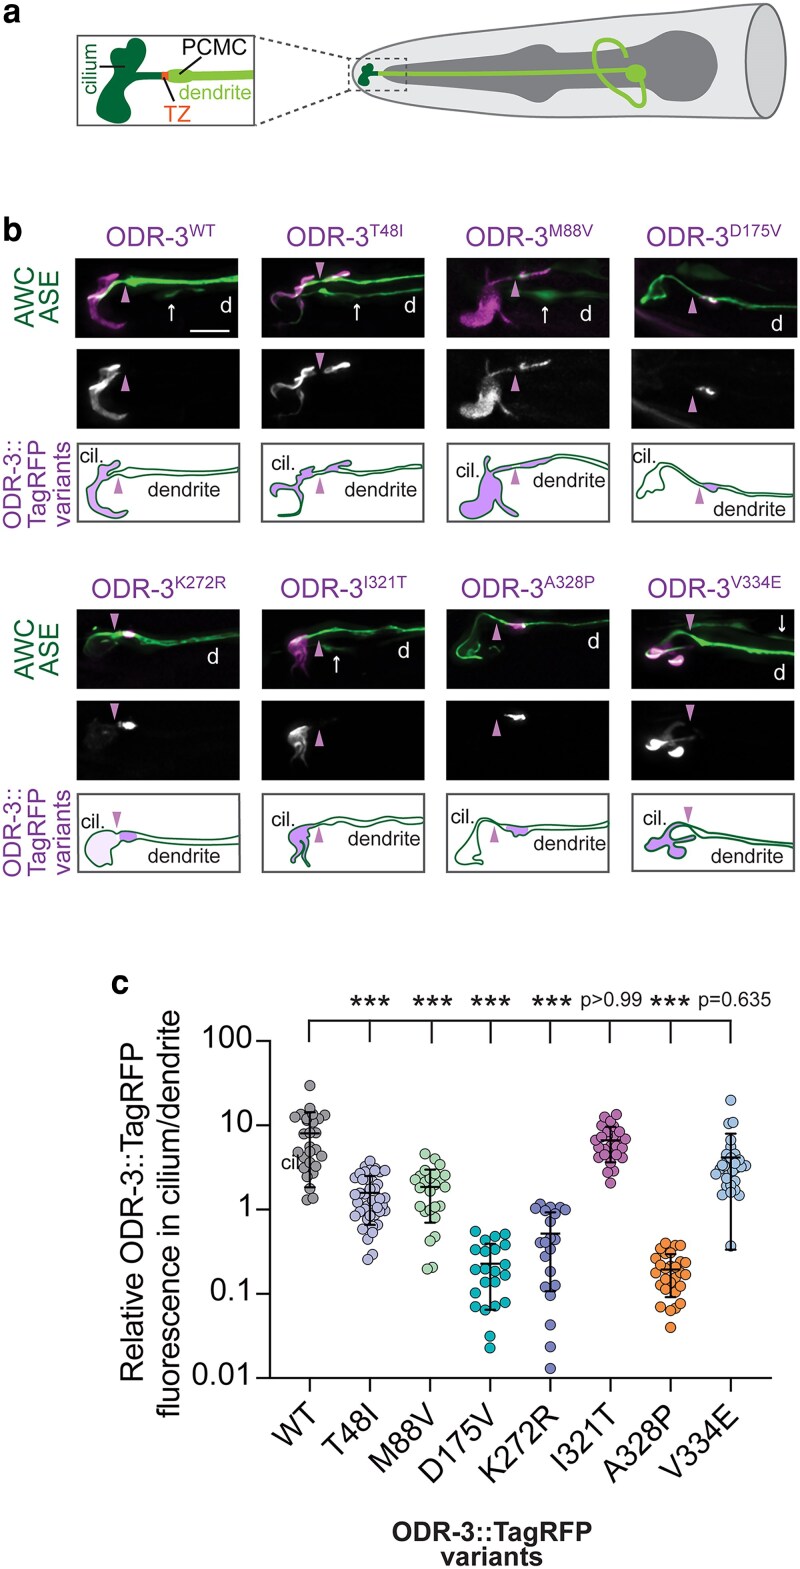
Fig. 3. Orthologous patient mutations in the odr-3 gene differentially affect subcellular localization of the encoded proteins. a) Diagram of the AWC olfactory neuron in the worm nose (only 1 AWC of a pair is shown for simplicity). The region inside of the dashed box is magnified in a panel on the left. TZ, transition zone; PCMC, periciliary membrane compartment. b) Representative images and cartoon summaries (bottom rows) showing localization of the indicated TagRFP-tagged ODR-3 variants in AWC neurons. AWC neurons were visualized via expression of ceh-36p::GFP, which also labels ASE neurons (arrows). Arrowheads mark cilia base/TZ. d, dendrite. Anterior is at the left. Scale: 5 μm. c) Quantification of relative TagRFP fluorescence inside the AWC cilium vs distal dendrite for the indicated TagRFP-tagged ODR-3 variants. Total number of AWC neurons analyzed for each variant: WT (n = 27), T48I (n = 42), M88V (n = 26), D175V (n = 22), K272R (n = 21), I321T (n = 26), A328P (n = 28), and V334E (n = 29). Means ± SD are indicated by horizontal and vertical bars, respectively. ***Different from WT at P < 0.001 (Kruskal–Wallis with Dunn's multiple comparisons test).
Fig. 3. Orthologous patient mutations in the odr-3 gene differentially affect subcellular localization of the encoded proteins. a) Diagram of the AWC olfactory neuron in the worm nose (only 1 AWC of a pair is shown for simplicity). The region inside of the dashed box is magnified in a panel on the left. TZ, transition zone; PCMC, periciliary membrane compartment. b) Representative images and cartoon summaries (bottom rows) showing localization of the indicated TagRFP-tagged ODR-3 variants in AWC neurons. AWC neurons were visualized via expression of ceh-36p::GFP, which also labels ASE neurons (arrows). Arrowheads mark cilia base/TZ. d, dendrite. Anterior is at the left. Scale: 5 μm. c) Quantification of relative TagRFP fluorescence inside the AWC cilium vs distal dendrite for the indicated TagRFP-tagged ODR-3 variants. Total number of AWC neurons analyzed for each variant: WT (n = 27), T48I (n = 42), M88V (n = 26), D175V (n = 22), K272R (n = 21), I321T (n = 26), A328P (n = 28), and V334E (n = 29). Means ± SD are indicated by horizontal and vertical bars, respectively. ***Different from WT at P < 0.001 (Kruskal–Wallis with Dunn's multiple comparisons test).CC BY · PubMed Central
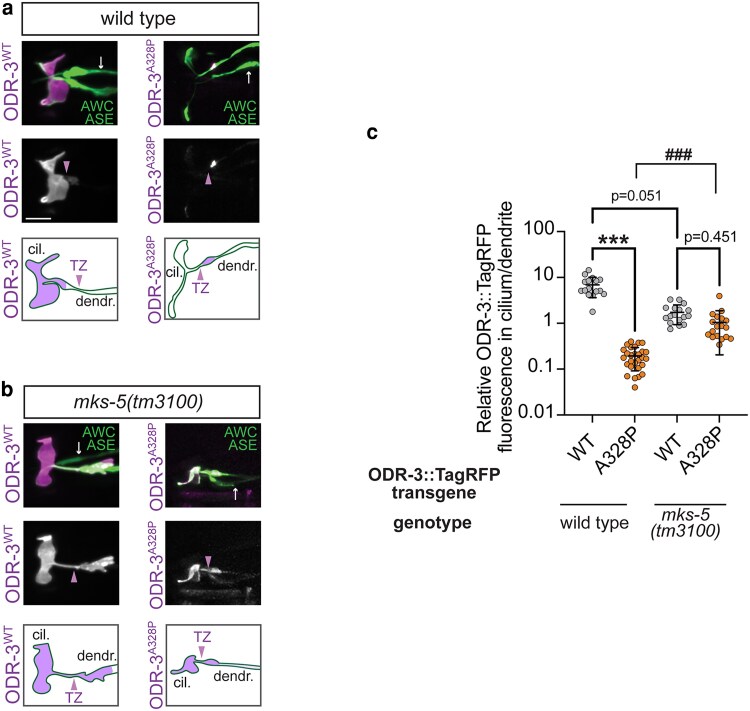
Fig. 4. Intraciliary localization of A328P ODR-3 variant is increased in mks-5 mutants. a, b) Representative images (top and middle) and cartoons (bottom) showing localization of TagRFP-tagged ODR-3WT and ODR-3A328P proteins in AWC cilia of a) wild-type animals and b) mks-5(tm3100) mutants. AWC neurons were visualized via expression of ceh-36p::GFP, which also labels ASE neurons (arrows). Arrowheads mark cilia base/TZ. cil., cilium; dendr., dendrite. Anterior is at the left. Scale: 5 μm. c) Quantification of relative TagRFP fluorescence inside the AWC cilium vs distal dendrite for the indicated TagRFP-tagged ODR-3 variants in wild-type and mks-5(tm3100) mutant animals. Total number of AWC neurons analyzed for each variant: wild type (n = 16 ODR-3WT, n = 28 ODR-3A328P), mks-5(tm3100) (n = 17 ODR-3WT, n = 18 ODR-3A328P). Data for ODR-3WT localization in the wild-type background are repeated from Fig. 3c. Means ± SD are indicated by horizontal and vertical bars, respectively. *** and ###Different between bracketed groups at P < 0.001 (Kruskal–Wallis with Dunn's multiple comparisons test).
Fig. 4. Intraciliary localization of A328P ODR-3 variant is increased in mks-5 mutants. a, b) Representative images (top and middle) and cartoons (bottom) showing localization of TagRFP-tagged ODR-3WT and ODR-3A328P proteins in AWC cilia of a) wild-type animals and b) mks-5(tm3100) mutants. AWC neurons were visualized via expression of ceh-36p::GFP, which also labels ASE neurons (arrows). Arrowheads mark cilia base/TZ. cil., cilium; dendr., dendrite. Anterior is at the left. Scale: 5 μm. c) Quantification of relative TagRFP fluorescence inside the AWC cilium vs distal dendrite for the indicated TagRFP-tagged ODR-3 variants in wild-type and mks-5(tm3100) mutant animals. Total number of AWC neurons analyzed for each variant: wild type (n = 16 ODR-3WT, n = 28 ODR-3A328P), mks-5(tm3100) (n = 17 ODR-3WT, n = 18 ODR-3A328P). Data for ODR-3WT localization in the wild-type background are repeated from Fig. 3c. Means ± SD are indicated by horizontal and vertical bars, respectively. *** and ###Different between bracketed groups at P < 0.001 (Kruskal–Wallis with Dunn's multiple comparisons test).CC BY · PubMed Central
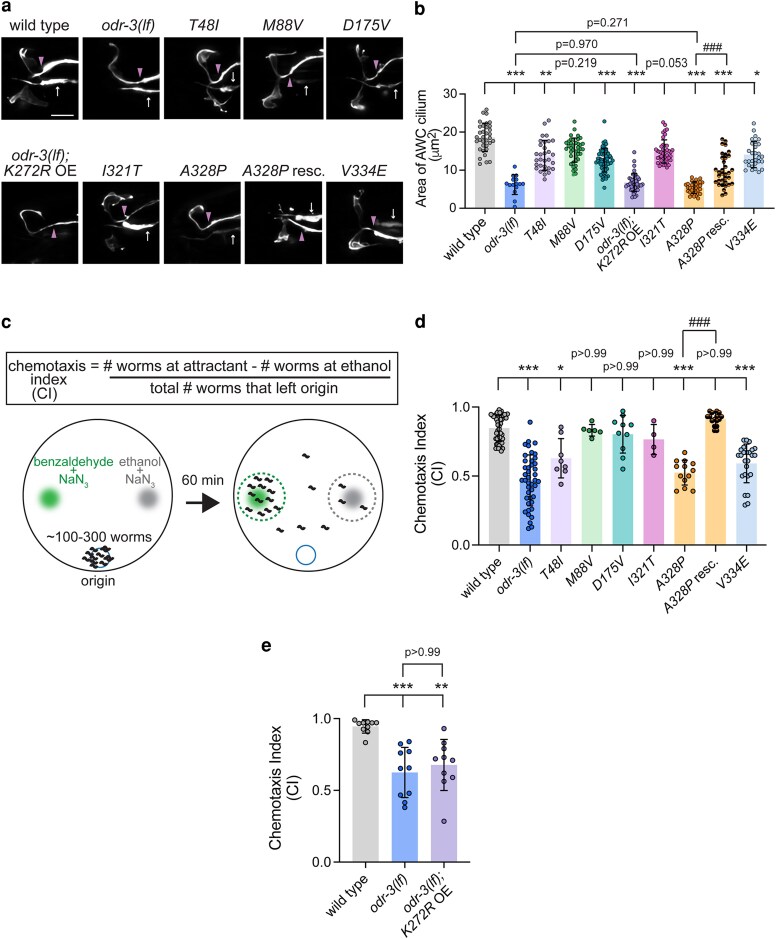
Fig. 5. Orthologous patient mutations in the odr-3 gene differentially alter AWC cilia morphology and function. a) Representative images of AWC cilia in animals homozygous for the indicated odr-3 mutations and odr-3(lf) animals overexpressing the odr-3K272R transgene. AWC neurons were visualized via expression of ceh-36p::GFP, which also labels ASE neurons (arrows). Arrowheads mark cilia base/TZ. Anterior is at the left. Scale: 5 μm. b) Quantification of AWC cilia size in the indicated genotypes. Total number of cilia: WT (n = 34), odr-3(lf) (n = 15), T48I (n = 31), M88V (n = 40), D175V (n = 59), K272R (n = 45), I321T (n = 41), A328P (n = 32), A328P rescue (n = 32), and V334E (n = 29). Means ± SD are indicated by shaded and vertical bars, respectively. *, **, and ***Different from WT at P < 0.05, 0.01, and 0.001, respectively (Kruskal–Wallis with Dunn's multiple comparisons test). ###Different between bracketed genotypes at P < 0.001 (unpaired t test with Welch's correction). c) Schematic of chemotaxis assay. d) Chemotaxis responses of the indicated homozygous variants. Individual data points represent chemotaxis index from 1 assay. Total number of assays: WT (n = 50), odr-3(lf) (n = 43), T48I (n = 8), M88V (n = 6), D175V (n = 10), I321T (n = 4), A328P (n = 13), A328P rescue (n = 16), and V334E (n = 25). Means ± SD are indicated by shaded and vertical bars, respectively. * and ***Different from wild type at P < 0.05 and 0.001, respectively (Kruskal–Wallis with Dunn's multiple comparisons test). ###Different between bracketed genotypes at P < 0.001 (unpaired t test with Welch's correction). e) Chemotaxis responses of wild-type, odr-3(lf), and odr-3(lf) mutants overexpressing odr-3K272R transgene in AWC neurons. Individual data points represent chemotaxis index from 1 assay. Total number of assays: WT (n = 10), odr-3(lf) (n = 10), and odr-3(lf); K272 OE (n = 10). Means ± SD are indicated by shaded and vertical bars, respectively. ** and ***Different from wild type at P < 0.01 and 0.001, respectively (Kruskal–Wallis with Dunn's multiple comparisons test).
Fig. 5. Orthologous patient mutations in the odr-3 gene differentially alter AWC cilia morphology and function. a) Representative images of AWC cilia in animals homozygous for the indicated odr-3 mutations and odr-3(lf) animals overexpressing the odr-3K272R transgene. AWC neurons were visualized via expression of ceh-36p::GFP, which also labels ASE neurons (arrows). Arrowheads mark cilia base/TZ. Anterior is at the left. Scale: 5 μm. b) Quantification of AWC cilia size in the indicated genotypes. Total number of cilia: WT (n = 34), odr-3(lf) (n = 15), T48I (n = 31), M88V (n = 40), D175V (n = 59), K272R (n = 45), I321T (n = 41), A328P (n = 32), A328P rescue (n = 32), and V334E (n = 29). Means ± SD are indicated by shaded and vertical bars, respectively. *, **, and ***Different from WT at P < 0.05, 0.01, and 0.001, respectively (Kruskal–Wallis with Dunn's multiple comparisons test). ###Different between bracketed genotypes at P < 0.001 (unpaired t test with Welch's correction). c) Schematic of chemotaxis assay. d) Chemotaxis responses of the indicated homozygous variants. Individual data points represent chemotaxis index from 1 assay. Total number of assays: WT (n = 50), odr-3(lf) (n = 43), T48I (n = 8), M88V (n = 6), D175V (n = 10), I321T (n = 4), A328P (n = 13), A328P rescue (n = 16), and V334E (n = 25). Means ± SD are indicated by shaded and vertical bars, respectively. * and ***Different from wild type at P < 0.05 and 0.001, respectively (Kruskal–Wallis with Dunn's multiple comparisons test). ###Different between bracketed genotypes at P < 0.001 (unpaired t test with Welch's correction). e) Chemotaxis responses of wild-type, odr-3(lf), and odr-3(lf) mutants overexpressing odr-3K272R transgene in AWC neurons. Individual data points represent chemotaxis index from 1 assay. Total number of assays: WT (n = 10), odr-3(lf) (n = 10), and odr-3(lf); K272 OE (n = 10). Means ± SD are indicated by shaded and vertical bars, respectively. ** and ***Different from wild type at P < 0.01 and 0.001, respectively (Kruskal–Wallis with Dunn's multiple comparisons test).CC BY · PubMed Central
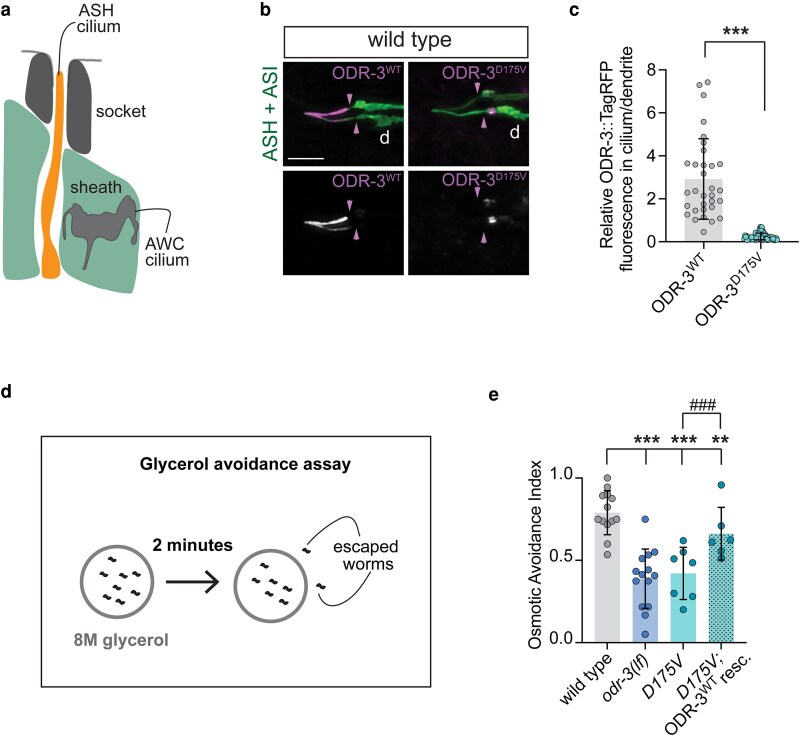
Fig. 6. The D175V variant disrupts ODR-3 localization to the ASH cilia and impairs ASH-mediated behavior. a) Schematic of the amphid channel. Only AWC and ASH cilia are shown for simplicity. Socket and sheath are glial cells that form the channel. Anterior is up. b) Representative images showing localization of TagRFP-tagged WT and D175V variants of ODR-3 in ASH and ASI neurons. ASH and ASI neurons were visualized via expression of sra-6p::GFP. Arrowheads mark cilia base/TZ. Anterior is at the left. Scale: 5 μm. c) Quantification of relative TagRFP fluorescence inside the ASH cilium vs distal dendrite for the indicated TagRFP-tagged ODR-3 variants. Total number of ASH neurons analyzed for each variant: WT (n = 32), D175V (n = 65). ***Different from WT at P < 0.001 (Mann–Whitney test). d) Diagram of glycerol avoidance assay. e) Fraction of animals that remain inside of an 8M-glycerol ring after 2 min (osmotic avoidance index). Genotypes of assayed animals are indicated. Each data point represents a mean osmotic index per genotype per day. Three to 8 technical replicates were assayed per genotype per day. Total number of assayed animals: WT (n = 298), odr-3(lf) (n = 264), D175V (n = 224), D175 rescue (n = 157). Means ± SD are indicated by shaded and vertical bars, respectively. ** and ***Different from wild type at P < 0.01 and 0.001, respectively (Fisher's exact test). ###Different between bracketed genotypes (Fisher's exact test).
Fig. 6. The D175V variant disrupts ODR-3 localization to the ASH cilia and impairs ASH-mediated behavior. a) Schematic of the amphid channel. Only AWC and ASH cilia are shown for simplicity. Socket and sheath are glial cells that form the channel. Anterior is up. b) Representative images showing localization of TagRFP-tagged WT and D175V variants of ODR-3 in ASH and ASI neurons. ASH and ASI neurons were visualized via expression of sra-6p::GFP. Arrowheads mark cilia base/TZ. Anterior is at the left. Scale: 5 μm. c) Quantification of relative TagRFP fluorescence inside the ASH cilium vs distal dendrite for the indicated TagRFP-tagged ODR-3 variants. Total number of ASH neurons analyzed for each variant: WT (n = 32), D175V (n = 65). ***Different from WT at P < 0.001 (Mann–Whitney test). d) Diagram of glycerol avoidance assay. e) Fraction of animals that remain inside of an 8M-glycerol ring after 2 min (osmotic avoidance index). Genotypes of assayed animals are indicated. Each data point represents a mean osmotic index per genotype per day. Three to 8 technical replicates were assayed per genotype per day. Total number of assayed animals: WT (n = 298), odr-3(lf) (n = 264), D175V (n = 224), D175 rescue (n = 157). Means ± SD are indicated by shaded and vertical bars, respectively. ** and ***Different from wild type at P < 0.01 and 0.001, respectively (Fisher's exact test). ###Different between bracketed genotypes (Fisher's exact test).CC BY · PubMed Central
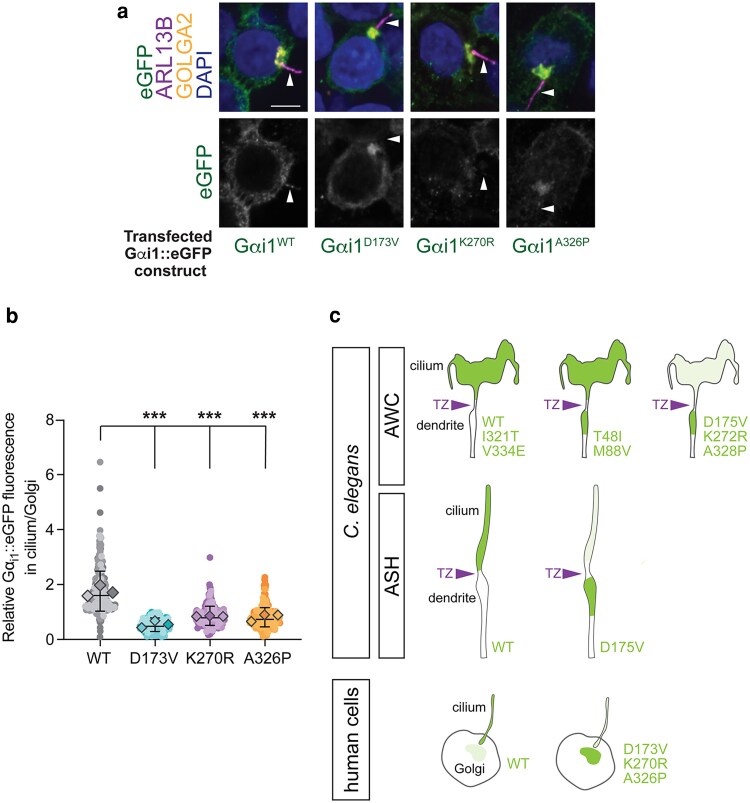
Fig. 7. The D173V, K270R, and A326P variants in GNAI1 impair cilia localization of the encoded proteins in human cells. a) Immunofluorescence images of fixed HEK293T cells transfected with the indicated eGFP-tagged Gαi1 variants. Arrowheads mark cilia labeled with anti-ARL13B antibody. DAPI and anti-GOLGA2 label DNA and Golgi, respectively. Scale: 5 μm. b) Quantification of relative eGFP fluorescence in cilium vs Golgi for the indicated eGFP-tagged Gαi1 variants. Individual biological replicates for each variant are shown in different shades of the corresponding color. Diamonds: means of individual biological replicates. Total mean ± SD across all biological replicates is indicated by horizontal and vertical bars, respectively. Total number of cells analyzed for each Gαi1 variant: WT (n = 322), D173V (n = 220), K270R (n = 260), A326P (n = 315). ***Different from Gαi1WT at P < 0.001 (Kruskal–Wallis with Dunn's multiple comparisons test). c) Graphical summary of localization patterns for the indicated ODR-3 and Gαi1 variants in C. elegans (AWC and ASH neurons) and mammalian cells, respectively. TZ, transition zone.
Fig. 7. The D173V, K270R, and A326P variants in GNAI1 impair cilia localization of the encoded proteins in human cells. a) Immunofluorescence images of fixed HEK293T cells transfected with the indicated eGFP-tagged Gαi1 variants. Arrowheads mark cilia labeled with anti-ARL13B antibody. DAPI and anti-GOLGA2 label DNA and Golgi, respectively. Scale: 5 μm. b) Quantification of relative eGFP fluorescence in cilium vs Golgi for the indicated eGFP-tagged Gαi1 variants. Individual biological replicates for each variant are shown in different shades of the corresponding color. Diamonds: means of individual biological replicates. Total mean ± SD across all biological replicates is indicated by horizontal and vertical bars, respectively. Total number of cells analyzed for each Gαi1 variant: WT (n = 322), D173V (n = 220), K270R (n = 260), A326P (n = 315). ***Different from Gαi1WT at P < 0.001 (Kruskal–Wallis with Dunn's multiple comparisons test). c) Graphical summary of localization patterns for the indicated ODR-3 and Gαi1 variants in C. elegans (AWC and ASH neurons) and mammalian cells, respectively. TZ, transition zone.CC BY · PubMed Central

Verification

Claims the paper makes

The claims and statistics of this paper haven’t been checked yet.

Run the check — free, no account needed. It reads the open-access text and checks the sources it cites.

A few free checks a day · papers already verified open instantly · results are public

Self-check

Percentages, sums and reported differences re-computed from the paper’s own numbers.

The self-check needs the paper’s full text.

Citations

No citation lists for this paper

No citation lists for this paper yet — checked again daily.

References 81 · Cited by 2

Research works printed but not linked: 73

  1. 10.1038/nsmb.2705 · DOI
  2. 10.1038/s41592-019-0530-8 · DOI
  3. 10.1016/0092-8674(93)80053-H · DOI
  4. 10.1016/j.pneurobio.2012.01.009 · DOI
  5. 10.1051/medsci/20031967725 · DOI
  6. 10.1371/journal.pgen.1011015 · DOI
  7. 10.1371/journal.pgen.1003977 · DOI
  8. 10.1371/journal.pgen.1006325 · DOI
  9. 10.1093/genetics/90.2.243 · DOI
  10. 10.3390/genes14020319 · DOI
  11. 10.1534/genetics.118.301532 · DOI
  12. 10.7554/elife.01948 · DOI
  13. 10.1126/science.aaa5264 · DOI
  14. 10.1212/WNL.0000000000004262 · DOI · Paper page
  15. 10.1093/genetics/iyab004 · DOI
  16. 10.1126/scisignal.2002223 · DOI
  17. 10.1101/cshperspect.a028134 · DOI · Paper page
  18. 10.1146/annurev.bi.56.070187.003151 · DOI
  19. 10.1093/genetics/iyab014 · DOI
  20. 10.1016/j.neuron.2014.04.024 · DOI · Paper page
  21. 10.1111/jnc.15205 · DOI
  22. 10.3389/fcell.2021.630161 · DOI · Paper page
  23. 10.1056/NEJMra1010172 · DOI · Paper page
  24. 10.1016/j.ceb.2016.02.008 · DOI · Paper page
  25. 10.1038/nature13908 · DOI · Paper page
  26. 10.15252/embj.201488044 · DOI
  27. 10.1016/j.tins.2024.03.004 · DOI
  28. 10.7554/elife.19238 · DOI
  29. 10.3390/jdb10040054 · DOI
  30. 10.1146/annurev.biophys.37.032807.125842 · DOI
  31. 10.1242/dev.044719 · DOI
  32. 10.1242/dev.099754 · DOI · Paper page
  33. 10.1093/hmg/ddab344 · DOI
  34. 10.1242/dmm.046631 · DOI
  35. 10.1534/genetics.103.024786 · DOI
  36. 10.1016/j.celrep.2015.08.032 · DOI
  37. 10.1097/WCO.0b013e3283444d05 · DOI · Paper page
  38. 10.1080/15592324.2021.2024405 · DOI
  39. 10.1161/CIRCGENETICS.117.002013 · DOI
  40. 10.1021/bi025514k · DOI
  41. 10.1016/j.celrep.2023.113173 · DOI
  42. 10.1038/s41436-020-01076-8 · DOI · Paper page
  43. 10.1016/j.celrep.2021.108718 · DOI
  44. 10.1016/j.devcel.2016.07.013 · DOI
  45. 10.1038/366654a0 · DOI
  46. 10.1038/nsmb1129 · DOI
  47. 10.1016/j.cub.2024.04.043 · DOI
  48. 10.1016/0012-1606(86)90314-3 · DOI · Paper page
  49. 10.1371/journal.pbio.3002892 · DOI
  50. 10.1038/nrm908 · DOI
  51. 10.1016/S0896-6273(03)00813-4 · DOI
  52. 10.1074/jbc.273.34.21752 · DOI
  53. 10.1038/nrm.2017.60 · DOI · Paper page
  54. 10.1016/S0896-6273(00)80434-1 · DOI
  55. 10.1016/j.celrep.2020.02.086 · DOI
  56. 10.1016/j.cell.2022.07.026 · DOI · Paper page
  57. 10.1038/nprot.2008.16 · DOI
  58. 10.1074/jbc.M115.665810 · DOI · Paper page
  59. 10.1146/annurev.biochem.66.1.639 · DOI
  60. 10.3390/cells11213384 · DOI
  61. 10.1016/j.semcdb.2020.07.014 · DOI
  62. 10.1038/nsmb.3070 · DOI
  63. 10.1038/nrneurol.2013.247 · DOI · Paper page
  64. 10.1093/nar/gkab1061 · DOI · Paper page
  65. 10.1093/hmg/ddab235 · DOI
  66. 10.1152/physrev.00003.2005 · DOI
  67. 10.1093/hmg/ddz051 · DOI
  68. 10.1101/gad.173443.111 · DOI
  69. 10.1016/j.neuron.2023.09.032 · DOI
  70. 10.1104/pp.16.00470 · DOI
  71. 10.1038/ncomms1750 · DOI
  72. 10.1016/j.str.2019.04.013 · DOI
  73. 10.1038/nn.2835 · DOI

Metadata

Authors
Salama, R., Peet, E., Morrione, L., Durant, S., Seager, M., Rennie, M., Scarlata, S., & Nechipurenko, I.
Affiliations
Worcester Polytechnic Institute (US)
Corresponding author
Nechipurenko, Inna
Venue
Genetics
Publisher
openRxiv
Published
2025-08-22
Volume
231
Issue
4
ISSN
0016-6731 (ISSN-L)
OpenAlex
W4414867018
Cited by
2
References
81
Citations by year
2026: 1 · 2025: 1
FWCI
1.17
Type
journal article
Language
en
Open access
Locations
  • Genetics (publishedVersion, cc-by)
  • bioRxiv (Cold Spring Harbor Laboratory) (acceptedVersion, cc-by)
  • PubMed Central (publishedVersion, cc-by)
  • PubMed (publishedVersion)
  • PubMed Central (submittedVersion, cc-by)
Funders
  • Charles H. Hood Foundation
  • National Institutes of Health (1r35gm155316-01, OD010440, P40OD010440)
  • National Institute of General Medical Sciences (R35 GM155316)
  • Office of Research Infrastructure Programs, National Institutes of Health (P40OD010440)
Topics
  • Life Sciences › Biochemistry, Genetics and Molecular Biology › Genetics › Genetic and Kidney Cyst Diseases
  • Health Sciences › Medicine › Pulmonary and Respiratory Medicine › Cystic Fibrosis Research Advances
  • Life Sciences › Biochemistry, Genetics and Molecular Biology › Genetics › Genomics and Rare Diseases
Keywords
GNAI1, Gαi1, heterotrimeric G proteins, intellectual disability, developmental delay, epilepsy, ciliogenesis, primary cilia, AWC neurons, odr-3, Caenorhabditis elegans, chemotaxis, sensory neurons, ciliary localization

About these checks

Registry, retraction, Cites and statistics results are computed, not judged, with one exception: a printed reference that no index lists is read once by a model before it counts as a citation error. Claims are extracted by a model and kept only when their quote appears verbatim in the text; each cited source is then checked, with a model’s help, for whether it says what the claim relies on. Those verdicts can be wrong — read the claim’s quote and the cited source before relying on one.

Statistics and arithmetic are recomputed, not judged.

Confidence bands are shown only for fields calibrated on our annotated test set. None is calibrated yet, so no band is shown.

What counts as a claim ›How we measure confidence ›How we check this ›

Are you an author, or do you see a problem with this page? Request a review

How to cite

Cite CoChat for the checks on this page, and the paper for its own findings.

This page
CoChat. (2026). Citation check: Functional classification of GNAI1 disorder variants in C. elegans uncovers conserved and cell-specific mechanisms of dysfunction. https://app.cochat.ai/papers/10.1101/2025.08.18.670960
The paper
Salama, R., Peet, E., Morrione, L., Durant, S., Seager, M., Rennie, M., Scarlata, S., & Nechipurenko, I. (2025). Functional classification of GNAI1 disorder variants in C. elegans uncovers conserved and cell-specific mechanisms of dysfunction. Genetics. https://doi.org/10.1101/2025.08.18.670960