

The DOI matches its Crossref record; 49 of the 49 references it cites were found in a registry or an index.
Interrogating the structure and function of the human voltage-gated proton channel (hHv1) with a fluorescent noncanonical amino acid
Open accessPreprint — published as 10.7554/elife.110161.3 · Paper page
Abstract
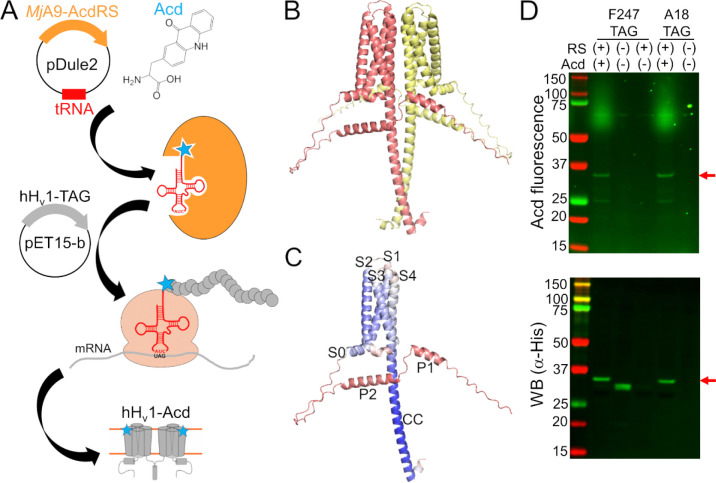
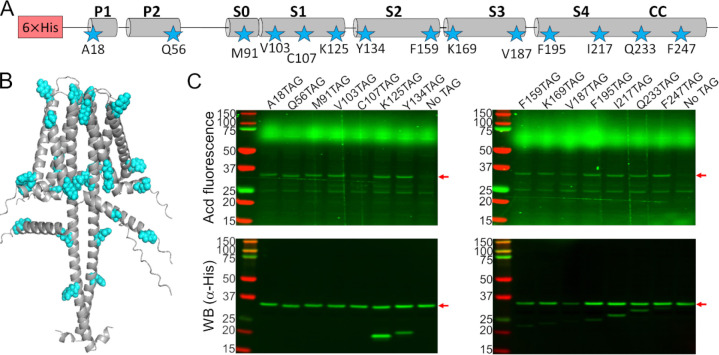
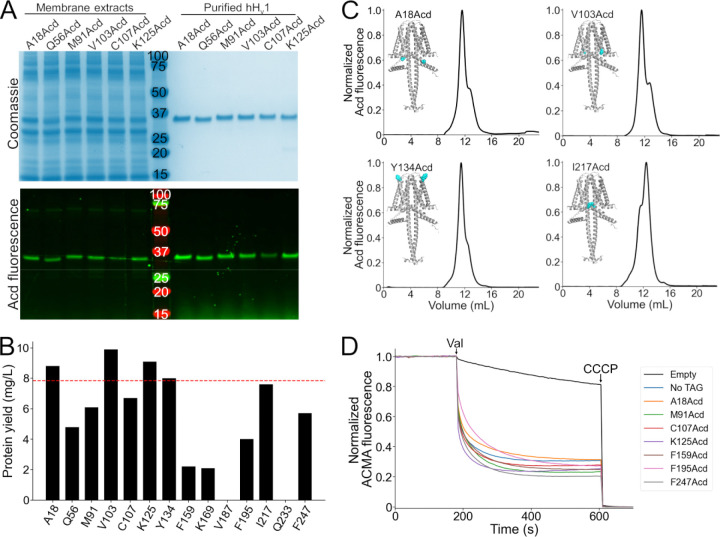
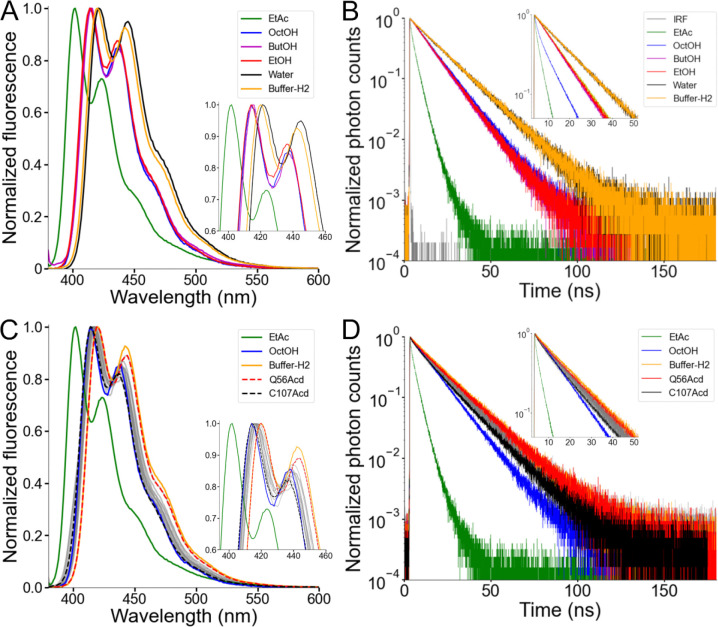
The human voltage-gated proton channel (hH v 1) is a dimer of voltage-sensor domains (VSDs) containing highly selective proton permeation pathways in each monomer. In addition to voltage, hH v 1 is regulated by other stimuli, including pH gradients, mechanical forces, and ligands such as Zn 2+ . Aside from the VSDs, this membrane protein contains an N-terminal domain and a C-terminal coiled-coil domain (CC) formed between the monomers. To address the need for direct measurements of conformational rearrangements in hH v 1, we developed a Förster resonance energy transfer (FRET) approach to measuring the conformational rearrangements in full-length hH v 1 purified from E. coli . We used genetic code expansion (GCE) to generate a library of 14 full-length hH v 1 constructs, each incorporating the fluorescent noncanonical amino acid acridon-2-ylalanine (Acd) at a different site throughout the various structural domains. Following the expression and purification of these hH v 1-Acd proteins, we found that 12 sites yielded stable and functional proton-permeable channels. The fluorescence properties of Acd at each site showed small site-specific differences. Furthermore, we measured site-specific FRET efficiencies from tryptophan (Trp) and tyrosine (Tyr) to Acd in the hH v 1-Acd proteins and found results consistent with correct folding in detergent micelles. Finally, the addition of Zn 2+ produced reversible changes in FRET, with affected residues clustered on the intracellular side of the channel.
Overview
The claims and statistics of this paper haven’t been checked yet.
Run the check — free, no account needed. It reads the open-access text and checks the sources it cites.
Integrity signals
Registry
Cites
Statistics
Figures
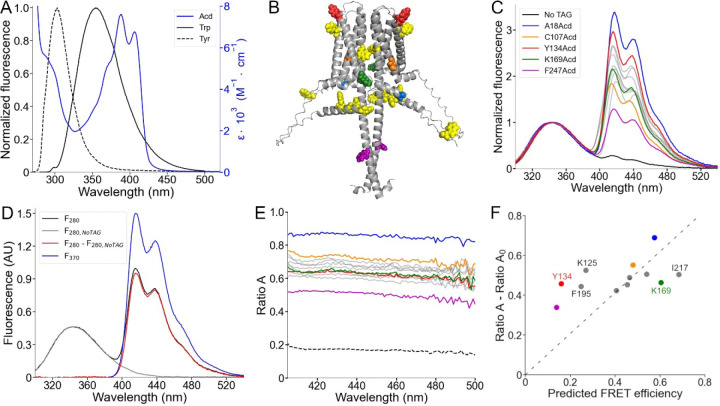
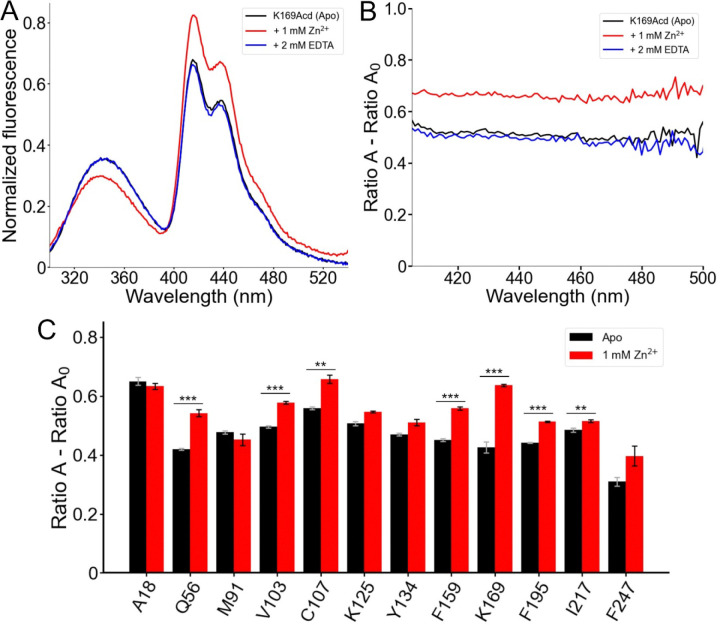
Verification
Claims the paper makes
The claims and statistics of this paper haven’t been checked yet.
Run the check — free, no account needed. It reads the open-access text and checks the sources it cites.
Self-check
Percentages, sums and reported differences re-computed from the paper’s own numbers.
The self-check needs the paper’s full text.
Citations
Cites
Highly accurate protein structure prediction with AlphaFold
Jumper, J., Evans, R., Pritzel, A., Green, T., Figurnov, M., Ronneberger, O., Tunyasuvunakool, K., Bates, R., Žídek, A., Potapenko, A., et al. (2021) · Nature · doi:10.1038/s41586-021-03819-2 · Cited by 43,764
Principles of Fluorescence Spectroscopy
(2006) · Springer eBooks · doi:10.1007/978-0-387-46312-4 · Cited by 19,339
Protein production by auto-induction in high-density shaking cultures
Studier, F. W. (2005) · Protein Expression and Purification · doi:10.1016/j.pep.2005.01.016 · Cited by 5,949
Dynamic personalities of proteins
Henzler-Wildman, K., & Kern, D. (2007) · Nature · doi:10.1038/nature06522 · Cited by 2,545
Adding New Chemistries to the Genetic Code
Liu, C. C., & Schultz, P. G. (2010) · Annual Review of Biochemistry · doi:10.1146/annurev.biochem.052308.105824 · Cited by 1,725
[18] Fluorescence resonance energy transfer and nucleic acids
Clegg, R. M. (1992) · Methods in Enzymology · doi:10.1016/0076-6879(92)11020-j · Cited by 735
Kawate, T., & Gouaux, E. (2006) · Structure · doi:10.1016/j.str.2006.01.013 · Cited by 727
An Enhanced System for Unnatural Amino Acid Mutagenesis in E. coli
Young, T. S., Ahmad, I., Yin, J. A., & Schultz, P. G. (2010) · Journal of Molecular Biology · doi:10.1016/j.jmb.2009.10.030 · Cited by 637
A voltage-gated proton-selective channel lacking the pore domain
Ramsey, I. S., Moran, M. M., Chong, J. A., & Clapham, D. E. (2006) · Nature · doi:10.1038/nature04700 · Cited by 612
A Voltage Sensor-Domain Protein Is a Voltage-Gated Proton Channel
Sasaki, M., Takagi, M., & Okamura, Y. (2006) · Science · doi:10.1126/science.1122352 · Cited by 542
X-ray crystal structure of voltage-gated proton channel
Takeshita, K., Sakata, S., Yamashita, E., Fujiwara, Y., Kawanabe, A., Kurokawa, T., Okochi, Y., Matsuda, M., Narita, H., Okamura, Y., et al. (2014) · Nature Structural & Molecular Biology · doi:10.1038/nsmb.2783 · Cited by 215
Multimeric nature of voltage-gated proton channels
Koch, H. P., Kurokawa, T., Okochi, Y., Sasaki, M., Okamura, Y., & Larsson, H. P. (2008) · Proceedings of the National Academy of Sciences · doi:10.1073/pnas.0801553105 · Cited by 206
Cherny, V. V., Markin, V. S., & DeCoursey, T. E. (1995) · The Journal of General Physiology · doi:10.1085/jgp.105.6.861 · Cited by 193
Dimeric subunit stoichiometry of the human voltage-dependent proton channel Hv1
Lee, S., Letts, J. A., & MacKinnon, R. (2008) · Proceedings of the National Academy of Sciences · doi:10.1073/pnas.0803277105 · Cited by 192
Easy and accurate protein structure prediction using ColabFold
Kim, G., Lee, S., Karin, E. L., Kim, H., Moriwaki, Y., Ovchinnikov, S., Steinegger, M., & Mirdita, M. (2024) · Nature Protocols · doi:10.1038/s41596-024-01060-5 · Cited by 184
Cherny, V. V., & DeCoursey, T. E. (1999) · The Journal of General Physiology · doi:10.1085/jgp.114.6.819 · Cited by 169
Strong cooperativity between subunits in voltage-gated proton channels
Gonzalez, C. L., Koch, H. P., Drum, B. M., & Larsson, H. P. (2009) · Nature Structural & Molecular Biology · doi:10.1038/nsmb.1739 · Cited by 139
Voltage-activated hydrogen ion currents
DeCoursey, T. E., & Cherny, V. V. (1994) · The Journal of Membrane Biology · doi:10.1007/bf00235130 · Cited by 136
Speight, L. C., Muthusamy, A. K., Goldberg, J. M., Warner, J. B., Wissner, R. F., Willi, T. S., Woodman, B. F., Mehl, R. A., & Petersson, E. J. (2013) · Journal of the American Chemical Society · doi:10.1021/ja403247j · Cited by 118
Functional Reconstitution of Purified Human Hv1 H+ Channels
Lee, S., Letts, J. A., & MacKinnon, R. (2009) · Journal of Molecular Biology · doi:10.1016/j.jmb.2009.02.034 · Cited by 112
Zinc inhibition of monomeric and dimeric proton channels suggests cooperative gating
Musset, B., Smith, S. M. E., Rajan, S., Cherny, V. V., Sujai, S., Morgan, D., & DeCoursey, T. E. (2010) · The Journal of Physiology · doi:10.1113/jphysiol.2010.188318 · Cited by 111
Resting state of the human proton channel dimer in a lipid bilayer
Li, Q., Shen, R., Treger, J. S., Wanderling, S. S., Milewski, W. M., Siwowska, K., Bezanilla, F., & Perozo, E. (2015) · Proceedings of the National Academy of Sciences · doi:10.1073/pnas.1515043112 · Cited by 87
Taraska, J. W., Puljung, M. C., & Zagotta, W. N. (2009) · Proceedings of the National Academy of Sciences · doi:10.1073/pnas.0905207106 · Cited by 82
Self-citationchiLife: An open-source Python package for in silico spin labeling and integrative protein modeling
Tessmer, M. H., & Stoll, S. (2023) · PLoS Computational Biology · doi:10.1371/journal.pcbi.1010834 · Cited by 81
Zheng, J., Varnum, M. D., & Zagotta, W. N. (2003) · Journal of Neuroscience · doi:10.1523/jneurosci.23-22-08167.2003 · Cited by 69
Self-citationVisualizing conformational dynamics of proteins in solution and at the cell membrane
Gordon, S. E., Munari, M. A., & Zagotta, W. N. (2018) · eLife · doi:10.7554/elife.37248 · Cited by 62
Self-citationMolecular mechanism of Zn 2+ inhibition of a voltage-gated proton channel
Qiu, F., Chamberlin, A. C., Watkins, B. M., Ionescu, A., Perez, M. E., Barro-Soria, R., Gonzalez, C. L., Noskov, S. Y., & Larsson, H. P. (2016) · Proceedings of the National Academy of Sciences · doi:10.1073/pnas.1604082113 · Cited by 60
A specialized molecular motion opens the Hv1 voltage-gated proton channel
Mony, L., Berger, T. K., & Isacoff, E. Y. (2015) · Nature Structural & Molecular Biology · doi:10.1038/nsmb.2978 · Cited by 58
Jones, C. M., Robkis, D. M., Blizzard, R. J., Munari, M. A., Venkatesh, Y., Mihaila, T. S., Eddins, A. J., Mehl, R. A., Zagotta, W. N., Gordon, S. E., et al. (2021) · Chemical Science · doi:10.1039/d1sc01914g · Cited by 57
Self-citationSungwienwong, I., Hostetler, Z. M., Blizzard, R. J., Porter, J. J., Driggers, C., Mbengi, L., Villegas, J. A., Speight, L. C., Saven, J. G., Perona, J. J., et al. (2017) · Organic & Biomolecular Chemistry · doi:10.1039/c7ob00582b · Cited by 52
Zagotta, W. N., Sim, B. S., Nhim, A., Raza, M. M., Evans, E. G. B., Venkatesh, Y., Jones, C. M., Mehl, R. A., Petersson, E. J., & Gordon, S. E. (2021) · eLife · doi:10.7554/elife.70236 · Cited by 43
Self-citationThe Hv1 proton channel responds to mechanical stimuli
Pathak, M. M., Tran, T. T., Hong, L., Joós, B., Morris, C. E., & Tombola, F. (2016) · The Journal of General Physiology · doi:10.1085/jgp.201611672 · Cited by 41
Gating charge displacement in a monomeric voltage-gated proton (H v 1) channel
Carmona, E. M., Larsson, H. P., Neely, A., Alvarez, O. A., Latorre, R., & Gonzalez, C. L. (2018) · Proceedings of the National Academy of Sciences · doi:10.1073/pnas.1809705115 · Cited by 37
Self-citationSzymańska, A., Wegner, K., & Łankiewicz, L. (2003) · Helvetica Chimica Acta · doi:10.1002/hlca.200390275 · Cited by 35
Nuclear Magnetic Resonance Solution Structure and Functional Behavior of the Human Proton Channel
Bayrhuber, M., Maslennikov, I., Kwiatkowski, W., Sobol, A., Wierschem, C., Eichmann, C., Frey, L., & Riek, R. (2019) · Biochemistry · doi:10.1021/acs.biochem.9b00471 · Cited by 33
Cholesterol inhibits human voltage-gated proton channel hHv1
Han, S., Chu, X., Goodson, R., Gamel, P., Peng, S., Vance, J., & Wang, S. (2022) · Proceedings of the National Academy of Sciences · doi:10.1073/pnas.2205420119 · Cited by 31
The voltage sensor is responsible for ΔpH dependence in H v 1 channels
Carmona, E. M., Fernández, M., Alvear-Arias, J. J., Neely, A., Larsson, H. P., Alvarez, O. A., Gárate, J. A., Latorre, R., & Gonzalez, C. L. (2021) · Proceedings of the National Academy of Sciences · doi:10.1073/pnas.2025556118 · Cited by 29
Self-citationMeasuring conformational equilibria in allosteric proteins with time-resolved tmFRET
Zagotta, W. N., Evans, E. G. B., Eggan, P., Tessmer, M. H., Shaffer, K. D., Petersson, E. J., Stoll, S., & Gordon, S. E. (2024) · Biophysical Journal · doi:10.1016/j.bpj.2024.01.033 · Cited by 28
Self-citationLong-distance tmFRET using bipyridyl- and phenanthroline-based ligands
Gordon, S. E., Evans, E. G. B., Otto, S. C., Tessmer, M. H., Shaffer, K. D., Gordon, M. T., Petersson, E. J., Stoll, S., & Zagotta, W. N. (2024) · Biophysical Journal · doi:10.1016/j.bpj.2024.01.034 · Cited by 28
Self-citationCoupling between an electrostatic network and the Zn2+ binding site modulates Hv1 activation
la Rosa, V. D., Bennett, A. L., & Ramsey, I. S. (2018) · The Journal of General Physiology · doi:10.1085/jgp.201711822 · Cited by 26
Structural dynamics determine voltage and pH gating in human voltage-gated proton channel
Han, S., Peng, S., Vance, J., Tran, K., Do, N., Gates, D., Bui, N., Gui, Z., & Wang, S. (2022) · eLife · doi:10.7554/elife.73093 · Cited by 23
Suárez-Delgado, E., Orozco-Contreras, M. E., Rangel‐Yescas, G. E., & Islas, L. D. (2023) · eLife · doi:10.7554/elife.85836 · Cited by 23
Assessing Structural Determinants of Zn2+ Binding to Human HV1 via Multiple MD Simulations
Jardin, C., Chaves, G., & Musset, B. (2020) · Biophysical Journal · doi:10.1016/j.bpj.2019.12.035 · Cited by 20
Tang, D., Yang, Y., Xiao, Z., Xu, J., Yang, Q., Dai, H., Liang, S., Tang, C. W., Dong, H., & Liu, Z. (2020) · British Journal of Pharmacology · doi:10.1111/bph.14984 · Cited by 20
Schulman, S. G., & Sturgeon, R. J. (1977) · Analytica Chimica Acta · doi:10.1016/0003-2670(77)80027-5 · Cited by 12
Carmona, E. M., Cortés, D. M., & Cuello, L. G. (2025) · Protein Science · doi:10.1002/pro.70017 · Cited by 6
Self-citationExpression and Purification of the Human Voltage-Gated Proton Channel (hHv1)
Carmona, E. M., Cortés, D. M., & Cuello, L. G. (2025) · BIO-PROTOCOL · doi:10.21769/bioprotoc.5344 · Cited by 5
Self-citationEggan, P., Gordon, S. E., & Zagotta, W. N. (2025) · eLife · doi:10.7554/elife.106892.3 · Cited by 1
Self-citationEggan, P., Gordon, S. E., & Zagotta, W. N. (2025) · eLife · doi:10.7554/elife.106892.1 · Cited by 1
Self-citation
Research works printed but not linked: 2
- J. R. Lakowicz , Ed., Principles of Fluorescence Spectroscopy (Springer US, 2006). · DOI · Paper page
- 10.1371/journal.pcbi.1010834 · DOI
Metadata
- Authors
- Carmona, E. M., Zagotta, W. N., & Gordon, S. E.
- Affiliations
- University of Washington (US)
- Corresponding author
- Gordon, Sharona E.
- Venue
- eLife
- Publisher
- openRxiv
- Published
- 2025-10-24
- Volume
- 15
- ISSN
- 2050-084X (ISSN-L)
- PMC
- PMC12633253
- OpenAlex
- W4415532066
- Cited by
- 0
- References
- 49
- FWCI
- 0.00
- Type
- journal article
- Language
- en
- Open access
- gold
- doi.org
- Licence
- Locations
- eLife (publishedVersion, cc-by)
- bioRxiv (Cold Spring Harbor Laboratory) (acceptedVersion, cc-by)
- PubMed (publishedVersion)
- PubMed Central (publishedVersion, cc-by)
- Europe PMC (PubMed Central) (submittedVersion, cc-by)
- Funders
- National Institutes of Health (R01EY037223, R35GM145225, R01EY010329, R35GM148137)
- Topics
- Life Sciences › Biochemistry, Genetics and Molecular Biology › Molecular Biology › Ion channel regulation and function
- Life Sciences › Biochemistry, Genetics and Molecular Biology › Biophysics › Advanced Fluorescence Microscopy Techniques
- Life Sciences › Biochemistry, Genetics and Molecular Biology › Molecular Biology › Protein Structure and Dynamics
- Keywords
- genetic code expansion, fluorescence resonance energy transfer, conformational change, zinc regulation, voltage-sensing domain, coiled-coil domain, detergent micelles
About these checks
Registry, retraction, Cites and statistics results are computed, not judged, with one exception: a printed reference that no index lists is read once by a model before it counts as a citation error. Claims are extracted by a model and kept only when their quote appears verbatim in the text; each cited source is then checked, with a model’s help, for whether it says what the claim relies on. Those verdicts can be wrong — read the claim’s quote and the cited source before relying on one.
Statistics and arithmetic are recomputed, not judged.
Confidence bands are shown only for fields calibrated on our annotated test set. None is calibrated yet, so no band is shown.
What counts as a claim ›How we measure confidence ›How we check this ›
Are you an author, or do you see a problem with this page? Request a review
Data sources
Bibliographic data: Semantic Scholar, OpenAlex, Crossref.
Contains information from the Semantic Scholar Academic Graph Datasets, made available under the ODC Attribution License (ODC-BY 1.0).
Semantic Scholar’s data is described in: Kinney, R., et al. (2023). The Semantic Scholar Open Data Platform. arXiv:2301.10140.
